535 E Washington St · Rochester, PA
Flood risk No data
- FEMA flood zone
- —
- Chance of flooding over 30 yrs
- —
- Est. flood insurance / yr
- —
Fire risk No data
- Est. fire insurance / yr
- —
Heat risk No data
- Hot days now (above threshold)
- —
- Hot days in 30 yrs
- —
Wind risk No data
- Chance of severe wind over 30 yrs
- —
Air-quality risk No data
- Unhealthy air days now
- —
- Unhealthy air days in 30 yrs
- —
Risk factors via First Street. Map © Google.
Why this score? — see what drove the B+ grade
The composite is a weighted blend of 9 inputs, each scored 0–100. Each bar is that input's sub-score; the figure is the points it added to the 100-point composite (weight × sub-score).
- Cash flow +30.0/30.0
- ARV discount +15.0/15.0
- 1% rule +10.0/10.0
- DSCR +10.0/10.0
- Livability +4.0/5.0
- Schools +3.3/10.0
- Rent growth +2.5/5.0
- Condition / age +2.2/5.0
- Appreciation +0.0/10.0
$42,000
🖨 Deal sheet 📄 Offer letter ✓ Due diligence
Listing remarks
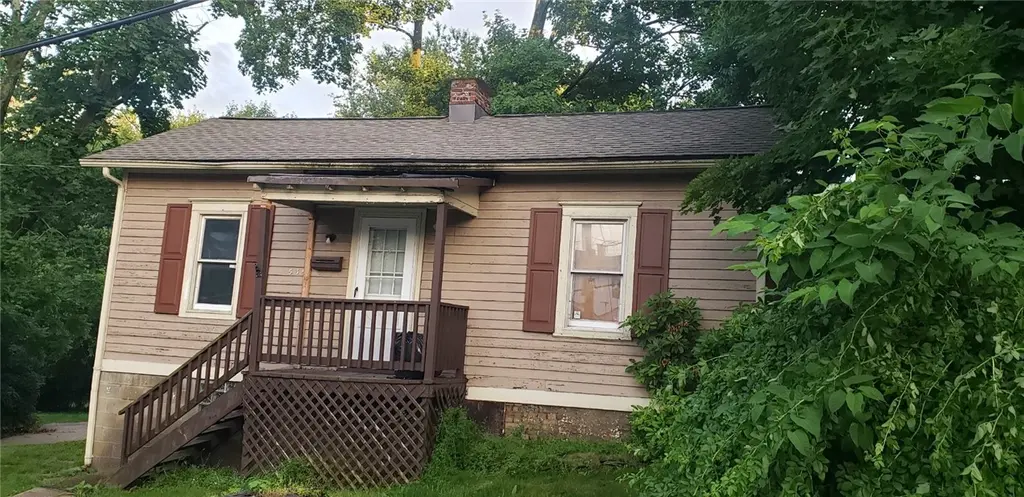
Located at 535 E Washington St in Rochester within the Aliquippa School District, this 2-bedroom, 1-bath home offers a functional layout with comfortable living spaces and tons of storage throughout. The interior provides practical room configurations that make everyday living efficient, while additional storage areas add flexibility for household needs, hobbies, or seasonal items. Conveniently situated near local amenities, this property presents a solid investment opportunity.
Key facts
- Tons of storage
- Functional layout
- 4,356 sq ft lot
Tags
Property features AI
Exterior
- Utilities: Public water; Public sewer
- Home design: One-story property; Resale property
- Construction: Built previously (year not provided)
Interior
- Bathrooms: 1 full bathroom
- Heating & cooling: Forced air heating (gas); Central air conditioning
- Interior features: Basement
Neighborhood map
What this means for you Summary
Snapshot
- This is a 2-bed/1.0-bath single-family listed at $42k. Condition is rated fair.
Deal economics
- At list price, monthly cash flow is $502 ($6k/yr) — positive.
- The deal already cash-flows at list — no discount required.
- Meets the 1% rule at list price ($1k rent vs $42k).
Location & tenants
- Location reads 80/100 on livability (#220 in PA, #1,937 nationally) — a professional / high-income tenant draw. Strengths: commute A+, cost of living A+, health & safety A+; Watch: schools C-, amenities D, crime F.
- Rochester Area SD (rural): math 28% / reading 50% proficiency, ranked #375 of 539 in PA (top 70%) — families likely to look elsewhere, expect single-tenant / working-renter base with shorter leases.
- Market conditions: 36 active listings in the ZIP; 7 comparable units currently listed for rent nearby; rentals leasing fast (median 2d on market — plan ~1-2 weeks tenant-placement turnaround); 272 units permitted in Beaver County in 2024 (80 in 5+ unit buildings).
Forward outlook
- Local home prices are declining (-3.0%/yr); year-one equity from $290 of loan paydown is wiped out by about $1k of value loss. Plan a longer hold.
- Beaver County population projected at -14% by 2050 — secular population decline; favor cash flow + early exit over multi-decade hold.
- At projected returns (-3.0% appreciation + 3.0% rent growth), your $12k cash investment doubles in ~3 years — after that, you're playing with house money.
Negotiation context
- Only 3 days on market — expect competitive offers; lowballing is unlikely to land.
Risks & watch-outs
- Watch-outs: built in 1900 — expect roof / HVAC / electrical / plumbing capex.
Questions for the listing agent
- Have any recent inspections been done? Can we get a copy of the seller's disclosures and any deferred-maintenance estimates?
- Built in 1900 — when were the roof, HVAC, electrical panel, plumbing, and water heater last replaced?
- Is there a deadline driving the sale (1031 exchange, divorce, estate, relocation)? That informs how much negotiation room exists.
- Crime grade is F in this area — have there been break-ins, vandalism, or insurance claims at this property in the last 3 years? What carrier currently insures it and at what premium?
- What's the average days-on-market for RENTAL listings here right now (not sales)? A rising rental-DOM trend means longer vacancies and softer asking-rent achievability than the comps imply.
- What's the recent tenant-quality profile in this submarket — average credit score on applications, eviction rate, late-payment / NSF rate, and stable-employment percentage? A property-management company in the area should have these aggregated.
- How much new for-sale + rental construction is in the pipeline within 1–3 miles? Heavy new supply typically softens prices + rents 12–24 months out; constrained supply supports both.
Investment metrics
- 1% rule
- 2.39% ✓
- Cap rate
- 20.63%
- Cash-on-cash
- 51.22%
- DSCR
- 3.28
- GRM
- 3.5
CMA / ARV
- ARV (on-the-fly)
- $67,200
- Comps found
- 9
Show comp detail 9 sales within ~0.75 mi
| Address | Dist | Beds/Ba | Sqft | Sold | Price | $/sf | Match |
|---|---|---|---|---|---|---|---|
| 825 Walnut St | 0.14mi | 2/1.0 | 840 (0%) | 5mo | $92,500 | $110 | 89 |
| 1370 Charlotte Ave | 0.28mi | 2/1.0 | 848 (+1%) | 3mo | $118,000 | $139 | 83 |
| 609 Lincoln St | 0.25mi | 2/1.0 | 896 (+7%) | 6mo | $40,000 | $45 | 72 |
| 100 Quarry St | 0.27mi | 3/1.0 (+1) | 864 (+3%) | 9mo | $55,000 | $64 | 70 |
| 519 Lincoln St | 0.23mi | 2/1.5 | 848 (+1%) | 20mo | $95,000 | $112 | 69 |
| 442 E Washington St | 0.21mi | 3/1.5 (+1) | 896 (+7%) | 7mo | $55,000 | $61 | 66 |
| 452 Webster St | 0.46mi | 2/1.0 | 896 (+7%) | 12mo | $115,000 | $128 | 57 |
| 444 Ohio Ave | 0.47mi | 2/1.0 | 952 (+13%) | 13mo | $25,000 | $26 | 45 |
| 853 5th St | 0.55mi | 3/1.0 (+1) | 739 (-12%) | 10mo | $59,000 | $80 | 41 |
Match score weights: distance 35% · size 25% · config 20% · recency 20%. Top-matched comps best support the ARV.
Projected returns pro-forma
-3.0% appreciation · 3.0% rent growth · sell at horizon
- IRR
- 49.1%
- Equity multiple
- 3.14×
- Total profit
- $25,176
- Equity at exit
- $6,262
- IRR
- 54.6%
- Equity multiple
- 6.37×
- Total profit
- $63,147
- Equity at exit
- $3,631
Cash invested: $11,760 (down + closing). Projections, not guarantees.
Landlord ↔ Tenant lean methodology
- Overall (STATE)
- 62 Landlord-Friendly
- State Pennsylvania
- 62 Landlord-Friendly · EVEN
- County
- — inherits STATE
- City
- — inherits STATE
ZIP-level market 15074
- Active inventory
- 36
- Price-to-rent
- 3.5×
Monthly cashflow live
- Estimated rent
- $1,003 high interval (Pro) →
- Mortgage (P&I)
- −$220
- Tax est. 1.5%
- −$52 /mo · $630/yr
- Insurance
- −$18
- HOA
- −$0
- Vacancy / Maint / Mgmt
- −$211
- Net cashflow
- $502
Break-even live
UW: 25.0% down · 7.5% · 30yr · 1.5% tax · 5.0% vac · 8.0% maint · 8.0% mgmt
Financing live
Cash to close
- Down payment
- $10,500
- Closing costs
- $1,260
- Reserves months
- —
- Total cash needed
- —
Loan-product check · same deal, 3 products live
Conventional
25% down · 7.5% · 30yr
- Down + closing
- —
- Monthly P&I
- —
- Monthly cashflow
- —
- DSCR
- —
- Eligible?
- —
Personal DTI + credit; lowest rate.
DSCR
20% down · 8.5% · 30yr
- Down + closing
- —
- Monthly P&I
- —
- Monthly cashflow
- —
- DSCR
- —
- Eligible?
- —
No personal income docs; deal must DSCR.
Hard money
10% down · 12.0% · 12mo
- Down + closing
- —
- Monthly P&I
- —
- Monthly cashflow
- —
- DSCR
- —
- Eligible?
- —
Short-term bridge; refi at stabilization.
Rent comps 7 comps
| Address | Beds | Baths | Sqft | Rent | $/sqft | DOM | Units | Dist |
|---|---|---|---|---|---|---|---|---|
| 526 Adams St Unit 2 Rochester, PA | 3.0 | 1.0 | 1000 | $850 | $0.85 | 43d | 1 | 0.10mi |
| 243 Pennsylvania Ave Unit 1 Rochester, PA | 2.0 | 1.0 | 1000 | $1,100 | $1.10 | 14d | 1 | 0.14mi |
| 467 Reno St Rochester, PA | 3.0 | 1.0 | 1092 | $1,200 | $1.10 | 1d | 1 | 0.27mi |
| 230 W Madison St Unit 6 Rochester, PA | 2.0 | 1.0 | 975 | $1,100 | $1.13 | 1d | 1 | 0.49mi |
| 549 Virginia Ave Unit 1 Rochester, PA | 2.0 | 1.0 | 1000 | $1,075 | $1.07 | 7d | 1 | 0.66mi |
| 718 Virginia Ave Unit 2 Rochester, PA | 2.0 | 1.0 | 750 | $850 | $1.13 | 1d | 1 | 1.06mi |
| 264 Beaver St Beaver, PA | 1.0 | 1.0 | 800 | $950 | $1.19 | 1d | 1 | 1.42mi |
Listing history 3 events
-
2026-06-18days on market $42,000 Active 3 DOM
-
2026-06-17remarks 483-char remark
-
2026-06-17$42,000 Active 2 DOM
ⓘ Source: listings_history table (triggers on properties + properties_extension) + one-shot
backfill from property_details.listing_events for pre-trigger history.
Nearby sold comps map
Loading sold comps map…
Walkable amenities ~0.75 mi
Loading nearby amenities…
Taxation est. · year 1
- Rental income
- $12,033
- − Mortgage interest
- −$2,353
- − Property taxes
- −$630
- − Insurance
- −$210
- − Repairs & maintenance
- −$963
- − Management
- −$963
- − Depreciation
- −$1,222
- Taxable income
- $5,693
- Est. tax owed @ 24.0%
- −$1,366
- After-tax cash flow
- $4,657/yr
For passive investors: Depreciation is non-cash, so a rental often shows a tax loss while cash-flowing — sheltering income. Rental losses are passive: they offset passive income freely, and up to $25,000/yr can offset ordinary (W-2) income if you actively participate and your MAGI is under $100k (phasing out to $0 by $150k); unused losses carry forward. On sale, claimed depreciation is recaptured at up to 25%, and gains may owe capital-gains tax (a 1031 exchange can defer both). Figures are a year-1 estimate at your 24.0% rate — not tax advice; consult a CPA.
Condition & rehab AI · 12 photos
This 2-bedroom, 1-bath home requires moderate renovations to improve its condition and increase its value. Key areas for improvement include the exterior siding, electrical panel, and bathtub. Upgrades in these areas can significantly enhance the home's curb appeal and livability.
Repairs flagged
- Major Bathtub — Severe staining and dirt require a thorough cleaning and possibly a new tub installation.
- Major Exterior siding — Weathered appearance indicates significant wear and needs repainting or replacement.
- Moderate Electrical panel — Appears old and possibly in need of an upgrade for safety and functionality.
- Minor Landscaping — Overgrown vegetation can be trimmed and landscaped to improve curb appeal.
Value-add opportunities
- Both Paint exterior siding — Improves curb appeal and can increase both resale and rental value.
- Both Replace or clean bathtub — A clean and functional bathtub enhances the home's livability and can attract more buyers or renters.
- Both Upgrade electrical panel — A modern electrical panel ensures safety and can improve the home's overall appeal to potential buyers or renters.
Renovation cost estimate screening
| Repair item | Severity | Est. cost |
|---|---|---|
| Bathtub · Severe staining and dirt require a thorough cleaning and possibly a new tub installation. | Major | $15,000–50,000 |
| Exterior siding · Weathered appearance indicates significant wear and needs repainting or replacement. | Major | $15,000–50,000 |
| Electrical panel · Appears old and possibly in need of an upgrade for safety and functionality. | Moderate | $3,000–15,000 |
| Landscaping · Overgrown vegetation can be trimmed and landscaped to improve curb appeal. | Minor | $500–3,000 |
| Total estimated repair cost · 4 items | $33,500–118,000 |
Value-add ROI direction
- Both Paint exterior siding — Improves curb appeal and can increase both resale and rental value. ↑
- Both Replace or clean bathtub — A clean and functional bathtub enhances the home's livability and can attract more buyers or renters. ↑
- Both Upgrade electrical panel — A modern electrical panel ensures safety and can improve the home's overall appeal to potential buyers or renters. ↑
ⓘ Cost ranges are severity-bucket heuristics (US national rule-of-thumb). Get contractor quotes + a written scope before underwriting a rehab budget.
Schools (NCES district)
- District
- Rochester Area SD
- NCES district ID
- 4220460
- Math proficiency
- 28% ▼ -3.00%
- Reading proficiency
- 50% ▼ -9.00%
- Median HH income
- $40,841
- Composite
- 32.7/100
- National rank
- #5644
- State rank
- #375 of 539 in PA
Livability — Rochester
- Score
- 80/100
- State rank
- #220
- US rank
- #1937
Category grades
Schools grade is shown separately in the Schools card above.
Census & demographics
- Population (ZIP)
- 8,543
Population outlook (Beaver County) Hauer SSP2
- Today (2025)
- 164,976 people
- By 2030
- 161,449 · -2.1%
- By 2040
- 151,752 · -8.0%
- By 2050
- 141,155 · -14.4%
- By 2075
- 118,142 · -28.4%
- By 2100
- 91,740 · -44.4%
Race, ethnicity, and origin ACS 2023
- Neighborhood character
- Predominantly White (85%)
- Race & ethnicity
- White 85% Black 8% Two or more races 6%
- Common ancestry
- Romanian 4% Slovak 2% Serbian 2%
- Foreign-born
- 2%
- Languages at home
- 96% English-only · German/W. Germanic 3% French/Haitian/Cajun 1%
Political lean MEDSL · Beaver
- 2024 margin
- Strong R (+20.7) · D 39.2% · R 59.9%
- 2008→2024 swing
- -17.9pp toward R · 2008: -2.8pp · 2024: -20.7pp
- All cycles
- 2024: R+20.7 2020: R+17.7 2016: R+20.1 2012: R+6.6 2008: R+2.8
Not yet ingested
- Civics
- —
Market trends
- HPI YoY
- ▼ -92.06%
- Current HPI
- 166.4711
- Rent YoY
- —
- Metro
- —
- State GDP YoY
- ▲ 1.68%
- F500 in state
- 34
Industry mix (Fortune 500 HQ in PA)
| Industry | F500 HQs | Revenue |
|---|---|---|
| Healthcare | 2 | $309B |
|
||
| Insurance | 2 | $27B |
|
||
| Telecommunications / Media | 1 | $124B |
|
||
| Industrial Distribution | 1 | $22B |
|
||
| Financial Services | 1 | $20B |
|
||
| Chemicals / Materials | 1 | $18B |
|
||
Price history
1 event — show timeline
- 2026-06-15 Listed $42,000 West Penn MLS
Cash-flow waterfall
monthlySold comps — $/sqft
last 12 mo · ≤1 miLoading sold comps…