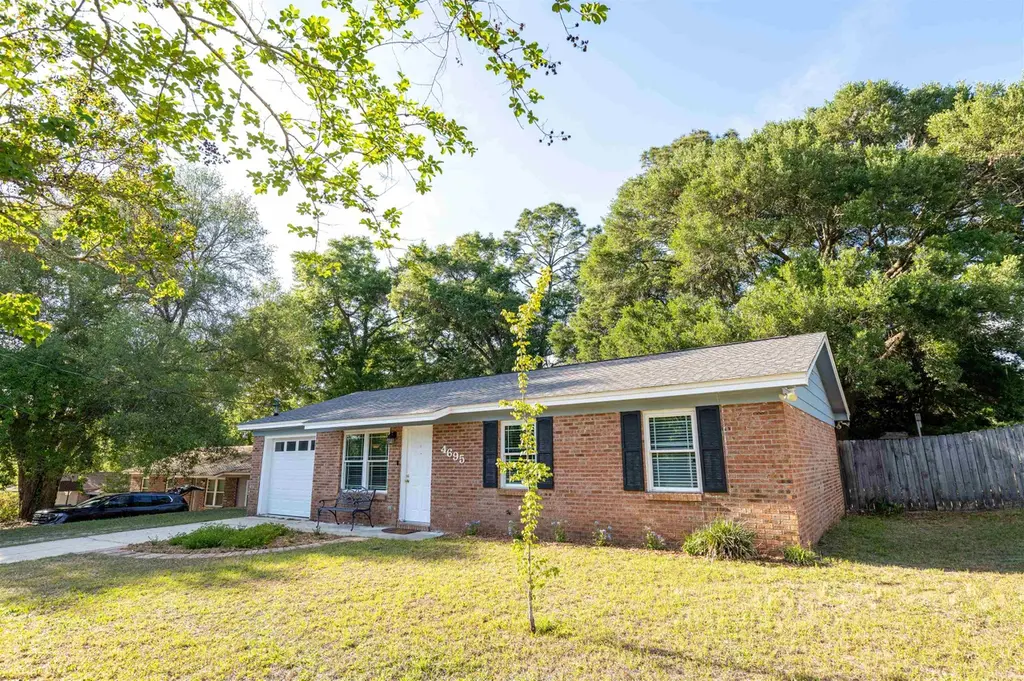
4695 Autumn Woods Way · Tallahassee, FL
Flood risk 1/10 · Minimal
- FEMA flood zone
- X (unshaded)
- Chance of flooding over 30 yrs
- 0.0%
- Est. flood insurance / yr
- $507 – $1,088
Fire risk 2/10 · Minimal
- Est. fire insurance / yr
- $947 – $1,759
Heat risk 8/10 · Major
- Hot days now (above 108°F)
- 7 days/yr
- Hot days in 30 yrs
- 21 days/yr
Wind risk 9/10 · Severe
- Chance of severe wind over 30 yrs
- 99.0%
Air-quality risk 5/10 · Moderate
- Unhealthy air days now
- 7 days/yr
- Unhealthy air days in 30 yrs
- 7 days/yr
Risk factors via First Street. Map © Google.
Why this score? — see what drove the D- grade
The composite is a weighted blend of 9 inputs, each scored 0–100. Each bar is that input's sub-score; the figure is the points it added to the 100-point composite (weight × sub-score).
- Cash flow +14.1/30.0
- DSCR +4.3/10.0
- Schools +4.3/10.0
- Livability +4.3/5.0
- Rent growth +3.3/5.0
- 1% rule +3.0/10.0
- Condition / age +2.5/5.0
- ARV discount +0.1/15.0
- Appreciation +0.0/10.0
$210,000
🖨 Deal sheet (PDF) 📄 Offer letter ✓ Due diligence
Listing remarks MLS
Affordable home in northwest Tallahassee. Near shopping, parks and Lake Jackson.
Key facts
- Fresh paint
- Recent roof
- Ample cabinet space
Tags
Property features AI
Finance
- Financial info: For sale
Exterior
- Parking: Detached 1-car garage
- Utilities: Electric power
- Home design: Single-story; Brick, fiber cement, and wood siding exterior
- Construction: Brick construction; Fiber cement siding; Wood siding
- Exterior features: Privacy fence; Paved, public maintained road
Interior
- Kitchen: Dishwasher; Microwave; Oven; Range; Refrigerator
- Bedrooms: Bedroom 2 (10x11); Bedroom 3 (10x11)
- Flooring: Carpet; Plank; Tile; Vinyl
- Bathrooms: 1 full bathroom; 1 half bathroom
- Heating & cooling: Electric heating; Electric cooling
- Interior features: Utility room; Ceiling fan(s)
- Laundry & utility: Utility room
Neighborhood map
What this means for you Summary
Snapshot
- This is a 3-bed/2.0-bath single-family listed at $210k.
Deal economics
- At list price, monthly cash flow is $29 ($352/yr) — positive.
- The deal already cash-flows at list — no discount required.
- To meet the 1% rule (rent ≥ 1% of price), the offer needs to be $167k (20.5% below list).
- Recommended offer: $167k (20.5% below list) — sets the bar for 1% rule.
- Cap rate 6.5% vs local median 4.2% in Tallahassee — top-decile yield for the area; either an underpriced asset or a hidden risk that comps aren't pricing in. Stress-test before assuming the spread holds.
Location & tenants
- Location reads 86/100 on livability (#19 in FL, #429 nationally) — a professional / high-income tenant draw. Strengths: amenities A+, commute A+, health & safety A+; Watch: employment D.
- Leon (urban): math 48% / reading 53% proficiency, ranked #33 of 73 in FL (top 45%) — acceptable for families but not a draw, mixed tenant base, ~2y average lease.
- Zoned schools: Springwood Elementary School (math 32% / reading 31%, grade F, #1,841 of 2,144 statewide, top 86%, 423 students, 69% FRL); Griffin Middle School (math 16% / reading 25%, grade F, #556 of 571 statewide, top 98%, 532 students, 77% FRL); Amos P. Godby High School (math 24% / reading 32%, grade F, #464 of 667 statewide, top 70%, 1,444 students, 63% FRL) — zoned schools average 70% FRL vs 45% district-wide (25 pts higher); higher-poverty schools than district average — tighter screening recommended.
- Zoned-school proficiency averages 27% at this address vs 50% district-wide (-24 pts) — the specific schools serving this property underperform the Leon average; the district grade overstates school quality for this exact location.
- Market conditions: Rents rising (+3.1%/yr); 238 active listings in the ZIP; 1 comparable units currently listed for rent nearby; 1,765 units permitted in Leon County in 2024 (975 in 5+ unit buildings).
- This rent runs 32% of the median local income ($62k/yr) — at the standard rent-burdened threshold; future hikes will face affordability resistance.
Forward outlook
- Local home prices are declining (-3.0%/yr); year-one equity from $1k of loan paydown is wiped out by about $6k of value loss. Plan a longer hold.
- Leon County population projected at +23% by 2050 — long-run rental-demand tailwind backs the buy-and-hold thesis.
Negotiation context
- It's been on market 60 days — a 3% lower offer ($204k) is reasonable based on typical stale-listing flexibility.
- 2 sale attempts since 8y ago with the ask held roughly flat each time — persistent listings suggest the price (not the market) is what's stuck; bring a comps-based counter.
- Current owner paid $80k; list at $210k implies a 162% gain — meaningful room to come down on a strong offer.
Risks & watch-outs
- Climate carrying-cost: severe wind risk, 99% chance of damaging wind over 30y; extreme-heat days projected 7→21/yr by 2055 (HVAC capex compounding) — expect insurance premiums to compound above CPI over the hold.
Questions for the listing agent
- It's been on market 60 days. Have you received any prior offers? Is the seller open to a 20% concession, seller financing, or rate buy-down credit?
- Built in 1979 — when were the roof, HVAC, electrical panel, plumbing, and water heater last replaced?
- Is there a deadline driving the sale (1031 exchange, divorce, estate, relocation)? That informs how much negotiation room exists.
- Schools are B-rated — typically a magnet for longer-tenancy family renters. What's the average tenant stay here, and is there a school-zone premium baked into asking?
- The area grade is low — what's the realistic commute time and amenity access for the typical tenant pool here? Any planned neighborhood developments (good or bad) we should know about?
- What's the average days-on-market for RENTAL listings here right now (not sales)? A rising rental-DOM trend means longer vacancies and softer asking-rent achievability than the comps imply.
- What's the recent tenant-quality profile in this submarket — average credit score on applications, eviction rate, late-payment / NSF rate, and stable-employment percentage? A property-management company in the area should have these aggregated.
- How much new for-sale + rental construction is in the pipeline within 1–3 miles? Heavy new supply typically softens prices + rents 12–24 months out; constrained supply supports both.
Investment metrics
- 1% rule
- 0.80% ✗
- Cap rate
- 6.46%
- Cash-on-cash
- 0.60%
- DSCR
- 1.03
- GRM
- 10.5
CMA / ARV
- ARV (on-the-fly)
- $180,180
- Comps found
- 10
Show comp detail 10 sales within ~0.75 mi
| Address | Dist | Beds/Ba | Sqft | Sold | Price | $/sf | Match |
|---|---|---|---|---|---|---|---|
| 5660 Maple Forest Dr | 0.24mi | 3/1.5 | 910 (0%) | 4mo | $205,000 | $225 | 84 |
| 5633 Maple Forest Dr | 0.17mi | 3/2.0 | 900 (-1%) | 14mo | $225,000 | $250 | 78 |
| 5620 Cypress Cir | 0.20mi | 3/1.0 | 850 (-7%) | 2mo | $185,000 | $218 | 74 |
| 4501 Hickory Forest Cir | 0.46mi | 3/1.5 | 910 (0%) | 2mo | $175,000 | $192 | 74 |
| 4520 Hickory Forest Cir | 0.45mi | 3/1.5 | 910 (0%) | 8mo | $180,000 | $198 | 71 |
| 6426 Bombadil Dr | 0.58mi | 2/1.0 (-1) | 912 (+0%) | 3mo | $176,000 | $193 | 62 |
| 6454 Bombadil Dr | 0.60mi | 2/1.0 (-1) | 916 (+1%) | 13mo | $170,000 | $186 | 51 |
| 5798 Japonica Ct | 0.49mi | 3/2.0 | 1,032 (+13%) | 5mo | $195,000 | $189 | 51 |
| 5715 Bombadil Ct | 0.54mi | 2/1.0 (-1) | 949 (+4%) | 10mo | $170,000 | $179 | 51 |
| 4812 Sampler Dr | 0.64mi | 3/2.0 | 1,014 (+11%) | 6mo | $229,000 | $226 | 46 |
Match score weights: distance 35% · size 25% · config 20% · recency 20%. Top-matched comps best support the ARV.
Projected returns pro-forma
-3.0% appreciation · 3.12% rent growth · sell at horizon
- IRR
- -15.3%
- Equity multiple
- 0.46×
- Total profit
- $-32,034
- Equity at exit
- $31,312
- IRR
- -6.6%
- Equity multiple
- 0.58×
- Total profit
- $-24,961
- Equity at exit
- $18,157
Cash invested: $58,800 (down + closing). Projections, not guarantees.
Landlord ↔ Tenant lean methodology
- Overall (STATE)
- 87 Strongly Landlord-Friendly
- State Florida
- 87 Strongly Landlord-Friendly · R+3
- County
- — inherits STATE
- City
- — inherits STATE
ZIP-level market 32303
- Rents YoY
- 3.1%
- Active inventory
- 238
- Price-to-rent
- 10.5×
Monthly cashflow live
- Estimated rent
- $1,670 medium interval (Pro) →
- Mortgage (P&I)
- −$1,101
- Tax from tax record
- −$101 /mo · $1,216/yr
- Insurance
- −$88
- HOA
- −$0
- Vacancy / Maint / Mgmt
- −$351
- Net cashflow
- $29
Break-even live
Sensitivity live
| Price | -10% $148 | -5% $89 | +0% $29 | +5% $-30 | +10% $-90 |
|---|---|---|---|---|---|
| Rent | -10% $-103 | -5% $-37 | +0% $29 | +5% $95 | +10% $161 |
| Rate | -1.0pp $135 | -0.5pp $83 | base $29 | +0.5pp $-25 | +1.0pp $-80 |
UW: 25.0% down · 7.5% · 30yr · 1.5% tax · 5.0% vac · 8.0% maint · 8.0% mgmt
Financing live
Cash to close
- Down payment
- $52,500
- Closing costs
- $6,300
- Reserves months
- —
- Total cash needed
- —
Loan-product check · same deal, 3 products live
Conventional
25% down · 7.5% · 30yr
- Down + closing
- —
- Monthly P&I
- —
- Monthly cashflow
- —
- DSCR
- —
- Eligible?
- —
Personal DTI + credit; lowest rate.
DSCR
20% down · 8.5% · 30yr
- Down + closing
- —
- Monthly P&I
- —
- Monthly cashflow
- —
- DSCR
- —
- Eligible?
- —
No personal income docs; deal must DSCR.
Hard money
10% down · 12.0% · 12mo
- Down + closing
- —
- Monthly P&I
- —
- Monthly cashflow
- —
- DSCR
- —
- Eligible?
- —
Short-term bridge; refi at stabilization.
Rent comps 1 comps
| Address | Beds | Baths | Sqft | Rent | $/sqft | DOM | Units | Dist |
|---|---|---|---|---|---|---|---|---|
| 4895 Leah Ln Tallahassee, FL | 2.0 | 2.0 | 1008 | $1,800 | $1.79 | 15d | 1 | 0.93mi |
Listing history 21 events
-
2026-06-22days on market $210,000 Active 60 DOM
-
2026-06-18days on market $210,000 Active 57 DOM
-
2026-06-17days on market $210,000 Active 56 DOM
-
2026-06-16days on market $210,000 Active 55 DOM
-
2026-06-15days on market $210,000 Active 54 DOM
-
2026-06-14days on market $210,000 Active 52 DOM
-
2026-06-10days on market $210,000 Active 49 DOM
-
2026-06-09days on market $210,000 Active 48 DOM
-
2026-06-08days on market $210,000 Active 47 DOM
-
2026-06-07pricedays on market $210,000 Active 46 DOM
-
2026-06-05days on market $215,000 Active 43 DOM
-
2026-06-03days on market $215,000 Active 42 DOM
-
2026-06-02days on market $215,000 Active 41 DOM
-
2026-06-01days on market $215,000 Active 40 DOM
-
2026-05-31days on market $215,000 Active 39 DOM
-
2026-05-30days on market $215,000 Active 38 DOM
-
2026-04-22$215,000 Active
-
2018-09-20soldstatus $80,000
-
2018-09-13soldstatus $80,000 80-char remark
Show marketing remark (80 chars)
Affordable home in northwest Tallahassee. Near shopping, parks and Lake Jackson.
-
2018-06-19$85,000 80-char remark
Show marketing remark (80 chars)
Affordable home in northwest Tallahassee. Near shopping, parks and Lake Jackson.
-
1996-07-09soldstatus $60,500
ⓘ Source: listings_history table (triggers on properties + properties_extension) + one-shot
backfill from property_details.listing_events for pre-trigger history.
Tax reassessment forecast FL · Resets to sale price
- Current annual tax
- $1,216 · $101/mo
- Projected year-2 tax
- $1,743 · $145/mo
- Expected delta
- +$527/yr (+$44/mo · 43.4%)
ⓘ Screening estimate from a state-policy table — verify with the county assessor before closing.
Climate risk First Street
- Flood 1/10 Low FEMA zone X (unshaded) · 0% chance over 30 yrs
- Wildfire 2/10 Low
- Heat 8/10 Severe 7 d/yr ≥108°F today · 21 d/yr by 30 yrs out
- Wind 9/10 Extreme 99% chance of damaging wind over 30 yrs
- Air quality 5/10 Major 7 unhealthy d/yr today · 7 by 30 yrs out
Nearby sold comps map
Loading sold comps map…
Walkable amenities ~0.75 mi
Loading nearby amenities…
Taxation est. · year 1
- Rental income
- $20,041
- − Mortgage interest
- −$11,763
- − Property taxes
- −$1,216
- − Insurance
- −$1,050
- − Repairs & maintenance
- −$1,603
- − Management
- −$1,603
- − Depreciation
- −$6,109
- Taxable loss
- −$3,303
- Est. tax savings @ 24.0%
- +$793
- After-tax cash flow
- $1,145/yr
For passive investors: Depreciation is non-cash, so a rental often shows a tax loss while cash-flowing — sheltering income. Rental losses are passive: they offset passive income freely, and up to $25,000/yr can offset ordinary (W-2) income if you actively participate and your MAGI is under $100k (phasing out to $0 by $150k); unused losses carry forward. On sale, claimed depreciation is recaptured at up to 25%, and gains may owe capital-gains tax (a 1031 exchange can defer both). Figures are a year-1 estimate at your 24.0% rate — not tax advice; consult a CPA.
Schools (NCES district)
- District
- Leon
- NCES district ID
- 1201110
- Math proficiency
- 48% ▼ -13.00%
- Reading proficiency
- 53% ▼ -5.00%
- Median HH income
- $46,339
- Composite
- 42.84/100
- National rank
- #3131
- State rank
- #33 of 73 in FL
Livability — Tallahassee
- Score
- 86/100
- State rank
- #19
- US rank
- #429
Category grades
Schools grade is shown separately in the Schools card above.
Census & demographics
- County
- Leon County · 294,472 people
- City population
- 294,472
- Metro
- Tallahassee, FL
- Population (ZIP)
- 49,785
- Household income
- $62,275
- Rent vs Own
- Severe rent burden
- 2919.0
Population outlook (Leon County) Hauer SSP2
- Today (2025)
- 315,507 people
- By 2030
- 330,677 · +4.8%
- By 2040
- 358,465 · +13.6%
- By 2050
- 386,804 · +22.6%
- By 2075
- 465,480 · +47.5%
- By 2100
- 519,959 · +64.8%
Race, ethnicity, and origin ACS 2023
- Neighborhood character
- Diverse neighborhood (Simpson 0.63)
- Race & ethnicity
- White 50% Black 34% Hispanic / Latino 8% Two or more races 8% Asian 3%
- Hispanic origin (detail)
- Mexican 2% Puerto Rican 1% Cuban 2%
- Common ancestry
- Slovak 2% Italian 1% Lithuanian 1%
- Foreign-born
- 8% · Canada, Vietnam, China
- Languages at home
- 89% English-only · Spanish 5% Arabic 1% French/Haitian/Cajun 1%
Political lean MEDSL · Leon
- 2024 margin
- Strong D (+21.8) · D 60.3% · R 38.5% · Other 1.2%
- 2008→2024 swing
- -2.5pp toward R · 2008: 24.3pp · 2024: 21.8pp
- All cycles
- 2024: D+21.8 2020: D+28.3 2016: D+25.1 2012: D+23.6 2008: D+24.3
Not yet ingested
- Civics
- —
Market trends
- HPI YoY
- ▼ -255.24%
- Current HPI
- 241.3131
- Rent YoY
- ▲ 3.12%
- Metro
- Tallahassee, FL
- State GDP YoY
- ▲ 3.28%
- F500 in state
- 36
Industry mix (Fortune 500 HQ in FL)
| Industry | F500 HQs | Revenue |
|---|---|---|
| Industrial Technology | 2 | $29B |
|
||
| Insurance | 2 | $17B |
|
||
| Retail | 1 | $60B |
|
||
| Technology Distribution | 1 | $58B |
|
||
| Homebuilding | 1 | $35B |
|
||
| Technology Manufacturing | 1 | $35B |
|
||
Price history
+255.4% since first listed5 events — show timeline
- 2026-04-22 Listed $215,000 CATRS
- 2018-09-20 Sold (Public Records) $80,000 Public Records
- 2018-09-13 Sold (MLS) $80,000 CATRS
- 2018-06-19 Listed $85,000 CATRS
- 1996-07-09 Sold (Public Records) $60,500 Public Records
Property tax history
+0.9%/yrLatest (2025): $1,216 · +2.8% YoY. Source: county tax records.
Cash-flow waterfall
monthlySold comps — $/sqft
last 12 mo · ≤1 miLoading sold comps…