 🏗️ New Construction
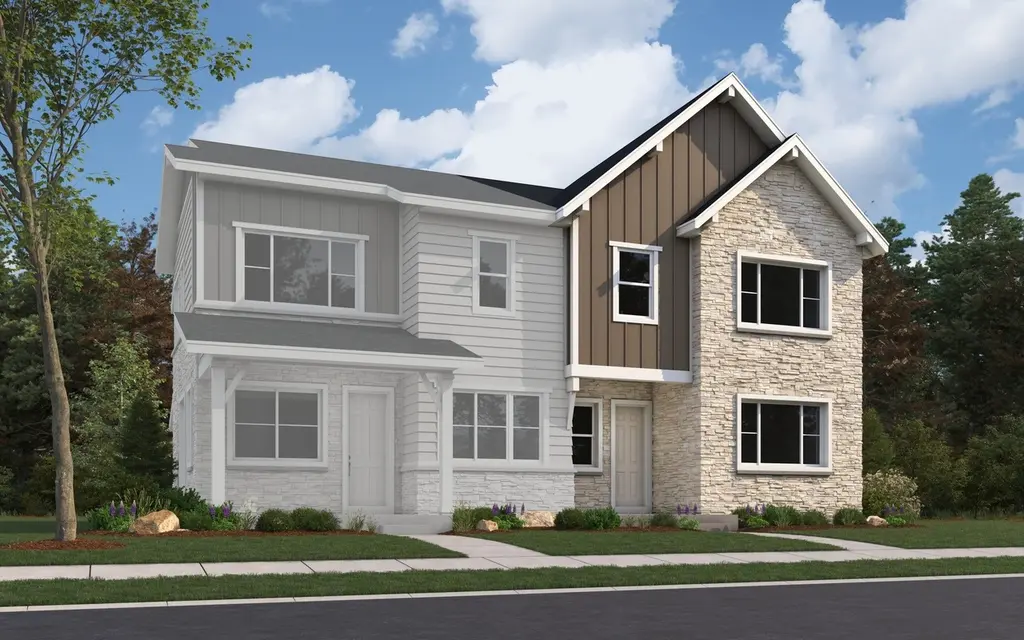
Tennyson Plan · Westminster, CO
Flood risk No data
- FEMA flood zone
- —
- Chance of flooding over 30 yrs
- —
- Est. flood insurance / yr
- —
Fire risk No data
- Est. fire insurance / yr
- —
Heat risk No data
- Hot days now (above threshold)
- —
- Hot days in 30 yrs
- —
Wind risk No data
- Chance of severe wind over 30 yrs
- —
Air-quality risk No data
- Unhealthy air days now
- —
- Unhealthy air days in 30 yrs
- —
Risk factors via First Street. Map © Google.
Why this score? — see what drove the C+ grade
The composite is a weighted blend of 9 inputs, each scored 0–100. Each bar is that input's sub-score; the figure is the points it added to the 100-point composite (weight × sub-score).
- Cash flow +25.5/30.0
- DSCR +8.5/10.0
- ARV discount +7.5/15.0
- 1% rule +6.7/10.0
- Condition / age +4.8/5.0
- Livability +3.5/5.0
- Rent growth +2.3/5.0
- Schools +1.5/10.0
- Appreciation +0.0/10.0
$572,990
🖨 Deal sheet 📄 Offer letter ✓ Due diligence
Listing remarks
The Tennyson Plan offers the perfect balance of comfort, style, and flexibility across two thoughtfully designed levels. With a spacious layout ideal for modern living, this home features a 2-car garage, inviting dining area, and an open-concept great room-creating a seamless flow for both everyday routines and entertaining guests. A convenient powder bath on the main floor adds to the home's practical design. Upstairs, all bedrooms are tucked away for privacy, including the generous primary suite with an en-suite bathroom and walk-in closet. Two additional bedrooms and a full bath provide plenty of space for family or guests, while the upstairs laundry room makes chores more convenient. A
Key facts
- Versatile loft
- 2 garage spots
- Listed 16 days
Tags
Property features AI
Finance
- Financial info: List price available
Exterior
- Parking: 2 total parking spaces; 2-car garage
- Utilities: Natural gas; Central air (electric)
- Home design: New construction plan; Model/plan identified as Tennyson
- Exterior features: Living area: 1,720 (listed)
Interior
- Bedrooms: 3 bedrooms
- Bathrooms: 2 full bathrooms and 1 half bathroom
- Heating & cooling: Natural gas forced-air heating; Central air conditioning
- Interior features: Active listing status; Plan name: Tennyson
Neighborhood map
What this means for you Summary
Snapshot
- This is a 3-bed/2.5-bath multifamily listed at $573k. Condition is rated excellent.
Deal economics
- At list price, monthly cash flow is $1k ($16k/yr) — positive.
- The deal already cash-flows at list — no discount required.
- Meets the 1% rule at list price ($7k rent vs $573k).
- Recommended offer: $564k (1.5% below list) — sets the bar for market timing.
- Cap rate 9.1% vs local median 2.8% in Westminster — top-decile yield for the area; either an underpriced asset or a hidden risk that comps aren't pricing in. Stress-test before assuming the spread holds.
Location & tenants
- Location reads 70/100 on livability (#81 in CO) — a middle-class / working-renter tenant base. Strengths: employment A+, housing A+; Watch: health & safety D, crime D-, amenities F.
- Westminster Public Schools (suburban): math 11% / reading 22% proficiency, ranked #81 of 86 in CO (top 94%) — low school quality limits family demand, transient renter base, plan for 1-2y turnover; 72% free/reduced lunch — lower-income household profile, screen leases tightly.
- Market conditions: Rents soft (-0.9%/yr); 258 active listings in the ZIP; 25 comparable units currently listed for rent nearby; rentals at typical pace (median 24d on market — plan ~3-4 weeks tenant-placement turnaround); solid renter incomes; 2,299 units permitted in Adams County in 2024 (343 in 5+ unit buildings).
- At $6,716/mo this rent would consume 75% of the median local household income ($107k/yr) (locally 1056% of renters already pay >50% of income on rent) — very limited rent-growth headroom before tenants either downsize or default.
Forward outlook
- Local home prices are declining (-3.0%/yr); year-one equity from $4k of loan paydown is wiped out by about $17k of value loss. Plan a longer hold.
- Adams County population projected at +44% by 2050 — long-run rental-demand tailwind backs the buy-and-hold thesis.
Negotiation context
- It's been on market 16 days — a 2% lower offer ($564k) is reasonable based on typical stale-listing flexibility.
Questions for the listing agent
- Is there a deadline driving the sale (1031 exchange, divorce, estate, relocation)? That informs how much negotiation room exists.
- Crime grade is D in this area — have there been break-ins, vandalism, or insurance claims at this property in the last 3 years? What carrier currently insures it and at what premium?
- What's the average days-on-market for RENTAL listings here right now (not sales)? A rising rental-DOM trend means longer vacancies and softer asking-rent achievability than the comps imply.
- What's the recent tenant-quality profile in this submarket — average credit score on applications, eviction rate, late-payment / NSF rate, and stable-employment percentage? A property-management company in the area should have these aggregated.
- How much new apartment / multifamily construction is in the pipeline within 1–3 miles? Heavy new supply (>2% of stock underway) typically softens rents 12–24 months out; light construction supports rent growth.
Investment metrics
- 1% rule
- 1.17% ✓
- Cap rate
- 9.11%
- Cash-on-cash
- 10.07%
- DSCR
- 1.45
- GRM
- 7.1
CMA / ARV
No comps found within radius.
Projected returns pro-forma
-3.0% appreciation · 0.0% rent growth · sell at horizon
- IRR
- -4.6%
- Equity multiple
- 0.83×
- Total profit
- $-26,713
- Equity at exit
- $85,435
- IRR
- 1.2%
- Equity multiple
- 1.07×
- Total profit
- $11,462
- Equity at exit
- $49,542
Cash invested: $160,437 (down + closing). Projections, not guarantees.
Landlord ↔ Tenant lean methodology
- Overall (STATE)
- 38 Tenant-Leaning
- State Colorado
- 38 Tenant-Leaning · D+4
- County
- — inherits STATE
- City
- — inherits STATE
ZIP-level market 80031
- Rents YoY
- -0.9%
- Active inventory
- 258
- Price-to-rent
- 28.4×
Monthly cashflow live
- Estimated rent
- $6,716 medium interval (Pro) →
- Mortgage (P&I)
- −$3,005
- Tax est. 1.5%
- −$716 /mo · $8,595/yr
- Insurance
- −$239
- HOA
- −$0
- Vacancy / Maint / Mgmt
- −$1,410
- Net cashflow
- $1,346
Break-even live
4-unit breakdown (identical units grouped — click to expand)
| Units | Beds | Baths | Est. rent |
|---|---|---|---|
| 4× units | 2 | 1 | $6,716 |
| #1 | 2 | 1 | $1,679 |
| #2 | 2 | 1 | $1,679 |
| #3 | 2 | 1 | $1,679 |
| #4 | 2 | 1 | $1,679 |
| Total (4 units) | $6,716 | ||
UW: 25.0% down · 7.5% · 30yr · 1.5% tax · 5.0% vac · 8.0% maint · 8.0% mgmt
Financing live
Cash to close
- Down payment
- $143,248
- Closing costs
- $17,190
- Reserves months
- —
- Total cash needed
- —
Loan-product check · same deal, 3 products live
Conventional
25% down · 7.5% · 30yr
- Down + closing
- —
- Monthly P&I
- —
- Monthly cashflow
- —
- DSCR
- —
- Eligible?
- —
Personal DTI + credit; lowest rate.
DSCR
20% down · 8.5% · 30yr
- Down + closing
- —
- Monthly P&I
- —
- Monthly cashflow
- —
- DSCR
- —
- Eligible?
- —
No personal income docs; deal must DSCR.
Hard money
10% down · 12.0% · 12mo
- Down + closing
- —
- Monthly P&I
- —
- Monthly cashflow
- —
- DSCR
- —
- Eligible?
- —
Short-term bridge; refi at stabilization.
Rent comps 25 comps
| Address | Beds | Baths | Sqft | Rent | $/sqft | DOM | Units | Dist |
|---|---|---|---|---|---|---|---|---|
| 8865 Federal Blvd #202 Denver, CO | 2.0 | 1.0 | 1067 | $1,700 | $1.59 | 11d | 1 | 0.33mi |
| 8670 Clay St Unit 6301 Westminster, CO | 3.0 | 2.0 | 1110 | $2,325 | $2.09 | 23d | 1 | 0.49mi |
| 8670 Clay St Unit 5201 Westminster, CO | 3.0 | 2.0 | 1110 | $2,550 | $2.30 | 23d | 1 | 0.49mi |
| 8670 Clay St Unit 5309 Westminster, CO | 2.0 | 2.0 | 1111 | $2,206 | $1.99 | 23d | 1 | 0.49mi |
| 8670 Clay St Unit 4211 Westminster, CO | 3.0 | 2.0 | 1110 | $2,186 | $1.97 | 23d | 1 | 0.49mi |
| 8670 Clay St Unit 7219 Westminster, CO | 3.0 | 2.0 | 1110 | $2,373 | $2.14 | 23d | 1 | 0.49mi |
| 8670 Clay St Unit 7317 Westminster, CO | 2.0 | 2.0 | 1111 | $2,054 | $1.85 | 23d | 1 | 0.50mi |
| 3601 W 90th Ave Westminster, CO | 3.0 | 2.0 | 1770 | $2,850 | $1.61 | 23d | 1 | 0.51mi |
| 3601 W 90th Ave Unit 1 Westminster, CO | 3.0 | 2.5 | 1770 | $2,850 | $1.61 | 23d | 1 | 0.51mi |
| 3650 W 84th Ave Westminster, CO | 3.0 | 1.0–2.0 | 720 | $1,550 | $2.15 | 2d | 9 | 0.53mi |
| 9130 Osceola St Westminster, CO | 3.0 | 2.0 | 1204 | $2,350 | $1.95 | 11d | 1 | 0.68mi |
| 9132 Osceola St Westminster, CO | 3.0 | 2.0 | 1204 | $2,350 | $1.95 | 23d | 1 | 0.69mi |
| 2921 W 81st Ave Unit C Westminster, CO | 3.0 | 4.0 | 1710 | $2,500 | $1.46 | 11d | 1 | 0.73mi |
| 9301 Julian Way Westminster, CO | 4.0 | 2.5 | 2200 | $2,750 | $1.25 | 10d | 1 | 0.79mi |
| 9400 Elm Ct #645 Denver, CO | 3.0 | 2.0 | 1184 | $2,203 | $1.86 | 23d | 1 | 0.92mi |
| 3390 W 96th Ave Westminster, CO | 3.0 | 2.0 | 1665 | $2,895 | $1.74 | 4d | 1 | 1.14mi |
| 8001 Stuart St Westminster, CO | 3.0 | 1.0 | 1061 | $2,395 | $2.26 | 10d | 1 | 1.17mi |
| 1654 Aspen Meadows Cir Unit Labs Denver, CO | 3.0 | 2.5 | 1355 | $2,400 | $1.77 | 24d | 1 | 1.19mi |
| 3323 W 96th Cir Westminster, CO | 1.0–3.0 | 1.0–3.0 | 1190 | $3,339 | $2.81 | 1d | 21 | 1.23mi |
| 4901 W 93rd Ave Westminster, CO | 1.0–2.0 | 1.0–2.0 | 981 | $2,333 | $2.38 | 1d | 24 | 1.24mi |
| 7821 Raleigh St Westminster, CO | 2.0 | 1.0 | 1080 | $2,300 | $2.13 | 11d | 1 | 1.27mi |
| 7650 Julian St Westminster, CO | 4.0 | 2.0 | 1998 | $2,794 | $1.40 | 23d | 1 | 1.28mi |
| 8055 Wolff St Unit 4 Westminster, CO | 3.0 | 1.5 | 1106 | $2,300 | $2.08 | 23d | 1 | 1.33mi |
| 1801 W 92nd Ave #754 Denver, CO | 3.0 | 2.0 | 1123 | $1,995 | $1.78 | 4d | 1 | 1.34mi |
| 9635 Gull St #33 Denver, CO | 2.0 | 2.0 | 1536 | $1,949 | $1.27 | 24d | 1 | 1.37mi |
Listing history 12 events
-
2026-06-18days on market $572,990 Active 16 DOM
-
2026-06-17days on market $572,990 Active 15 DOM
-
2026-06-16days on market $572,990 Active 14 DOM
-
2026-06-15days on market $572,990 Active 13 DOM
-
2026-06-13days on market $572,990 Active 11 DOM
-
2026-06-13days on market $572,990 Active 10 DOM
-
2026-06-09days on market $572,990 Active 7 DOM
-
2026-06-08days on market $572,990 Active 6 DOM
-
2026-06-07days on market $572,990 Active 5 DOM
-
2026-06-04days on market $572,990 Active 2 DOM
-
2026-06-02remarks 699-char remark
-
2026-06-02$572,990 Active 1 DOM
ⓘ Source: listings_history table (triggers on properties + properties_extension) + one-shot
backfill from property_details.listing_events for pre-trigger history.
Nearby sold comps map
Loading sold comps map…
Walkable amenities ~0.75 mi
Loading nearby amenities…
Taxation est. · year 1
- Rental income
- $80,592
- − Mortgage interest
- −$32,096
- − Property taxes
- −$8,595
- − Insurance
- −$2,865
- − Repairs & maintenance
- −$6,447
- − Management
- −$6,447
- − Depreciation
- −$16,669
- Taxable income
- $7,472
- Est. tax owed @ 24.0%
- −$1,793
- After-tax cash flow
- $14,357/yr
For passive investors: Depreciation is non-cash, so a rental often shows a tax loss while cash-flowing — sheltering income. Rental losses are passive: they offset passive income freely, and up to $25,000/yr can offset ordinary (W-2) income if you actively participate and your MAGI is under $100k (phasing out to $0 by $150k); unused losses carry forward. On sale, claimed depreciation is recaptured at up to 25%, and gains may owe capital-gains tax (a 1031 exchange can defer both). Figures are a year-1 estimate at your 24.0% rate — not tax advice; consult a CPA.
Condition & rehab AI · 13 photos
This multi-family home is in excellent condition with no visible repairs needed. It offers a great balance of comfort, style, and flexibility, making it an ideal investment property.
Value-add opportunities
- Both Painting the exterior — Enhances curb appeal and value
- Both Landscaping the front yard — Improves curb appeal and enhances property value
- Both Installing a smart home system — Enhances convenience and adds modern appeal
Renovation cost estimate screening
Value-add ROI direction
- Both Painting the exterior — Enhances curb appeal and value ↑
- Both Landscaping the front yard — Improves curb appeal and enhances property value ↑
- Both Installing a smart home system — Enhances convenience and adds modern appeal ↑
ⓘ Cost ranges are severity-bucket heuristics (US national rule-of-thumb). Get contractor quotes + a written scope before underwriting a rehab budget.
Schools (NCES district)
- District
- Westminster Public Schools
- NCES district ID
- 0807230
- Math proficiency
- 11% ▼ -5.00%
- Reading proficiency
- 22% ▼ -5.00%
- Median HH income
- $49,069
- Composite
- 14.88/100
- National rank
- #9376
- State rank
- #81 of 86 in CO
Livability — Westminster
- Score
- 70/100
- State rank
- #81
- US rank
- #7330
Category grades
Schools grade is shown separately in the Schools card above.
Census & demographics
- Census place
- Westminster, CO
- County
- Adams County · 464,133 people
- City population
- 152,898
- Metro
- Denver-Aurora-Lakewood, CO
- Population (ZIP)
- 35,584
- Household income
- $107,422
- Rent vs Own
- Severe rent burden
- 1056.0
Population outlook (Adams County) Hauer SSP2
- Today (2025)
- 598,184 people
- By 2030
- 651,880 · +9.0%
- By 2040
- 759,778 · +27.0%
- By 2050
- 862,889 · +44.3%
- By 2075
- 1,085,994 · +81.5%
- By 2100
- 1,211,318 · +102.5%
Race, ethnicity, and origin ACS 2023
- Neighborhood character
- Majority White (64%)
- Race & ethnicity
- White 64% Hispanic / Latino 26% Two or more races 14% Asian 5% Native American 1%
- Hispanic origin (detail)
- Mexican 18%
- Common ancestry
- Portuguese 3% Romanian 3% Lithuanian 2%
- Foreign-born
- 10% · Canada, Vietnam, China
- Languages at home
- 82% English-only · Spanish 13% Other Indo-European 1% Vietnamese 1%
Political lean MEDSL · Adams
- 2024 margin
- Lean D (+9.0) · D 53.2% · R 44.1% · Other 2.7%
- 2008→2024 swing
- -9.3pp toward R · 2008: 18.4pp · 2024: 9.0pp
- All cycles
- 2024: D+9.0 2020: D+16.3 2016: D+7.2 2012: D+15.1 2008: D+18.4
Not yet ingested
- Civics
- —
Market trends
- HPI YoY
- ▼ -425.52%
- Current HPI
- 247.4481
- Rent YoY
- ▼ -0.88%
- Metro
- Denver-Aurora-Lakewood, CO
- State GDP YoY
- ▲ 1.95%
- F500 in state
- 14
Industry mix (Fortune 500 HQ in CO)
| Industry | F500 HQs | Revenue |
|---|---|---|
| Technology Distribution | 1 | $31B |
|
||
| Food / Agriculture | 1 | $18B |
|
||
| Packaging | 1 | $14B |
|
||
| Healthcare | 1 | $13B |
|
||
| Energy | 1 | $10B |
|
||
| Technology | 1 | $4B |
|
||
Cash-flow waterfall
monthlySold comps — $/sqft
last 12 mo · ≤1 miLoading sold comps…