1908 Ike St · Lake Charles, LA
Flood risk 3/10 · Minor
- FEMA flood zone
- X (unshaded)
- Chance of flooding over 30 yrs
- 0.1%
- Est. flood insurance / yr
- $507 – $1,088
Fire risk 2/10 · Minimal
- Est. fire insurance / yr
- $1,269 – $2,357
Heat risk 9/10 · Severe
- Hot days now (above 109°F)
- 7 days/yr
- Hot days in 30 yrs
- 22 days/yr
Wind risk 9/10 · Severe
- Chance of severe wind over 30 yrs
- 99.0%
Air-quality risk 2/10 · Minimal
- Unhealthy air days now
- 1 days/yr
- Unhealthy air days in 30 yrs
- 1 days/yr
Risk factors via First Street. Map © Google.
Why this score? — see what drove the C+ grade
The composite is a weighted blend of 9 inputs, each scored 0–100. Each bar is that input's sub-score; the figure is the points it added to the 100-point composite (weight × sub-score).
- Cash flow +22.3/30.0
- ARV discount +12.7/15.0
- DSCR +7.1/10.0
- 1% rule +4.8/10.0
- Rent growth +4.6/5.0
- Livability +3.4/5.0
- Schools +3.1/10.0
- Condition / age +2.5/5.0
- Appreciation +0.0/10.0
$140,000
🖨 Deal sheet (PDF) 📄 Offer letter ✓ Due diligence
Listing remarks MLS
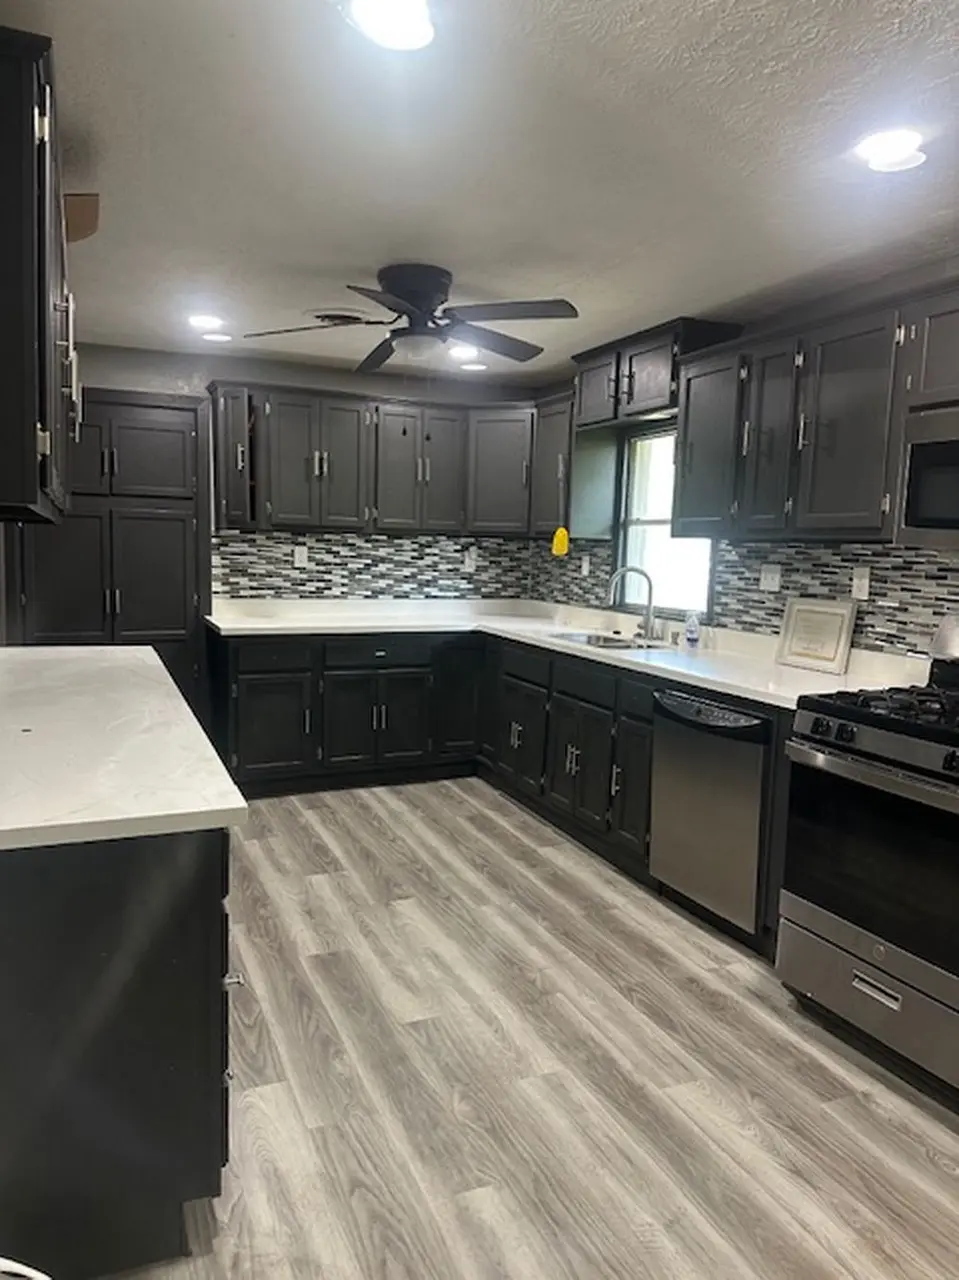
Quiet dead end subdivision right off I-210. Beautifully updated 3 bedroom 2 bath move in ready, and includes appliances. Central air and heat gas stove water heater and furnace. Large backyard with storage building,
Key facts
- Updated
- Large backyard
- Storage building
Tags
Neighborhood map
What this means for you Summary
Snapshot
- This is a 3-bed/2.0-bath single-family listed at $140k.
Deal economics
- At list price, monthly cash flow is $229 ($3k/yr) — positive.
- The deal already cash-flows at list — no discount required.
- To meet the 1% rule (rent ≥ 1% of price), the offer needs to be $137k (2.1% below list).
- Recommended offer: $123k (12.0% below list) — sets the bar for market timing.
- Cap rate 8.3% vs local median 4.3% in Lake Charles — top-decile yield for the area; either an underpriced asset or a hidden risk that comps aren't pricing in. Stress-test before assuming the spread holds.
Location & tenants
- Location reads 68/100 on livability (#95 in LA) — a middle-class / working-renter tenant base. Strengths: commute A+, cost of living A+, housing A+; Watch: crime F, amenities F, employment D-.
- Calcasieu Parish (other): math 30% / reading 44% proficiency, ranked #29 of 98 in LA (top 30%) — families likely to look elsewhere, expect single-tenant / working-renter base with shorter leases.
- Zoned schools: Oak Park Elementary School (math 12% / reading 17%, grade F, #516 of 646 statewide, top 82%, 246 students, 87% FRL); Oak Park Middle School (math 10% / reading 22%, grade F, #180 of 218 statewide, top 83%, 385 students, 83% FRL); Lagrange High School (math 9% / reading 22%, grade F, #217 of 265 statewide, top 82%, 907 students, 76% FRL) — zoned schools average 82% FRL vs 52% district-wide (30 pts higher); higher-poverty schools than district average — tighter screening recommended.
- Zoned-school proficiency averages 15% at this address vs 37% district-wide (-22 pts) — the specific schools serving this property underperform the Calcasieu Parish average; the district grade overstates school quality for this exact location.
- Market conditions: Rents rising fast (+8.6%/yr); 568 active listings in the ZIP; 16 comparable units currently listed for rent nearby; rentals at typical pace (median 23d on market — plan ~3-4 weeks tenant-placement turnaround); 1,298 units permitted in Calcasieu Parish in 2024 (526 in 5+ unit buildings).
Forward outlook
- Local home prices are declining (-3.0%/yr); year-one equity from $968 of loan paydown is wiped out by about $4k of value loss. Plan a longer hold.
- Calcasieu County population projected at +11% by 2050 — modest demand growth; plan on rents tracking national, not racing it.
- At projected returns (-3.0% appreciation + 8.0% rent growth), your $39k cash investment doubles in ~9 years — after that, you're playing with house money.
Negotiation context
- It's been on market 274 days — a 12% lower offer ($123k) is reasonable based on typical stale-listing flexibility.
Risks & watch-outs
- Climate carrying-cost: severe wind risk, 99% chance of damaging wind over 30y; extreme-heat days projected 7→22/yr by 2055 (HVAC capex compounding) — expect insurance premiums to compound above CPI over the hold.
Questions for the listing agent
- It's been on market 274 days. Have you received any prior offers? Is the seller open to a 12% concession, seller financing, or rate buy-down credit?
- Why hasn't it sold? Are there any deal-killer items the seller is aware of (foundation, flood, title, zoning, code violations)?
- Is there a deadline driving the sale (1031 exchange, divorce, estate, relocation)? That informs how much negotiation room exists.
- Schools are B-rated — typically a magnet for longer-tenancy family renters. What's the average tenant stay here, and is there a school-zone premium baked into asking?
- Crime grade is F in this area — have there been break-ins, vandalism, or insurance claims at this property in the last 3 years? What carrier currently insures it and at what premium?
- What's the average days-on-market for RENTAL listings here right now (not sales)? A rising rental-DOM trend means longer vacancies and softer asking-rent achievability than the comps imply.
- What's the recent tenant-quality profile in this submarket — average credit score on applications, eviction rate, late-payment / NSF rate, and stable-employment percentage? A property-management company in the area should have these aggregated.
- How much new for-sale + rental construction is in the pipeline within 1–3 miles? Heavy new supply typically softens prices + rents 12–24 months out; constrained supply supports both.
Investment metrics
- 1% rule
- 0.98% ✗
- Cap rate
- 8.26%
- Cash-on-cash
- 7.02%
- DSCR
- 1.31
- GRM
- 8.5
CMA / ARV
- ARV (median comp)
- $158,118
- List price
- $140,000
- Delta
- -11.46%
- Verdict
- UNDERPRICED
- Comps
- 20 within 1.0 mi
Show comp detail 12 sales within ~0.75 mi
| Address | Dist | Beds/Ba | Sqft | Sold | Price | $/sf | Match |
|---|---|---|---|---|---|---|---|
| 3706 Texas St | 0.42mi | 3/2.0 | 1,364 (-1%) | 3mo | $129,900 | $95 | 77 |
| 3401 Kingham Rd | 0.05mi | 3/2.0 | 1,250 (-9%) | 8mo | $130,000 | $104 | 76 |
| 1309 Rosetta St | 0.52mi | 3/1.0 | 1,383 (+1%) | 6mo | $55,300 | $40 | 66 |
| 2334 S Roosevelt St S | 0.56mi | 3/1.5 | 1,325 (-4%) | 2mo | $50,000 | $38 | 64 |
| 1620 California St | 0.30mi | 3/1.0 | 1,310 (-5%) | 14mo | $117,000 | $89 | 63 |
| 2209 Michele Ct | 0.58mi | 3/2.0 | 1,447 (+5%) | 2mo | $195,000 | $135 | 62 |
| 2210 S Lake Michele Cir | 0.46mi | 3/2.0 | 1,508 (+10%) | 10mo | $195,000 | $129 | 54 |
| 4001 Briarfield Ln | 0.74mi | 3/2.0 | 1,269 (-8%) | 12mo | $168,000 | $132 | 43 |
| 1518 21st St | 0.55mi | 3/1.0 | 1,201 (-13%) | 9mo | $135,000 | $112 | 42 |
| 3537 Taylor St | 0.58mi | 2/1.0 (-1) | 1,245 (-10%) | 9mo | $97,900 | $79 | 40 |
| 3836 Brentwood St | 0.68mi | 4/2.0 (+1) | 1,500 (+9%) | 13mo | $205,000 | $137 | 37 |
| 1818 18th St | 0.72mi | 3/1.5 | 1,236 (-10%) | 18mo | $120,000 | $97 | 33 |
Match score weights: distance 35% · size 25% · config 20% · recency 20%. Top-matched comps best support the ARV.
Projected returns pro-forma
-3.0% appreciation · 8.0% rent growth · sell at horizon
- IRR
- -0.6%
- Equity multiple
- 0.98×
- Total profit
- $-877
- Equity at exit
- $20,874
- IRR
- 13.4%
- Equity multiple
- 2.30×
- Total profit
- $50,821
- Equity at exit
- $12,105
Cash invested: $39,200 (down + closing). Projections, not guarantees.
Landlord ↔ Tenant lean methodology
- Overall (STATE)
- 90 Strongly Landlord-Friendly
- State Louisiana
- 90 Strongly Landlord-Friendly · R+12
- County
- — inherits STATE
- City
- — inherits STATE
ZIP-level market 70607
- Rents YoY
- 8.6%
- Active inventory
- 568
- Price-to-rent
- 8.5×
Monthly cashflow live
- Estimated rent
- $1,371 high interval (Pro) →
- Mortgage (P&I)
- −$734
- Tax from tax record
- −$61 /mo · $729/yr
- Insurance
- −$58
- HOA
- −$0
- Vacancy / Maint / Mgmt
- −$288
- Net cashflow
- $229
Break-even live
Sensitivity live
| Price | -10% $309 | -5% $269 | +0% $229 | +5% $190 | +10% $150 |
|---|---|---|---|---|---|
| Rent | -10% $121 | -5% $175 | +0% $229 | +5% $284 | +10% $338 |
| Rate | -1.0pp $300 | -0.5pp $265 | base $229 | +0.5pp $193 | +1.0pp $156 |
UW: 25.0% down · 7.5% · 30yr · 1.5% tax · 5.0% vac · 8.0% maint · 8.0% mgmt
Financing live
Cash to close
- Down payment
- $35,000
- Closing costs
- $4,200
- Reserves months
- —
- Total cash needed
- —
Loan-product check · same deal, 3 products live
Conventional
25% down · 7.5% · 30yr
- Down + closing
- —
- Monthly P&I
- —
- Monthly cashflow
- —
- DSCR
- —
- Eligible?
- —
Personal DTI + credit; lowest rate.
DSCR
20% down · 8.5% · 30yr
- Down + closing
- —
- Monthly P&I
- —
- Monthly cashflow
- —
- DSCR
- —
- Eligible?
- —
No personal income docs; deal must DSCR.
Hard money
10% down · 12.0% · 12mo
- Down + closing
- —
- Monthly P&I
- —
- Monthly cashflow
- —
- DSCR
- —
- Eligible?
- —
Short-term bridge; refi at stabilization.
Rent comps 16 comps
| Address | Beds | Baths | Sqft | Rent | $/sqft | DOM | Units | Dist |
|---|---|---|---|---|---|---|---|---|
| 3619 Texas St Lake Charles, LA | 1.0–3.0 | 1.0–2.0 | 950 | $1,087 | $1.14 | 14d | 6 | 0.24mi |
| 3601 1st Ave Lake Charles, LA | 3.0 | 2.0 | 1512 | $1,295 | $0.86 | 14d | 1 | 0.45mi |
| 3108 Aster St Unit M Lake Charles, LA | 2.0 | 1.0 | 1100 | $1,300 | $1.18 | 14d | 1 | 0.52mi |
| 3206 Louisiana Ave Lake Charles, LA | 4.0 | 2.0 | 1600 | $1,600 | $1.00 | 14d | 1 | 0.77mi |
| 930 Azalea St Lake Charles, LA | 4.0 | 2.0 | 1658 | $1,500 | $0.90 | 22d | 1 | 0.77mi |
| 807 Camelia St Lake Charles, LA | 3.0 | 1.0 | 1322 | $1,500 | $1.13 | 45d | 1 | 0.89mi |
| 1509 Sage Dr Lake Charles, LA | 4.0 | 1.0 | 1157 | $1,195 | $1.03 | 22d | 1 | 1.01mi |
| 1300 16th St Lake Charles, LA | 2.0 | 1.5 | 1344 | $1,295 | $0.96 | 22d | 1 | 1.03mi |
| 2002 13th St Lake Charles, LA | 4.0 | 2.0 | 1560 | $1,700 | $1.09 | 22d | 1 | 1.04mi |
| 617 E School St Unit A Lake Charles, LA | 3.0 | 2.0 | 1800 | $2,500 | $1.39 | 45d | 1 | 1.17mi |
| 3715 Common St Unit B1 Lake Charles, LA | 2.0 | 2.0 | 900 | $1,395 | $1.55 | 14d | 1 | 1.22mi |
| 3506 Common St Unit 11 Lake Charles, LA | 2.0 | 1.0 | 910 | $950 | $1.04 | 14d | 1 | 1.23mi |
| 3206 Hodges St Lake Charles, LA | 2.0 | 1.0 | 1497 | $1,200 | $0.80 | 45d | 1 | 1.31mi |
| 417 E Claude St Lake Charles, LA | 4.0 | 1.0 | 1610 | $1,400 | $0.87 | 45d | 1 | 1.38mi |
| 1906 8th Ave Lake Charles, LA | 3.0 | 1.0 | 1001 | $1,350 | $1.35 | 45d | 1 | 1.40mi |
| 1915 Legion St Lake Charles, LA | 3.0 | 1.0 | 966 | $950 | $0.98 | 14d | 1 | 1.47mi |
Listing history 18 events
-
2026-06-21days on market $140,000 Active 274 DOM
-
2026-06-19days on market $140,000 Active 272 DOM
-
2026-06-18days on market $140,000 Active 271 DOM
-
2026-06-17days on market $140,000 Active 270 DOM
-
2026-06-16days on market $140,000 Active 269 DOM
-
2026-06-15days on market $140,000 Active 268 DOM
-
2026-06-14days on market $140,000 Active 266 DOM
-
2026-06-13days on market $140,000 Active 265 DOM
-
2026-06-10days on market $140,000 Active 263 DOM
-
2026-06-09days on market $140,000 Active 262 DOM
-
2026-06-08days on market $140,000 Active 261 DOM
-
2026-06-07days on market $140,000 Active 260 DOM
-
2026-06-05days on market $140,000 Active 257 DOM
-
2026-06-02days on market $140,000 Active 255 DOM
-
2026-06-01days on market $140,000 Active 254 DOM
-
2026-05-31days on market $140,000 Active 253 DOM
-
2026-05-30days on market $140,000 Active 252 DOM
-
2025-09-20$140,000 Active 215-char remark
Show marketing remark (215 chars)
Quiet dead end subdivision right off I-210. Beautifully updated 3 bedroom 2 bath move in ready, and includes appliances. Central air and heat gas stove water heater and furnace. Large backyard with storage building,
ⓘ Source: listings_history table (triggers on properties + properties_extension) + one-shot
backfill from property_details.listing_events for pre-trigger history.
Tax reassessment forecast LA · Resets to sale price
- Current annual tax
- $729 · $61/mo
- Projected year-2 tax
- $770 · $64/mo
- Expected delta
- +$41/yr (+$3/mo · 5.7%)
ⓘ Screening estimate from a state-policy table — verify with the county assessor before closing.
Climate risk First Street
- Flood 3/10 Moderate FEMA zone X (unshaded) · 10% chance over 30 yrs
- Wildfire 2/10 Low
- Heat 9/10 Extreme 7 d/yr ≥109°F today · 22 d/yr by 30 yrs out
- Wind 9/10 Extreme 99% chance of damaging wind over 30 yrs
- Air quality 2/10 Low 1 unhealthy d/yr today · 1 by 30 yrs out
Nearby sold comps map
Loading sold comps map…
Walkable amenities ~0.75 mi
Loading nearby amenities…
Taxation est. · year 1
- Rental income
- $16,446
- − Mortgage interest
- −$7,842
- − Property taxes
- −$729
- − Insurance
- −$700
- − Repairs & maintenance
- −$1,316
- − Management
- −$1,316
- − Depreciation
- −$4,073
- Taxable income
- $471
- Est. tax owed @ 24.0%
- −$113
- After-tax cash flow
- $2,641/yr
For passive investors: Depreciation is non-cash, so a rental often shows a tax loss while cash-flowing — sheltering income. Rental losses are passive: they offset passive income freely, and up to $25,000/yr can offset ordinary (W-2) income if you actively participate and your MAGI is under $100k (phasing out to $0 by $150k); unused losses carry forward. On sale, claimed depreciation is recaptured at up to 25%, and gains may owe capital-gains tax (a 1031 exchange can defer both). Figures are a year-1 estimate at your 24.0% rate — not tax advice; consult a CPA.
Schools (NCES district)
- District
- Calcasieu Parish
- NCES district ID
- 2200330
- Math proficiency
- 30% ▼ -39.00%
- Reading proficiency
- 44% ▼ -33.00%
- Median HH income
- $44,700
- Composite
- 31.45/100
- National rank
- #5979
- State rank
- #29 of 98 in LA
Livability — Lake Charles
- Score
- 68/100
- State rank
- #95
- US rank
- #9820
Category grades
Schools grade is shown separately in the Schools card above.
Census & demographics
- Census place
- Lake Charles, LA
- County
- Calcasieu Parish · 170,889 people
- City population
- 133,538
- Metro
- Lake Charles, LA
- Population (ZIP)
- 27,080
- Household income
- $60,351
- Rent vs Own
- Severe rent burden
- 1267.0
Population outlook (Calcasieu County) Hauer SSP2
- Today (2025)
- 212,179 people
- By 2030
- 218,199 · +2.8%
- By 2040
- 228,486 · +7.7%
- By 2050
- 236,208 · +11.3%
- By 2075
- 251,696 · +18.6%
- By 2100
- 247,848 · +16.8%
Race, ethnicity, and origin ACS 2023
- Neighborhood character
- Diverse neighborhood (Simpson 0.65)
- Race & ethnicity
- White 46% Black 36% Two or more races 11% Hispanic / Latino 6% Asian 2%
- Hispanic origin (detail)
- Mexican 1%
- Common ancestry
- Lithuanian 10% Serbian 1%
- Foreign-born
- 5% · Canada, Vietnam
- Languages at home
- 93% English-only · Spanish 4% French/Haitian/Cajun 2% Other Indo-European 1%
Political lean MEDSL · Calcasieu
- 2024 margin
- Solid R (+39.6) · D 29.5% · R 69.0% · Other 1.5%
- 2008→2024 swing
- -15.0pp toward R · 2008: -24.6pp · 2024: -39.6pp
- All cycles
- 2024: R+39.6 2020: R+35.2 2016: R+33.3 2012: R+28.7 2008: R+24.6
Not yet ingested
- Civics
- —
Market trends
- HPI YoY
- ▼ -91.59%
- Current HPI
- 93.679
- Rent YoY
- ▲ 8.55%
- Metro
- Lake Charles, LA
- State GDP YoY
- ▲ 3.29%
- F500 in state
- 10
Industry mix (Fortune 500 HQ in LA)
| Industry | F500 HQs | Revenue |
|---|---|---|
| Telecommunications | 2 | $23B |
|
||
| Utilities | 1 | $12B |
|
||
| Wholesale / Distribution | 1 | $5B |
|
||
| Advertising | 1 | $2B |
|
||
Price history
1 event — show timeline
- 2025-09-20 Listed $140,000 ForSaleByOwner.com
Property tax history
-0.5%/yrLatest (2025): $729 · +1.3% YoY. Source: county tax records.
Cash-flow waterfall
monthlySold comps — $/sqft
last 12 mo · ≤1 miLoading sold comps…