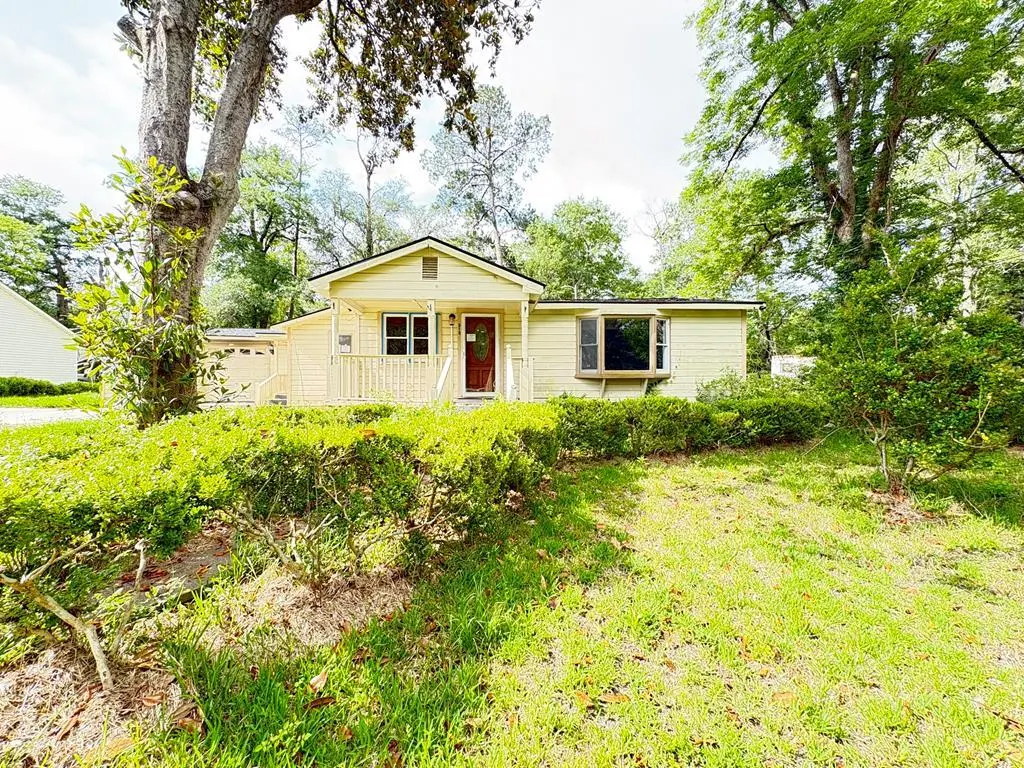
313 Allen St · Thomasville, GA
Flood risk 1/10 · Minimal
- FEMA flood zone
- X (unshaded)
- Chance of flooding over 30 yrs
- 0.0%
- Est. flood insurance / yr
- $507 – $1,088
Fire risk 4/10 · Minor
- Est. fire insurance / yr
- $963 – $1,789
Heat risk 8/10 · Major
- Hot days now (above 108°F)
- 7 days/yr
- Hot days in 30 yrs
- 19 days/yr
Wind risk 8/10 · Major
- Chance of severe wind over 30 yrs
- 99.0%
Air-quality risk 5/10 · Moderate
- Unhealthy air days now
- 8 days/yr
- Unhealthy air days in 30 yrs
- 8 days/yr
Risk factors via First Street. Map © Google.
Why this score? — see what drove the B- grade
The composite is a weighted blend of 9 inputs, each scored 0–100. Each bar is that input's sub-score; the figure is the points it added to the 100-point composite (weight × sub-score).
- Cash flow +30.0/30.0
- 1% rule +10.0/10.0
- DSCR +10.0/10.0
- ARV discount +7.5/15.0
- Livability +3.6/5.0
- Schools +2.7/10.0
- Rent growth +2.5/5.0
- Condition / age +2.5/5.0
- Appreciation +0.0/10.0
$95,000
🖨 Deal sheet (PDF) 📄 Offer letter ✓ Due diligence
Listing remarks MLS
Comfortable 4-bedroom, 2- bath home situated on a shaded lot with a two-car garage. Inside, you'll find hardwood floors throughout much of the home. Conveniently located and full of potential.
Key facts
- Shaded lot
- Two-car garage
- Hardwood floors
Tags
Property features AI
Exterior
- Parking: 2-car covered garage; Open parking; Concrete parking surfaces
- Utilities: Public water connected; Public sewer connected
- Home design: Single-family residence; One-level / single story
- Construction: Frame construction; Built on a single story
- Exterior features: Shingle roof; Lot approximately 0.29 acres
Interior
- Kitchen: Range
- Flooring: Wood; Hardwood; Tile
- Bathrooms: 2 full bathrooms
- Heating & cooling: Central heating; Central cooling
- Interior features: Range; Wood, hardwood, and tile flooring
- Laundry & utility: Dedicated laundry room
Neighborhood map
What this means for you Summary
Snapshot
- This is a 4-bed/2.0-bath single-family listed at $95k.
Deal economics
- At list price, monthly cash flow is $940 ($11k/yr) — positive.
- The deal already cash-flows at list — no discount required.
- Meets the 1% rule at list price ($2k rent vs $95k).
- Recommended offer: $94k (1.5% below list) — sets the bar for market timing.
- Cap rate 18.2% vs local median 3.7% in Thomasville — top-decile yield for the area; either an underpriced asset or a hidden risk that comps aren't pricing in. Stress-test before assuming the spread holds.
Location & tenants
- Location reads 71/100 on livability (#77 in GA) — a middle-class / working-renter tenant base. Strengths: amenities A+, cost of living A+, health & safety A+; Watch: crime F, commute F, employment F.
- Thomasville City (town): math 29% / reading 37% proficiency, ranked #87 of 174 in GA (top 50%) — families likely to look elsewhere, expect single-tenant / working-renter base with shorter leases; 60% free/reduced lunch — lower-income household profile, screen leases tightly.
- Zoned schools: Jerger Elementary School (math 54% / reading 56%, grade C, #178 of 1,228 statewide, top 15%, 785 students, 25% FRL); Macintyre Park Middle School (math 25% / reading 40%, grade F, #221 of 470 statewide, top 48%, 558 students, 92% FRL); Thomasville High School (math 17% / reading 32%, grade F, #184 of 424 statewide, top 48%, 797 students, 92% FRL).
- Market conditions: 206 active listings in the ZIP; 1 comparable units currently listed for rent nearby; 213 units permitted in Thomas County in 2024 (72 in 5+ unit buildings).
- At $1,908/mo this rent would consume 45% of the median local household income ($50k/yr) (locally 1059% of renters already pay >50% of income on rent) — very limited rent-growth headroom before tenants either downsize or default.
Forward outlook
- Local home prices are declining (-3.0%/yr); year-one equity from $657 of loan paydown is wiped out by about $3k of value loss. Plan a longer hold.
- Thomas County population projected to shrink 7% by 2050 — rents likely to lag national; underwrite the cash flow, not the appreciation.
- At projected returns (-3.0% appreciation + 3.0% rent growth), your $27k cash investment doubles in ~3 years — after that, you're playing with house money.
Negotiation context
- It's been on market 19 days — a 2% lower offer ($94k) is reasonable based on typical stale-listing flexibility.
- 4 sale attempts since 4y ago; this cycle's ask has dropped $22k (19%) from the opening price — seller is motivated, your offer sets the floor, not the list.
Risks & watch-outs
- Watch-outs: built in 1950 — expect roof / HVAC / electrical / plumbing capex.
- Climate carrying-cost: severe wind risk, 99% chance of damaging wind over 30y; extreme-heat days projected 7→19/yr by 2055 (HVAC capex compounding) — expect insurance premiums to compound above CPI over the hold.
Questions for the listing agent
- Built in 1950 — when were the roof, HVAC, electrical panel, plumbing, and water heater last replaced?
- Is there a deadline driving the sale (1031 exchange, divorce, estate, relocation)? That informs how much negotiation room exists.
- Schools are D-rated, which usually means shorter tenancies and higher turnover. Who's the typical renter profile here, and what's been the actual vacancy rate?
- Crime grade is F in this area — have there been break-ins, vandalism, or insurance claims at this property in the last 3 years? What carrier currently insures it and at what premium?
- What's the average days-on-market for RENTAL listings here right now (not sales)? A rising rental-DOM trend means longer vacancies and softer asking-rent achievability than the comps imply.
- What's the recent tenant-quality profile in this submarket — average credit score on applications, eviction rate, late-payment / NSF rate, and stable-employment percentage? A property-management company in the area should have these aggregated.
- How much new for-sale + rental construction is in the pipeline within 1–3 miles? Heavy new supply typically softens prices + rents 12–24 months out; constrained supply supports both.
Investment metrics
- 1% rule
- 2.01% ✓
- Cap rate
- 18.17%
- Cash-on-cash
- 42.42%
- DSCR
- 2.89
- GRM
- 4.1
CMA / ARV
- ARV (on-the-fly)
- $54,400
- Comps found
- 1
Show comp detail 1 sale within ~0.75 mi
| Address | Dist | Beds/Ba | Sqft | Sold | Price | $/sf | Match |
|---|---|---|---|---|---|---|---|
| 400 Wolfe St | 0.24mi | 3/2.0 (-1) | 1,404 (-12%) | 12mo | $48,000 | $34 | 54 |
Match score weights: distance 35% · size 25% · config 20% · recency 20%. Top-matched comps best support the ARV.
Projected returns pro-forma
-3.0% appreciation · 3.0% rent growth · sell at horizon
- IRR
- 39.1%
- Equity multiple
- 2.67×
- Total profit
- $44,465
- Equity at exit
- $14,165
- IRR
- 45.5%
- Equity multiple
- 5.35×
- Total profit
- $115,723
- Equity at exit
- $8,214
Cash invested: $26,600 (down + closing). Projections, not guarantees.
Landlord ↔ Tenant lean methodology
- Overall (STATE)
- 90 Strongly Landlord-Friendly
- State Georgia
- 90 Strongly Landlord-Friendly · R+3
- County
- — inherits STATE
- City
- — inherits STATE
ZIP-level market 31792
- Home prices YoY
- -29.0%
- Active inventory
- 206
- Price-to-rent
- 4.1×
Monthly cashflow live
- Estimated rent
- $1,908 medium interval (Pro) →
- Mortgage (P&I)
- −$498
- Tax from tax record
- −$29 /mo · $348/yr
- Insurance
- −$40
- HOA
- −$0
- Vacancy / Maint / Mgmt
- −$401
- Net cashflow
- $940
Break-even live
Sensitivity live
| Price | -10% $994 | -5% $967 | +0% $940 | +5% $913 | +10% $886 |
|---|---|---|---|---|---|
| Rent | -10% $790 | -5% $865 | +0% $940 | +5% $1,016 | +10% $1,091 |
| Rate | -1.0pp $988 | -0.5pp $964 | base $940 | +0.5pp $916 | +1.0pp $891 |
UW: 25.0% down · 7.5% · 30yr · 1.5% tax · 5.0% vac · 8.0% maint · 8.0% mgmt
Financing live
Cash to close
- Down payment
- $23,750
- Closing costs
- $2,850
- Reserves months
- —
- Total cash needed
- —
Loan-product check · same deal, 3 products live
Conventional
25% down · 7.5% · 30yr
- Down + closing
- —
- Monthly P&I
- —
- Monthly cashflow
- —
- DSCR
- —
- Eligible?
- —
Personal DTI + credit; lowest rate.
DSCR
20% down · 8.5% · 30yr
- Down + closing
- —
- Monthly P&I
- —
- Monthly cashflow
- —
- DSCR
- —
- Eligible?
- —
No personal income docs; deal must DSCR.
Hard money
10% down · 12.0% · 12mo
- Down + closing
- —
- Monthly P&I
- —
- Monthly cashflow
- —
- DSCR
- —
- Eligible?
- —
Short-term bridge; refi at stabilization.
Rent comps 1 comps
| Address | Beds | Baths | Sqft | Rent | $/sqft | DOM | Units | Dist |
|---|---|---|---|---|---|---|---|---|
| 306 Brighton St Thomasville, GA | 3.0 | 2.0 | 1440 | $1,800 | $1.25 | 45d | 1 | 1.33mi |
Listing history 15 events
-
2026-06-21days on market $95,000 Active 19 DOM
-
2026-06-19days on market $95,000 Active 17 DOM
-
2026-06-18days on market $95,000 Active 16 DOM
-
2026-06-17price $95,000 Active 15 DOM
-
2026-06-17days on market $117,000 Active 15 DOM
-
2026-06-16days on market $117,000 Active 14 DOM
-
2026-06-15days on market $117,000 Active 13 DOM
-
2026-06-14days on market $117,000 Active 11 DOM
-
2026-06-12days on market $117,000 Active 10 DOM
-
2026-06-09days on market $117,000 Active 7 DOM
-
2026-06-08days on market $117,000 Active 6 DOM
-
2026-06-07days on market $117,000 Active 5 DOM
-
2026-06-07days on market $117,000 Active 4 DOM
-
2026-06-02remarks 192-char remark
Show marketing remark (192 chars)
Comfortable 4-bedroom, 2- bath home situated on a shaded lot with a two-car garage. Inside, you'll find hardwood floors throughout much of the home. Conveniently located and full of potential.
-
2026-06-02$117,000 Active 1 DOM
Show marketing remark (192 chars)
Comfortable 4-bedroom, 2- bath home situated on a shaded lot with a two-car garage. Inside, you'll find hardwood floors throughout much of the home. Conveniently located and full of potential.
ⓘ Source: listings_history table (triggers on properties + properties_extension) + one-shot
backfill from property_details.listing_events for pre-trigger history.
Tax reassessment forecast GA · Resets to sale price
- Current annual tax
- $348 · $29/mo
- Projected year-2 tax
- $874 · $73/mo
- Expected delta
- +$526/yr (+$44/mo · 151.0%)
ⓘ Screening estimate from a state-policy table — verify with the county assessor before closing.
Climate risk First Street
- Flood 1/10 Low FEMA zone X (unshaded) · 0% chance over 30 yrs
- Wildfire 4/10 Moderate
- Heat 8/10 Severe 7 d/yr ≥108°F today · 19 d/yr by 30 yrs out
- Wind 8/10 Severe 99% chance of damaging wind over 30 yrs
- Air quality 5/10 Major 8 unhealthy d/yr today · 8 by 30 yrs out
Nearby sold comps map
Loading sold comps map…
Walkable amenities ~0.75 mi
Loading nearby amenities…
Taxation est. · year 1
- Rental income
- $22,892
- − Mortgage interest
- −$5,321
- − Property taxes
- −$348
- − Insurance
- −$475
- − Repairs & maintenance
- −$1,831
- − Management
- −$1,831
- − Depreciation
- −$2,764
- Taxable income
- $10,321
- Est. tax owed @ 24.0%
- −$2,477
- After-tax cash flow
- $8,806/yr
For passive investors: Depreciation is non-cash, so a rental often shows a tax loss while cash-flowing — sheltering income. Rental losses are passive: they offset passive income freely, and up to $25,000/yr can offset ordinary (W-2) income if you actively participate and your MAGI is under $100k (phasing out to $0 by $150k); unused losses carry forward. On sale, claimed depreciation is recaptured at up to 25%, and gains may owe capital-gains tax (a 1031 exchange can defer both). Figures are a year-1 estimate at your 24.0% rate — not tax advice; consult a CPA.
Schools (NCES district)
- District
- Thomasville City
- NCES district ID
- 1304950
- Math proficiency
- 29% ▼ -6.00%
- Reading proficiency
- 37% ▼ -8.00%
- Median HH income
- $31,040
- Composite
- 26.85/100
- National rank
- #7106
- State rank
- #87 of 174 in GA
Livability — Thomasville
- Score
- 71/100
- State rank
- #77
- US rank
- #6678
Category grades
Schools grade is shown separately in the Schools card above.
Census & demographics
- Census place
- Thomasville, GA
- County
- Thomas County · 22,962 people
- City population
- 22,962
- Metro
- Thomasville, GA
- Population (ZIP)
- 22,962
- Household income
- $50,460
- Rent vs Own
- Severe rent burden
- 1059.0
Population outlook (Thomas County) Hauer SSP2
- Today (2025)
- 45,303 people
- By 2030
- 45,052 · -0.6%
- By 2040
- 44,034 · -2.8%
- By 2050
- 42,310 · -6.6%
- By 2075
- 37,569 · -17.1%
- By 2100
- 30,676 · -32.3%
Race, ethnicity, and origin ACS 2023
- Race & ethnicity
- Black 49% White 47% Two or more races 2% Hispanic / Latino 2%
- Common ancestry
- Slovak 2% Italian 1% Lithuanian 1%
- Foreign-born
- 2% · Canada
- Languages at home
- 96% English-only · Spanish 2%
Political lean MEDSL · Thomas
- 2024 margin
- Strong R (+24.1) · D 37.8% · R 61.9%
- 2008→2024 swing
- -8.3pp toward R · 2008: -15.8pp · 2024: -24.1pp
- All cycles
- 2024: R+24.1 2020: R+19.5 2016: R+21.8 2012: R+18.5 2008: R+15.8
Not yet ingested
- Civics
- —
Market trends
- HPI YoY
- ▼ -93.17%
- Current HPI
- 228.0107
- Rent YoY
- —
- Metro
- Thomasville, GA
- State GDP YoY
- ▲ 2.66%
- F500 in state
- 28
Industry mix (Fortune 500 HQ in GA)
| Industry | F500 HQs | Revenue |
|---|---|---|
| Paper / Packaging | 2 | $29B |
|
||
| Retail | 1 | $160B |
|
||
| Transportation / Logistics | 1 | $91B |
|
||
| Airlines | 1 | $62B |
|
||
| Consumer Goods | 1 | $47B |
|
||
| Utilities | 1 | $25B |
|
||
Price history
-6.3% since first listed6 events — show timeline
- 2026-06-02 Listed $117,000 MBOR
- 2026-06-02 Listed $117,000 TABRMLS
- 2022-08-29 Sold (Public Records) $126,525 Public Records
- 2022-08-26 Sold (MLS) $126,525 TABRMLS
- 2022-06-10 Listed $124,900 CATRS
- 2022-06-10 Listed $124,900 TABRMLS
Property tax history
+0.2%/yrLatest (2025): $348 · +1.7% YoY. Source: county tax records.
Cash-flow waterfall
monthlySold comps — $/sqft
last 12 mo · ≤1 miLoading sold comps…