601 Kappock St Unit 2F · New York, NY
Flood risk 1/10 · Minimal
- FEMA flood zone
- X (unshaded)
- Chance of flooding over 30 yrs
- 0.0%
- Est. flood insurance / yr
- $507 – $1,088
Fire risk 1/10 · Minimal
- Est. fire insurance / yr
- $691 – $1,283
Heat risk 6/10 · Moderate
- Hot days now (above 99°F)
- 7 days/yr
- Hot days in 30 yrs
- 15 days/yr
Wind risk 6/10 · Moderate
- Chance of severe wind over 30 yrs
- 27.0%
Air-quality risk 3/10 · Minor
- Unhealthy air days now
- 3 days/yr
- Unhealthy air days in 30 yrs
- 4 days/yr
Risk factors via First Street. Map © Google.
Why this score? — see what drove the C- grade
The composite is a weighted blend of 9 inputs, each scored 0–100. Each bar is that input's sub-score; the figure is the points it added to the 100-point composite (weight × sub-score).
- Cash flow +19.5/30.0
- ARV discount +7.5/15.0
- DSCR +6.2/10.0
- 1% rule +5.2/10.0
- Rent growth +5.0/5.0
- Schools +5.0/10.0
- Livability +3.8/5.0
- Condition / age +2.5/5.0
- Appreciation +0.0/10.0
$250,000
🖨 Deal sheet (PDF) 📄 Offer letter ✓ Due diligence
Listing remarks MLS
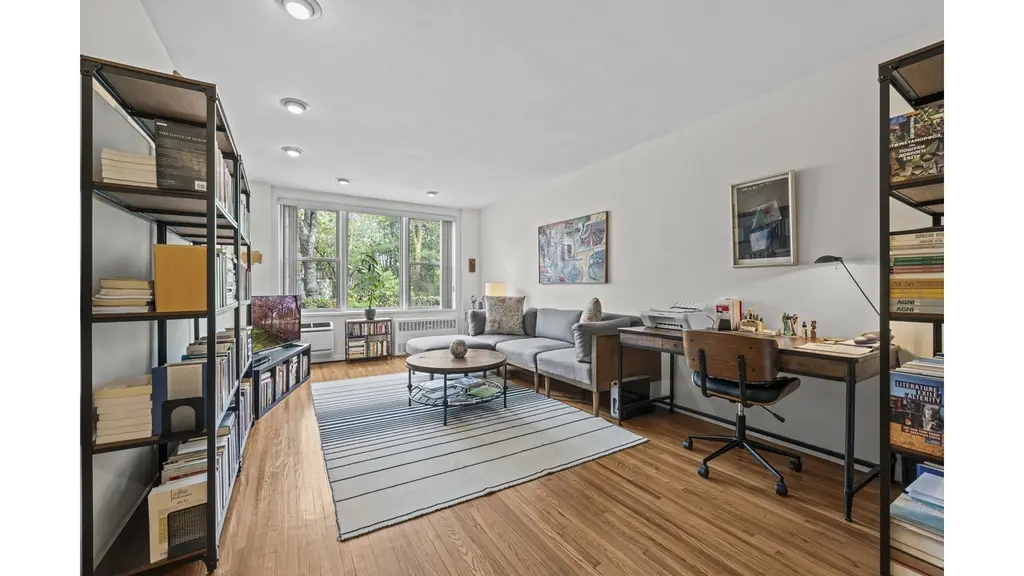
Spacious Renovated 1-Bedroom Apartment - South Riverdale Enjoy comfort and convenience in this beautifully renovated one-bedroom home located in the heart of South Riverdale. The apartment features a large living room , a windowed eat-in kitchen with modern finishes, and a windowed, renovated bathroom. A wall of closets in both the hallway and bedroom provides abundant storage, while gleaming hardwood floors add warmth throughout. Building amenities include a part-time doorman, seasonal outdoor swimming pool, bike and regular storage, common laundry room, and indoor/outdoor parking. The building is pet-friendly.
Key facts
- Renovated bathroom
- Wall of closets
- Large living room
Tags
Property features AI
Exterior
- Parking: Assigned parking; Garage (1 space)
- Utilities: Public sewer; Cable available; Electricity available
- Home design: Stock cooperative
- Construction: Brick construction
- Exterior features: Brick exterior; Not waterfront
Interior
- Kitchen: Dishwasher; Gas oven; Gas range; Refrigerator; Stainless steel appliances
- Bedrooms: Entry level: 2
- Bathrooms: 1 full bathroom
- Heating & cooling: Forced air heating (natural gas); Wall/window air conditioning units
- Interior features: Eat-in kitchen; Elevator; No basement; 3 total rooms
- Laundry & utility: Pets allowed: Dogs OK
Neighborhood map
What this means for you Summary
Snapshot
- This is a 1-bed/1.0-bath condo listed at $250k.
Deal economics
- At list price, monthly cash flow is $285 ($3k/yr) — positive.
- The deal already cash-flows at list — no discount required.
- Meets the 1% rule at list price ($3k rent vs $250k).
- Recommended offer: $242k (3.0% below list) — sets the bar for market timing.
- Cap rate 7.7% vs local median 2.6% in New York — top-decile yield for the area; either an underpriced asset or a hidden risk that comps aren't pricing in. Stress-test before assuming the spread holds.
Location & tenants
- Location reads 75/100 on livability (#268 in NY, #4,188 nationally) — a middle-class / working-renter tenant base. Strengths: amenities A+, commute A+, health & safety A; Watch: crime F, cost of living F.
- Market conditions: Rents rising fast (+11.6%/yr); 342 active listings in the ZIP; 1 comparable units currently listed for rent nearby; 6,929 units permitted in Bronx County in 2024 (6,829 in 5+ unit buildings).
- This rent runs 41% of the median local income ($75k/yr) — at the standard rent-burdened threshold; future hikes will face affordability resistance.
Forward outlook
- Local home prices are declining (-3.0%/yr); year-one equity from $2k of loan paydown is wiped out by about $8k of value loss. Plan a longer hold.
- Bronx County population projected at +21% by 2050 — long-run rental-demand tailwind backs the buy-and-hold thesis.
- At projected returns (-3.0% appreciation + 8.0% rent growth), your $70k cash investment doubles in ~9 years — after that, you're playing with house money.
Negotiation context
- It's been on market 59 days — a 3% lower offer ($242k) is reasonable based on typical stale-listing flexibility.
- 16 sale attempts since 18y ago with the ask held roughly flat each time — persistent listings suggest the price (not the market) is what's stuck; bring a comps-based counter.
- Current owner paid $160k; list at $250k implies a 56% gain — meaningful room to come down on a strong offer.
Risks & watch-outs
- Climate carrying-cost: major wind risk, 27% chance of damaging wind over 30y; extreme-heat days projected 7→15/yr by 2055 (HVAC capex compounding) — expect insurance premiums to compound above CPI over the hold.
Questions for the listing agent
- It's been on market 59 days. Have you received any prior offers? Is the seller open to a 3% concession, seller financing, or rate buy-down credit?
- Built in 1960 — when were the roof, HVAC, electrical panel, plumbing, and water heater last replaced?
- Any open or pending special assessments — roof, HVAC, plumbing, elevator, façade? What's the per-unit balance and payoff schedule, and is the seller paying it off at close or rolling it to the buyer?
- Is there a deadline driving the sale (1031 exchange, divorce, estate, relocation)? That informs how much negotiation room exists.
- Schools are B-rated — typically a magnet for longer-tenancy family renters. What's the average tenant stay here, and is there a school-zone premium baked into asking?
- Crime grade is F in this area — have there been break-ins, vandalism, or insurance claims at this property in the last 3 years? What carrier currently insures it and at what premium?
- What's the average days-on-market for RENTAL listings here right now (not sales)? A rising rental-DOM trend means longer vacancies and softer asking-rent achievability than the comps imply.
- What's the recent tenant-quality profile in this submarket — average credit score on applications, eviction rate, late-payment / NSF rate, and stable-employment percentage? A property-management company in the area should have these aggregated.
- How much new apartment / multifamily construction is in the pipeline within 1–3 miles? Heavy new supply (>2% of stock underway) typically softens rents 12–24 months out; light construction supports rent growth.
Investment metrics
- 1% rule
- 1.02% ✓
- Cap rate
- 7.66%
- Cash-on-cash
- 4.88%
- DSCR
- 1.22
- GRM
- 8.2
CMA / ARV
No comps found within radius.
Projected returns pro-forma
-3.0% appreciation · 8.0% rent growth · sell at horizon
- IRR
- -3.2%
- Equity multiple
- 0.87×
- Total profit
- $-8,872
- Equity at exit
- $37,276
- IRR
- 11.4%
- Equity multiple
- 2.10×
- Total profit
- $77,060
- Equity at exit
- $21,615
Cash invested: $70,000 (down + closing). Projections, not guarantees.
Landlord ↔ Tenant lean methodology
- Overall (CITY)
- 0 Strongly Tenant-Friendly
- State New York
- 15 Strongly Tenant-Friendly · D+10
- County
- — inherits STATE
- City New York
- 0 Strongly Tenant-Friendly · D+34
ZIP-level market 10463
- Rents YoY
- 11.6%
- Active inventory
- 342
- Price-to-rent
- 8.2×
Monthly cashflow live
- Estimated rent
- $2,547 medium interval (Pro) →
- Mortgage (P&I)
- −$1,311
- Tax est. 1.5%
- −$312 /mo · $3,750/yr
- Insurance
- −$104
- HOA
- −$0
- Vacancy / Maint / Mgmt
- −$535
- Net cashflow
- $285
Break-even live
Sensitivity live
| Price | -10% $458 | -5% $371 | +0% $285 | +5% $198 | +10% $112 |
|---|---|---|---|---|---|
| Rent | -10% $84 | -5% $184 | +0% $285 | +5% $385 | +10% $486 |
| Rate | -1.0pp $411 | -0.5pp $348 | base $285 | +0.5pp $220 | +1.0pp $154 |
UW: 25.0% down · 7.5% · 30yr · 1.5% tax · 5.0% vac · 8.0% maint · 8.0% mgmt
Financing live
Cash to close
- Down payment
- $62,500
- Closing costs
- $7,500
- Reserves months
- —
- Total cash needed
- —
Loan-product check · same deal, 3 products live
Conventional
25% down · 7.5% · 30yr
- Down + closing
- —
- Monthly P&I
- —
- Monthly cashflow
- —
- DSCR
- —
- Eligible?
- —
Personal DTI + credit; lowest rate.
DSCR
20% down · 8.5% · 30yr
- Down + closing
- —
- Monthly P&I
- —
- Monthly cashflow
- —
- DSCR
- —
- Eligible?
- —
No personal income docs; deal must DSCR.
Hard money
10% down · 12.0% · 12mo
- Down + closing
- —
- Monthly P&I
- —
- Monthly cashflow
- —
- DSCR
- —
- Eligible?
- —
Short-term bridge; refi at stabilization.
Rent comps 1 comps
| Address | Beds | Baths | Sqft | Rent | $/sqft | DOM | Units | Dist |
|---|---|---|---|---|---|---|---|---|
| 2600 Netherland Ave Bronx, NY | 1.0–3.0 | 1.0–2.5 | 1132 | $2,775 | $2.45 | 22d | 3 | 0.06mi |
HOA detail condo
- Monthly dues
- $0 · $0/yr
- Likely covers
- pooldoorman
- Assessments
- None detected in remarks — confirm with the listing agent.
Listing history 49 events
-
2026-06-18days on market $250,000 Active 59 DOM
-
2026-06-17days on market $250,000 Active 58 DOM
-
2026-06-16days on market $250,000 Active 57 DOM
-
2026-06-15days on market $250,000 Active 56 DOM
-
2026-06-13days on market $250,000 Active 54 DOM
-
2026-06-10days on market $250,000 Active 50 DOM
-
2026-06-08days on market $250,000 Active 49 DOM
-
2026-06-08days on market $250,000 Active 48 DOM
-
2026-06-04days on market $250,000 Active 45 DOM
-
2026-06-03days on market $250,000 Active 44 DOM
-
2026-06-01days on market $250,000 Active 42 DOM
-
2026-05-31days on market $250,000 Active 41 DOM
-
2026-04-21$250,000 Active 620-char remark
Show marketing remark (620 chars)
Spacious Renovated 1-Bedroom Apartment - South Riverdale Enjoy comfort and convenience in this beautifully renovated one-bedroom home located in the heart of South Riverdale. The apartment features a large living room , a windowed eat-in kitchen with modern finishes, and a windowed, renovated bathroom. A wall of closets in both the hallway and bedroom provides abundant storage, while gleaming hardwood floors add warmth throughout. Building amenities include a part-time doorman, seasonal outdoor swimming pool, bike and regular storage, common laundry room, and indoor/outdoor parking. The building is pet-friendly.
-
2026-04-20$250,000 Active
-
2017-08-29soldstatus Closed
-
2016-10-11soldstatus $160,000 Sold
-
2016-10-11price $160,000
-
2016-10-11soldstatus $160,000
-
2016-10-11soldstatus $160,000
-
2016-10-11soldstatus $160,000 Closed
-
2016-09-14historical Pending
-
2016-09-14status Under Contract
-
2016-09-14price $164,900
-
2016-04-26price $164,900
-
2016-04-26price $164,900
-
2016-04-07$169,900 New
-
2016-04-07$164,900
-
2016-03-17$169,900 Active
-
2016-03-17$164,900
-
2016-03-17$164,900
-
2016-03-17$164,900
-
2016-02-29historical Withdrawn
-
2016-02-29historical
-
2016-01-14Active
-
2016-01-13$175,000
-
2014-03-15price $145,000
-
2012-03-06soldstatus $145,000
-
2012-02-23price $149,900
-
2011-07-28$149,900
-
2011-07-25historical
-
2011-02-04
-
2010-12-13historical
-
2010-06-18historical
-
2010-06-18
-
2009-12-07
-
2009-12-06historical
-
2009-04-06
-
2008-10-31historical
-
2008-07-24
ⓘ Source: listings_history table (triggers on properties + properties_extension) + one-shot
backfill from property_details.listing_events for pre-trigger history.
Climate risk First Street
- Flood 1/10 Low FEMA zone X (unshaded) · 0% chance over 30 yrs
- Wildfire 1/10 Low
- Heat 6/10 Major 7 d/yr ≥99°F today · 15 d/yr by 30 yrs out
- Wind 6/10 Major 27% chance of damaging wind over 30 yrs
- Air quality 3/10 Moderate 3 unhealthy d/yr today · 4 by 30 yrs out
Nearby sold comps map
Loading sold comps map…
Walkable amenities ~0.75 mi
Loading nearby amenities…
Taxation est. · year 1
- Rental income
- $30,569
- − Mortgage interest
- −$14,004
- − Property taxes
- −$3,750
- − Insurance
- −$1,250
- − Repairs & maintenance
- −$2,446
- − Management
- −$2,446
- − Depreciation
- −$7,273
- Taxable loss
- −$598
- Est. tax savings @ 24.0%
- +$144
- After-tax cash flow
- $3,561/yr
For passive investors: Depreciation is non-cash, so a rental often shows a tax loss while cash-flowing — sheltering income. Rental losses are passive: they offset passive income freely, and up to $25,000/yr can offset ordinary (W-2) income if you actively participate and your MAGI is under $100k (phasing out to $0 by $150k); unused losses carry forward. On sale, claimed depreciation is recaptured at up to 25%, and gains may owe capital-gains tax (a 1031 exchange can defer both). Figures are a year-1 estimate at your 24.0% rate — not tax advice; consult a CPA.
Schools (NCES district)
No district data.
Livability — New York
- Score
- 75/100
- State rank
- #268
- US rank
- #4188
Category grades
Schools grade is shown separately in the Schools card above.
Census & demographics
- Census place
- New York, NY
- County
- Bronx County · 1,197,324 people
- City population
- 7,731,280
- Metro
- New York-Newark-Jersey City, NY-NJ-PA
- Population (ZIP)
- 69,470
- Household income
- $74,974
- Rent vs Own
- Severe rent burden
- 5586.0
Population outlook (Bronx County) Hauer SSP2
- Today (2025)
- 1,607,353 people
- By 2030
- 1,681,852 · +4.6%
- By 2040
- 1,824,421 · +13.5%
- By 2050
- 1,945,470 · +21.0%
- By 2075
- 2,187,887 · +36.1%
- By 2100
- 2,244,136 · +39.6%
Race, ethnicity, and origin ACS 2023
- Neighborhood character
- Diverse neighborhood (Simpson 0.65)
- Race & ethnicity
- Hispanic / Latino 50% White 30% Two or more races 17% Black 12% Asian 4% Native American 2%
- Hispanic origin (detail)
- Mexican 3% Puerto Rican 12% Cuban 1% Dominican 25%
- Common ancestry
- Scotch-Irish 3% Romanian 2% Lithuanian 1%
- Foreign-born
- 30% · Canada, Jamaica, China
- Languages at home
- 50% English-only · Spanish 40% Other Indo-European 3% Russian/Polish/Slavic 2%
Political lean MEDSL · Bronx
- 2024 margin
- Solid D (+45.4) · D 72.7% · R 27.3%
- 2008→2024 swing
- -32.3pp toward R · 2008: 77.8pp · 2024: 45.4pp
- All cycles
- 2024: D+45.4 2020: D+67.6 2016: D+79.1 2012: D+82.9 2008: D+77.8
Not yet ingested
- Civics
- —
Market trends
- HPI YoY
- ▼ -294.75%
- Current HPI
- 168.0211
- Rent YoY
- ▲ 11.60%
- Metro
- New York-Newark-Jersey City, NY-NJ-PA
- State GDP YoY
- ▲ 2.60%
- F500 in state
- 92
Industry mix (Fortune 500 HQ in NY)
| Industry | F500 HQs | Revenue |
|---|---|---|
| Financial Services | 10 | $950B |
|
||
| Consumer Goods | 9 | $162B |
|
||
| Insurance | 4 | $225B |
|
||
| Telecommunications | 2 | $144B |
|
||
| Pharmaceuticals | 2 | $112B |
|
||
| Media / Entertainment | 2 | $69B |
|
||
Price history
+66.8% since first listed37 events — show timeline
- 2026-04-21 Listed $250,000 RLS at REBNY
- 2026-04-20 Listed $250,000 OneKey® MLS as Distributed by MLS Grid
- 2017-08-29 Sold (MLS) — RLS at REBNY
- 2016-10-11 Price Changed $160,000 HGMLS
- 2016-10-11 Sold (MLS) $160,000 HGMLS
- 2016-10-11 Sold (MLS) $160,000 OneKey® MLS as Distributed by MLS Grid
- 2016-10-11 Sold (MLS) $160,000 OneKey® MLS as Distributed by MLS Grid
- 2016-10-11 Sold (MLS) $160,000 MLSLI
- 2016-09-14 Contingent — HGMLS
- 2016-09-14 Pending — MLSLI
- 2016-09-14 Price Changed $164,900 HGMLS
- 2016-04-26 Price Changed $164,900 HGMLS
- 2016-04-26 Price Changed $164,900 MLSLI
- 2016-04-07 Listed $169,900 MLSLI
- 2016-04-07 Listed $164,900 OneKey® MLS as Distributed by MLS Grid
- 2016-03-17 Listed $169,900 HGMLS
- 2016-03-17 Listed $164,900 RLS at REBNY
- 2016-03-17 Listed $164,900 OneKey® MLS as Distributed by MLS Grid
- 2016-03-17 Listed $164,900 RLS at REBNY
- 2016-02-29 Delisted — HGMLS
- 2016-02-29 Listing Removed — OneKey® MLS as Distributed by MLS Grid
- 2016-01-14 Listed — HGMLS
- 2016-01-13 Listed $175,000 OneKey® MLS as Distributed by MLS Grid
- 2014-03-15 Price Changed $145,000 HGMLS
- 2012-03-06 Sold (MLS) $145,000 HGMLS
- 2012-02-23 Price Changed $149,900 HGMLS
- 2011-07-28 Listed $149,900 HGMLS
- 2011-07-25 Delisted — HGMLS
- 2011-02-04 Listed — HGMLS
- 2010-12-13 Delisted — HGMLS
- 2010-06-18 Listed — HGMLS
- 2010-06-18 Delisted — HGMLS
- 2009-12-07 Listed — HGMLS
- 2009-12-06 Delisted — HGMLS
- 2009-04-06 Listed — HGMLS
- 2008-10-31 Delisted — HGMLS
- 2008-07-24 Listed — HGMLS
Cash-flow waterfall
monthlySold comps — $/sqft
last 12 mo · ≤1 miLoading sold comps…