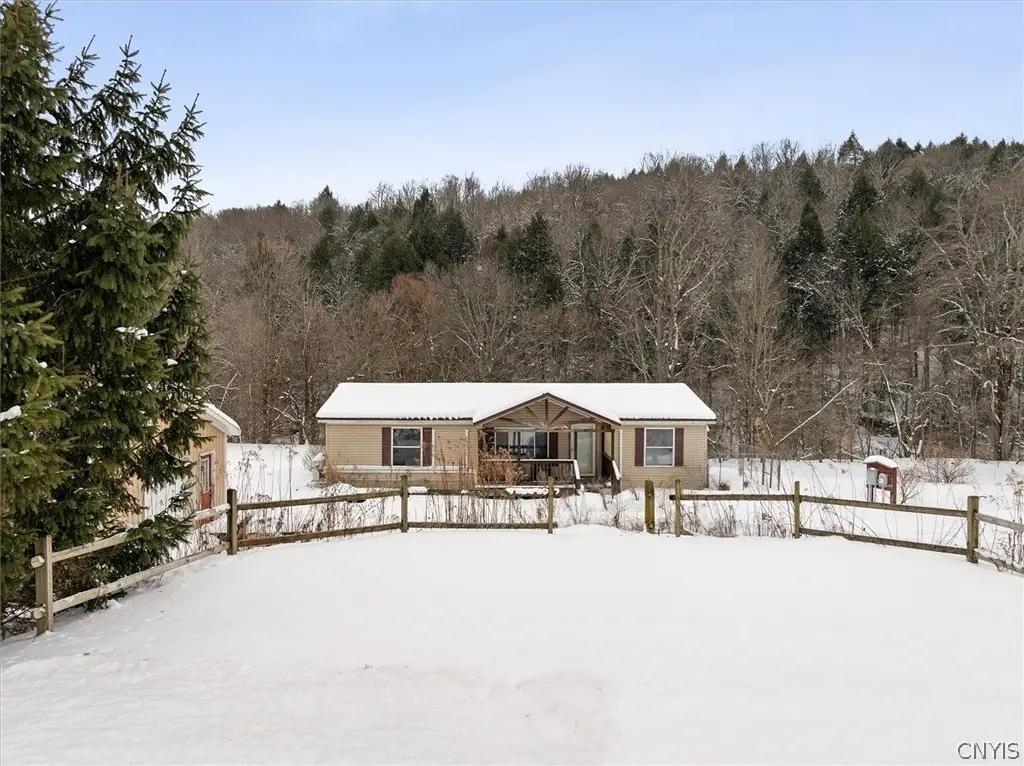
9996 Stanbro Rd · Unadilla Forks, NY
Flood risk 4/10 · Minor
- FEMA flood zone
- X
- Chance of flooding over 30 yrs
- 0.22%
- Est. flood insurance / yr
- $507 – $1,088
Fire risk 2/10 · Minimal
- Est. fire insurance / yr
- $691 – $1,283
Heat risk 1/10 · Minimal
- Hot days now (above 93°F)
- 7 days/yr
- Hot days in 30 yrs
- 17 days/yr
Wind risk 2/10 · Minimal
- Chance of severe wind over 30 yrs
- 1.0%
Air-quality risk 1/10 · Minimal
- Unhealthy air days now
- 0 days/yr
- Unhealthy air days in 30 yrs
- 0 days/yr
Risk factors via First Street. Map © Google.
Why this score? — see what drove the D+ grade
The composite is a weighted blend of 9 inputs, each scored 0–100. Each bar is that input's sub-score; the figure is the points it added to the 100-point composite (weight × sub-score).
- Cash flow +12.9/30.0
- Appreciation +9.7/10.0
- ARV discount +7.5/15.0
- 1% rule +4.2/10.0
- DSCR +3.9/10.0
- Schools +3.8/10.0
- Rent growth +2.5/5.0
- Livability +2.5/5.0
- Condition / age +2.5/5.0
$135,000
🖨 Deal sheet 📄 Offer letter ✓ Due diligence
Listing remarks
Peace, Privacy and Virtually no neighbors! This property is ready for it's new owner. Featuring 3 bedrooms, large eat in kitchen, master bedroom en-suite, big living room for all the family gatherings and events throughout the year, oversized heated garage, individual air conditioning pods to cool only the rooms you want cutting down the National Grid Bill, all sitting on 1.4 acres of land. Let the deer greet you in the morning and enjoy beautiful sunsets in the country. West Edmeston is calling your name, schedule your private showing today!
Key facts
- 1.43 acre lot
- 2 garage spots
- Built 1994
Property features AI
Exterior
- Parking: Detached heated garage; 2-car garage
- Utilities: Electricity connected; Well water; Septic tank
- Home design: Double wide mobile home; Single-story; Resale condition
- Construction: Vinyl siding; Shingle roof; Block foundation; Attic/crawl hatchway(s) insulated; Existing (year built details)
- Exterior features: Gravel driveway; Irregular lot; Main thoroughfare frontage
Interior
- Kitchen: Dishwasher; Electric cooktop; Range hood; Refrigerator; Exhaust fan; Water heater (listed with equipment/remarks)
- Bedrooms: 3 main-level bedrooms
- Flooring: Laminate flooring; Varied flooring
- Bathrooms: 2 full bathrooms (both on the main level)
- Heating & cooling: Ductless cooling; Ductless heating; Propane heating
- Interior features: Eat-in kitchen; Main-level laundry; Laundry room
- Laundry & utility: Main-level laundry
Neighborhood map
What this means for you Summary
Snapshot
- This is a 3-bed/2.0-bath manufactured listed at $135k.
Deal economics
- At list price, monthly cash flow is $-10 ($-126/yr) — negative.
- To cash-flow at today's rent, offer at most $133k (1.4% below list).
- To meet the 1% rule (rent ≥ 1% of price), the offer needs to be $124k (8.4% below list).
- Recommended offer: $124k (8.4% below list) — sets the bar for 1% rule.
Location & tenants
- Location reads: area grade D — affects rentability + tenant quality, not the cash-flow math above.
- Brookfield Central School District (rural): math 45% / reading 40% proficiency, ranked #605 of 755 in NY (top 80%) — families likely to look elsewhere, expect single-tenant / working-renter base with shorter leases.
- Market conditions: 13 active listings in the ZIP; 137 units permitted in Madison County in 2024 (46 in 5+ unit buildings).
Forward outlook
- In year one you build about $14k of equity ($933 loan paydown + $13k appreciation (9.4% local appreciation)).
- Madison County population projected at -24% by 2050 — secular population decline; favor cash flow + early exit over multi-decade hold.
- At projected returns (9.4% appreciation + 3.0% rent growth), your $38k cash investment doubles in ~3 years — after that, you're playing with house money.
- By year 3, paydown + projected appreciation supports a ~$34k cash-out refi (75% LTV) — recoverable capital for the next deal without selling this one.
Negotiation context
- Only 4 days on market — expect competitive offers; lowballing is unlikely to land.
- 2 sale attempts since 14y ago with the ask held roughly flat each time — persistent listings suggest the price (not the market) is what's stuck; bring a comps-based counter.
Questions for the listing agent
- What do current leases actually rent for vs. the listed asking? Can we see a recent rent roll and the last 12 months of T-12 income?
- Is there a deadline driving the sale (1031 exchange, divorce, estate, relocation)? That informs how much negotiation room exists.
- The area grade is low — what's the realistic commute time and amenity access for the typical tenant pool here? Any planned neighborhood developments (good or bad) we should know about?
- What's the average days-on-market for RENTAL listings here right now (not sales)? A rising rental-DOM trend means longer vacancies and softer asking-rent achievability than the comps imply.
- What's the recent tenant-quality profile in this submarket — average credit score on applications, eviction rate, late-payment / NSF rate, and stable-employment percentage? A property-management company in the area should have these aggregated.
- How much new for-sale + rental construction is in the pipeline within 1–3 miles? Heavy new supply typically softens prices + rents 12–24 months out; constrained supply supports both.
Investment metrics
- 1% rule
- 0.92% ✗
- Cap rate
- 6.20%
- Cash-on-cash
- -0.33%
- DSCR
- 0.99
- GRM
- 9.1
CMA / ARV
No comps found within radius.
Projected returns pro-forma
9.41% appreciation · 3.0% rent growth · sell at horizon
- IRR
- 22.8%
- Equity multiple
- 2.78×
- Total profit
- $67,470
- Equity at exit
- $115,834
- IRR
- 20.5%
- Equity multiple
- 6.24×
- Total profit
- $198,049
- Equity at exit
- $243,890
Cash invested: $37,800 (down + closing). Projections, not guarantees.
Landlord ↔ Tenant lean methodology
- Overall (STATE)
- 15 Strongly Tenant-Friendly
- State New York
- 15 Strongly Tenant-Friendly · D+10
- County
- — inherits STATE
- City
- — inherits STATE
ZIP-level market 13485
- Home prices YoY
- 3.3%
- Active inventory
- 13
- Price-to-rent
- 9.1×
Monthly cashflow live
- Estimated rent
- $1,236 medium interval (Pro) →
- Mortgage (P&I)
- −$708
- Tax from tax record
- −$223 /mo · $2,676/yr
- Insurance
- −$56
- HOA
- −$0
- Vacancy / Maint / Mgmt
- −$260
- Net cashflow
- $-10
Break-even live
UW: 25.0% down · 7.5% · 30yr · 1.5% tax · 5.0% vac · 8.0% maint · 8.0% mgmt
Financing live
Cash to close
- Down payment
- $33,750
- Closing costs
- $4,050
- Reserves months
- —
- Total cash needed
- —
Loan-product check · same deal, 3 products live
Conventional
25% down · 7.5% · 30yr
- Down + closing
- —
- Monthly P&I
- —
- Monthly cashflow
- —
- DSCR
- —
- Eligible?
- —
Personal DTI + credit; lowest rate.
DSCR
20% down · 8.5% · 30yr
- Down + closing
- —
- Monthly P&I
- —
- Monthly cashflow
- —
- DSCR
- —
- Eligible?
- —
No personal income docs; deal must DSCR.
Hard money
10% down · 12.0% · 12mo
- Down + closing
- —
- Monthly P&I
- —
- Monthly cashflow
- —
- DSCR
- —
- Eligible?
- —
Short-term bridge; refi at stabilization.
Listing history 6 events
-
2026-04-10status Pending
-
2026-04-06$135,000 Active
-
2023-07-10soldstatus $191,000
-
2013-05-09soldstatus $71,000
-
2012-09-21historical
-
2012-03-21$79,900
ⓘ Source: listings_history table (triggers on properties + properties_extension) + one-shot
backfill from property_details.listing_events for pre-trigger history.
Tax reassessment forecast NY · Partial reset (capped growth)
- Current annual tax
- $2,676 · $223/mo
- Projected year-2 tax
- $2,676 · $223/mo
- Expected delta
- $0/yr ($0/mo · 0.0%)
ⓘ Screening estimate from a state-policy table — verify with the county assessor before closing.
Climate risk First Street
- Flood 4/10 Moderate FEMA zone X · 22% chance over 30 yrs
- Wildfire 2/10 Low
- Heat 1/10 Low 7 d/yr ≥93°F today · 17 d/yr by 30 yrs out
- Wind 2/10 Low 100% chance of damaging wind over 30 yrs
- Air quality 1/10 Low 0 unhealthy d/yr today · 0 by 30 yrs out
Nearby sold comps map
Loading sold comps map…
Walkable amenities ~0.75 mi
Loading nearby amenities…
Taxation est. · year 1
- Rental income
- $14,836
- − Mortgage interest
- −$7,562
- − Property taxes
- −$2,676
- − Insurance
- −$675
- − Repairs & maintenance
- −$1,187
- − Management
- −$1,187
- − Depreciation
- −$3,927
- Taxable loss
- −$2,378
- Est. tax savings @ 24.0%
- +$571
- After-tax cash flow
- $445/yr
For passive investors: Depreciation is non-cash, so a rental often shows a tax loss while cash-flowing — sheltering income. Rental losses are passive: they offset passive income freely, and up to $25,000/yr can offset ordinary (W-2) income if you actively participate and your MAGI is under $100k (phasing out to $0 by $150k); unused losses carry forward. On sale, claimed depreciation is recaptured at up to 25%, and gains may owe capital-gains tax (a 1031 exchange can defer both). Figures are a year-1 estimate at your 24.0% rate — not tax advice; consult a CPA.
Schools (NCES district)
- District
- Brookfield Central School District
- NCES district ID
- 3605670
- Math proficiency
- 45% ▼ -5.00%
- Reading proficiency
- 40% ▼ -5.00%
- Median HH income
- $45,610
- Composite
- 38.48/100
- National rank
- #8474
- State rank
- #605 of 755 in NY
Livability — Unadilla Forks
No livability data for this city. (Only ~50 U.S. cities are tracked.)
Census & demographics
- Population (ZIP)
- 1,715
Population outlook (Madison County) Hauer SSP2
- Today (2025)
- 69,528 people
- By 2030
- 66,599 · -4.2%
- By 2040
- 59,814 · -14.0%
- By 2050
- 52,842 · -24.0%
- By 2075
- 39,167 · -43.7%
- By 2100
- 28,442 · -59.1%
Race, ethnicity, and origin ACS 2023
- Neighborhood character
- Predominantly White (96%)
- Race & ethnicity
- White 96% Two or more races 2% Hispanic / Latino 1%
- Common ancestry
- Romanian 3% Lithuanian 3% Italian 3%
- Foreign-born
- 2% · Canada, China
- Languages at home
- 87% English-only · German/W. Germanic 11% Spanish 2%
Political lean MEDSL · Madison
- 2024 margin
- R (+13.1) · D 43.5% · R 56.5%
- 2008→2024 swing
- -13.9pp toward R · 2008: 0.9pp · 2024: -13.1pp
- All cycles
- 2024: R+13.1 2020: R+10.6 2016: R+15.9 2012: D+0.3 2008: D+0.9
Not yet ingested
- Civics
- —
Market trends
- HPI YoY
- ▲ 9.41%
- Current HPI
- 291.2269
- Rent YoY
- —
- Metro
- —
- State GDP YoY
- ▲ 2.60%
- F500 in state
- 92
Industry mix (Fortune 500 HQ in NY)
| Industry | F500 HQs | Revenue |
|---|---|---|
| Financial Services | 10 | $950B |
|
||
| Consumer Goods | 9 | $162B |
|
||
| Insurance | 4 | $225B |
|
||
| Telecommunications | 2 | $144B |
|
||
| Pharmaceuticals | 2 | $112B |
|
||
| Media / Entertainment | 2 | $69B |
|
||
Price history
+69.0% since first listed6 events — show timeline
- 2026-04-10 Pending — CNYIS
- 2026-04-06 Listed $135,000 CNYIS
- 2023-07-10 Sold (Public Records) $191,000 Public Records
- 2013-05-09 Sold (Public Records) $71,000 Public Records
- 2012-09-21 Listing Removed — CNYIS
- 2012-03-21 Listed $79,900 CNYIS
Property tax history
+3.6%/yrLatest (2025): $2,676 · +0.9% YoY. Source: county tax records.
Cash-flow waterfall
monthlySold comps — $/sqft
last 12 mo · ≤1 miLoading sold comps…