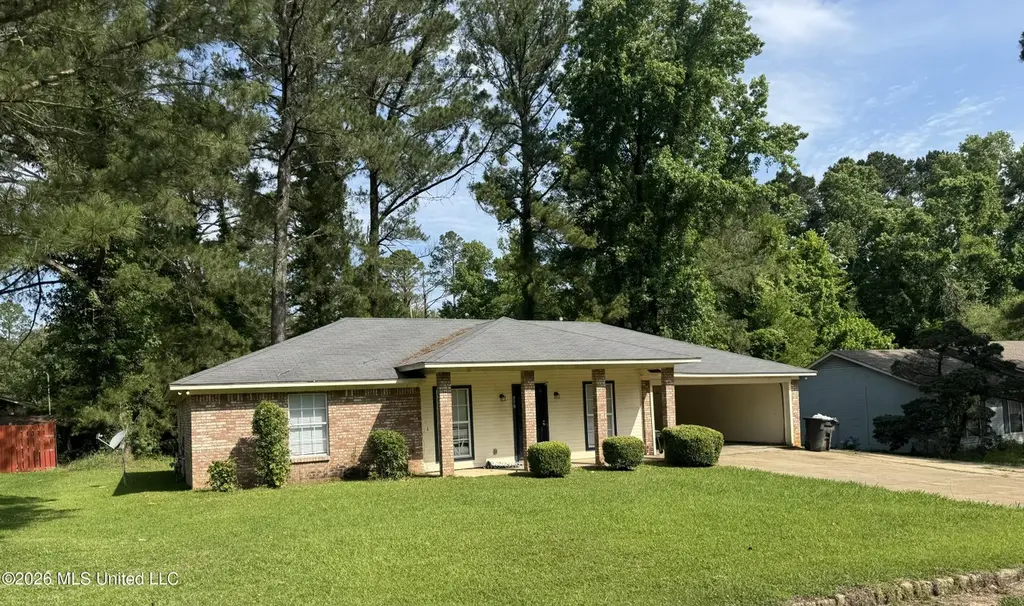
579 Briarcliff Cir · Jackson, MS
Flood risk 1/10 · Minimal
- FEMA flood zone
- X (unshaded)
- Chance of flooding over 30 yrs
- 0.0%
- Est. flood insurance / yr
- $507 – $1,088
Fire risk 3/10 · Minor
- Est. fire insurance / yr
- $1,241 – $2,305
Heat risk 7/10 · Major
- Hot days now (above 108°F)
- 7 days/yr
- Hot days in 30 yrs
- 20 days/yr
Wind risk 8/10 · Major
- Chance of severe wind over 30 yrs
- 80.0%
Air-quality risk 1/10 · Minimal
- Unhealthy air days now
- 0 days/yr
- Unhealthy air days in 30 yrs
- 0 days/yr
Risk factors via First Street. Map © Google.
Why this score? — see what drove the B+ grade
The composite is a weighted blend of 9 inputs, each scored 0–100. Each bar is that input's sub-score; the figure is the points it added to the 100-point composite (weight × sub-score).
- Cash flow +30.0/30.0
- ARV discount +15.0/15.0
- 1% rule +10.0/10.0
- DSCR +10.0/10.0
- Rent growth +3.6/5.0
- Livability +3.4/5.0
- Condition / age +2.5/5.0
- Schools +1.1/10.0
- Appreciation +0.0/10.0
$75,000
🖨 Deal sheet 📄 Offer letter ✓ Due diligence
Listing remarks MLS
1997 Ranch offers 3 bed, 2 bath, with approximately 1300 square feet of living space, and an attached 2 car garage. The home is situated on a sizable lot measuring about 0.28 acres with well manicured landscaping. Some of the features include neutral paint, wall to wall carpet, custom built ins, lots of natural light, and an eat in galley style kitchen. Add a personal touch and see what you can do here!REO PROPERTY-BANK OWNED. PROPERTY SOLD AS IS. Buyer or Buyer's Agent will be responsible for activation of utilities related to inspections.
Key facts
- 0.28 acre lot
- 2 garage spots
- Built 1996
Property features AI
Exterior
- Parking: Attached 2-car garage
- Utilities: Public water; Public sewer; Cable available
- Home design: Single-family residence (house); One level
- Construction: Brick construction; Slab foundation; Built (year source: public records)
- Exterior features: Shingle roof; Lot approximately 0.28 acres
Interior
- Kitchen: Free-standing range
- Bathrooms: 2 full bathrooms
- Heating & cooling: Central heating; Central air conditioning
- Interior features: Vinyl windows
Neighborhood map
What this means for you Summary
Snapshot
- This is a 3-bed/2.0-bath single-family listed at $75k.
Deal economics
- At list price, monthly cash flow is $370 ($4k/yr) — positive.
- The deal already cash-flows at list — no discount required.
- Meets the 1% rule at list price ($1k rent vs $75k).
- Recommended offer: $74k (1.5% below list) — sets the bar for market timing.
- Cap rate 12.2% vs local median 9.9% in Jackson — meaningfully above typical; check what's discounted (condition, days-on-market, listing class) to confirm the premium yield is real.
Location & tenants
- Location reads 68/100 on livability (#66 in MS) — a middle-class / working-renter tenant base. Strengths: commute A+, cost of living A+, housing A+; Watch: amenities F, employment F, health & safety F.
- Jackson Public School District (urban): math 9% / reading 18% proficiency, ranked #112 of 130 in MS (top 86%) — low school quality limits family demand, transient renter base, plan for 1-2y turnover; 88% free/reduced lunch — lower-income household profile, screen leases tightly.
- Zoned schools: Oak Forest Elementary School (math 2% / reading 12%, grade F, #337 of 375 statewide, top 94%, 318 students, 100% FRL); Forest Hill High School (math 5% / reading 15%, grade F, #168 of 197 statewide, top 86%, 991 students, 100% FRL).
- Market conditions: Rents rising fast (+4.2%/yr); 302 active listings in the ZIP; 33 comparable units currently listed for rent nearby; rentals at typical pace (median 23d on market — plan ~3-4 weeks tenant-placement turnaround); 167 units permitted in Hinds County in 2024 (0 in 5+ unit buildings).
- This rent runs 30% of the median local income ($51k/yr) — at the standard rent-burdened threshold; future hikes will face affordability resistance.
Forward outlook
- Local home prices are declining (-3.0%/yr); year-one equity from $519 of loan paydown is wiped out by about $2k of value loss. Plan a longer hold.
- Hinds County population projected to shrink 6% by 2050 — rents likely to lag national; underwrite the cash flow, not the appreciation.
- At projected returns (-3.0% appreciation + 4.2% rent growth), your $21k cash investment doubles in ~6 years — after that, you're playing with house money.
Negotiation context
- It's been on market 15 days — a 2% lower offer ($74k) is reasonable based on typical stale-listing flexibility.
- 4 sale attempts since 23y ago with the ask held roughly flat each time — persistent listings suggest the price (not the market) is what's stuck; bring a comps-based counter.
Risks & watch-outs
- Watch-outs: property tax is 3.4% of price.
- Climate carrying-cost: severe wind risk, 80% chance of damaging wind over 30y; extreme-heat days projected 7→20/yr by 2055 (HVAC capex compounding) — expect insurance premiums to compound above CPI over the hold.
Questions for the listing agent
- Property tax is high relative to price — has the assessment been appealed recently, and will the sale trigger a re-assessment?
- Is there a deadline driving the sale (1031 exchange, divorce, estate, relocation)? That informs how much negotiation room exists.
- Schools are F-rated, which usually means shorter tenancies and higher turnover. Who's the typical renter profile here, and what's been the actual vacancy rate?
- What's the average days-on-market for RENTAL listings here right now (not sales)? A rising rental-DOM trend means longer vacancies and softer asking-rent achievability than the comps imply.
- What's the recent tenant-quality profile in this submarket — average credit score on applications, eviction rate, late-payment / NSF rate, and stable-employment percentage? A property-management company in the area should have these aggregated.
- How much new for-sale + rental construction is in the pipeline within 1–3 miles? Heavy new supply typically softens prices + rents 12–24 months out; constrained supply supports both.
Investment metrics
- 1% rule
- 1.70% ✓
- Cap rate
- 12.21%
- Cash-on-cash
- 21.12%
- DSCR
- 1.94
- GRM
- 4.9
CMA / ARV
- ARV (on-the-fly)
- $103,490
- Comps found
- 12
Show comp detail 12 sales within ~0.75 mi
| Address | Dist | Beds/Ba | Sqft | Sold | Price | $/sf | Match |
|---|---|---|---|---|---|---|---|
| 495 Chelsea Dr | 0.07mi | 3/2.0 | 1,340 (+2%) | 2mo | $145,900 | $109 | 91 |
| 622 Chelsea Dr | 0.16mi | 3/2.0 | 1,342 (+2%) | 2mo | $115,000 | $86 | 87 |
| 605 Upper Darby Rd | 0.06mi | 3/2.0 | 1,442 (+10%) | 3mo | $155,000 | $107 | 78 |
| 637 Chelsea Dr | 0.18mi | 3/2.0 | 1,230 (-6%) | 11mo | $60,000 | $49 | 72 |
| 611 Chelsea Dr | 0.12mi | 3/1.5 | 1,118 (-15%) | 1mo | $26,900 | $24 | 67 |
| 786 Hunter Ln | 0.64mi | 3/2.0 | 1,271 (-3%) | 4mo | $130,000 | $102 | 62 |
| 965 N Valley Falls Rd | 0.58mi | 3/2.0 | 1,329 (+2%) | 12mo | $105,000 | $79 | 61 |
| 3506 Rainey Rd | 0.43mi | 3/2.0 | 1,239 (-5%) | 13mo | $73,000 | $59 | 60 |
| 702 Cooper Rd | 0.59mi | 3/1.0 | 1,241 (-5%) | 4mo | $91,000 | $73 | 56 |
| 3333 Rosemary Ave | 0.69mi | 3/1.5 | 1,241 (-5%) | 5mo | $63,000 | $51 | 53 |
| 3302 Cherrywood Dr | 0.66mi | 3/2.0 | 1,416 (+8%) | 11mo | $80,000 | $56 | 46 |
| 628 David Cv | 0.54mi | 3/2.0 | 1,153 (-12%) | 13mo | $139,900 | $121 | 44 |
Match score weights: distance 35% · size 25% · config 20% · recency 20%. Top-matched comps best support the ARV.
Projected returns pro-forma
-3.0% appreciation · 4.23% rent growth · sell at horizon
- IRR
- 15.2%
- Equity multiple
- 1.62×
- Total profit
- $13,084
- Equity at exit
- $11,183
- IRR
- 25.0%
- Equity multiple
- 3.32×
- Total profit
- $48,821
- Equity at exit
- $6,485
Cash invested: $21,000 (down + closing). Projections, not guarantees.
Landlord ↔ Tenant lean methodology
- Overall (STATE)
- 90 Strongly Landlord-Friendly
- State Mississippi
- 90 Strongly Landlord-Friendly · R+11
- County
- — inherits STATE
- City
- — inherits STATE
ZIP-level market 39212
- Home prices YoY
- -11.7%
- Rents YoY
- 4.2%
- Active inventory
- 302
- Price-to-rent
- 4.9×
Monthly cashflow live
- Estimated rent
- $1,277 high interval (Pro) →
- Mortgage (P&I)
- −$393
- Tax from tax record
- −$215 /mo · $2,574/yr
- Insurance
- −$31
- HOA
- −$0
- Vacancy / Maint / Mgmt
- −$268
- Net cashflow
- $370
Break-even live
UW: 25.0% down · 7.5% · 30yr · 1.5% tax · 5.0% vac · 8.0% maint · 8.0% mgmt
Financing live
Cash to close
- Down payment
- $18,750
- Closing costs
- $2,250
- Reserves months
- —
- Total cash needed
- —
Loan-product check · same deal, 3 products live
Conventional
25% down · 7.5% · 30yr
- Down + closing
- —
- Monthly P&I
- —
- Monthly cashflow
- —
- DSCR
- —
- Eligible?
- —
Personal DTI + credit; lowest rate.
DSCR
20% down · 8.5% · 30yr
- Down + closing
- —
- Monthly P&I
- —
- Monthly cashflow
- —
- DSCR
- —
- Eligible?
- —
No personal income docs; deal must DSCR.
Hard money
10% down · 12.0% · 12mo
- Down + closing
- —
- Monthly P&I
- —
- Monthly cashflow
- —
- DSCR
- —
- Eligible?
- —
Short-term bridge; refi at stabilization.
Rent comps 33 comps
| Address | Beds | Baths | Sqft | Rent | $/sqft | DOM | Units | Dist |
|---|---|---|---|---|---|---|---|---|
| 103 Sykes Park Cir Jackson, MS | 3.0 | 2.0 | 1500 | $1,250 | $0.83 | 43d | 1 | 0.50mi |
| 3511 Sykes Park Dr Jackson, MS | 3.0 | 2.0 | 1225 | $1,426 | $1.16 | 13d | 1 | 0.64mi |
| 3308 Ramona St Jackson, MS | 3.0 | 1.0 | 1104 | $1,150 | $1.04 | 21d | 1 | 0.76mi |
| 270 Wildwood Ct Jackson, MS | 3.0 | 1.0 | 1200 | $1,200 | $1.00 | 21d | 1 | 0.79mi |
| 1010 Deryll St Jackson, MS | 3.0 | 2.0 | 1143 | $1,050 | $0.92 | 13d | 1 | 0.81mi |
| 1018 Deryll St Jackson, MS | 3.0 | 1.0 | 1056 | $900 | $0.85 | 23d | 1 | 0.81mi |
| 1054 Deryll St Jackson, MS | 3.0 | 1.5 | 1132 | $1,050 | $0.93 | 13d | 1 | 0.85mi |
| 156 McCluer Rd Apt A Jackson, MS | 3.0 | 2.0 | 1125 | $1,300 | $1.16 | 21d | 1 | 0.87mi |
| 3151 Shirley Dr Jackson, MS | 4.0 | 2.0 | 1474 | $1,306 | $0.89 | 13d | 1 | 0.87mi |
| 3162 Oak Forest Dr Jackson, MS | 3.0 | 1.5 | 1280 | $1,236 | $0.97 | 43d | 1 | 0.88mi |
| 3341 Suncrest Dr Jackson, MS | 4.0 | 1.0 | 1292 | $1,225 | $0.95 | 43d | 1 | 0.92mi |
| 1219 Woody Dr Jackson, MS | 3.0 | 1.0 | 1058 | $1,150 | $1.09 | 23d | 1 | 0.92mi |
| 422 Cooper Rd Jackson, MS | 3.0 | 1.0 | 1049 | $1,426 | $1.36 | 23d | 1 | 0.93mi |
| 3122 Oak Forest Dr Jackson, MS | 3.0 | 2.0 | 1421 | $1,100 | $0.77 | 43d | 1 | 0.95mi |
| 360 Cooper Rd Jackson, MS | 4.0 | 2.0 | 1624 | $1,575 | $0.97 | 13d | 1 | 1.00mi |
| 3049 Lakewood Dr Jackson, MS | 3.0 | 1.0 | 1200 | $975 | $0.81 | 43d | 1 | 1.05mi |
| 3152 Bilgray Dr Jackson, MS | 3.0 | 1.5 | 1200 | $1,100 | $0.92 | 13d | 1 | 1.09mi |
| 3147 Bilgray Dr Jackson, MS | 3.0 | 2.0 | 1850 | $1,306 | $0.71 | 43d | 1 | 1.09mi |
| 3030 Oak Forest Dr Jackson, MS | 3.0 | 1.5 | 1200 | $1,100 | $0.92 | 43d | 1 | 1.11mi |
| 3030 Oak Forest Dr Jackson, MS | 3.0 | 2.0 | 1200 | $1,100 | $0.92 | 13d | 1 | 1.11mi |
| 1223 Marydale Dr Jackson, MS | 3.0 | 1.0 | 1300 | $950 | $0.73 | 43d | 1 | 1.12mi |
| 3020 Lakewood Dr Jackson, MS | 4.0 | 2.0 | 1600 | $1,150 | $0.72 | 23d | 1 | 1.12mi |
| 140 Neatherwood Dr Jackson, MS | 3.0 | 2.0 | 1450 | $1,297 | $0.89 | 13d | 1 | 1.25mi |
| 2873 Teresa Dr Jackson, MS | 3.0 | 1.0 | 1100 | $1,100 | $1.00 | 43d | 1 | 1.25mi |
| 2904 Marwood Dr Jackson, MS | 3.0 | 2.0 | 1554 | $1,250 | $0.80 | 23d | 1 | 1.32mi |
| 316 Woody Dr Jackson, MS | 3.0 | 1.0 | 1185 | $1,250 | $1.05 | 13d | 1 | 1.33mi |
| 316 Woody Dr Jackson, MS | 3.0 | 1.0 | 1185 | $1,250 | $1.05 | 43d | 1 | 1.33mi |
| 267 Woody Dr Jackson, MS | 3.0 | 1.5 | 1165 | $1,100 | $0.94 | 43d | 1 | 1.36mi |
| 2915 Longwood Dr Jackson, MS | 3.0 | 2.0 | 1800 | $1,400 | $0.78 | 23d | 1 | 1.40mi |
| 3901 Walker Ave Jackson, MS | 3.0 | 2.0 | 1300 | $1,100 | $0.85 | 21d | 1 | 1.41mi |
| 2808 Ridgeland Dr Jackson, MS | 3.0 | 2.0 | 1606 | $1,600 | $1.00 | 43d | 1 | 1.45mi |
| 2786 Brookwood Dr Jackson, MS | 3.0 | 1.0 | 1003 | $1,100 | $1.10 | 43d | 1 | 1.45mi |
| 2729 Carleton St Jackson, MS | 4.0 | 2.0 | 1666 | $1,575 | $0.95 | 13d | 1 | 1.48mi |
Listing history 18 events
-
2026-06-03status $75,000 Pending 15 DOM
-
2026-06-02days on market $75,000 Active 15 DOM
-
2026-06-01days on market $75,000 Active 14 DOM
-
2026-05-31days on market $75,000 Active 13 DOM
-
2026-05-30days on market $75,000 Active 12 DOM
-
2026-05-18$75,000 Active
-
2021-10-01historical
-
2017-12-11soldstatus
-
2017-08-29soldstatus 546-char remark
Show marketing remark (546 chars)
1997 Ranch offers 3 bed, 2 bath, with approximately 1300 square feet of living space, and an attached 2 car garage. The home is situated on a sizable lot measuring about 0.28 acres with well manicured landscaping. Some of the features include neutral paint, wall to wall carpet, custom built ins, lots of natural light, and an eat in galley style kitchen. Add a personal touch and see what you can do here!REO PROPERTY-BANK OWNED. PROPERTY SOLD AS IS. Buyer or Buyer's Agent will be responsible for activation of utilities related to inspections.
-
2017-03-28$42,000 546-char remark
Show marketing remark (546 chars)
1997 Ranch offers 3 bed, 2 bath, with approximately 1300 square feet of living space, and an attached 2 car garage. The home is situated on a sizable lot measuring about 0.28 acres with well manicured landscaping. Some of the features include neutral paint, wall to wall carpet, custom built ins, lots of natural light, and an eat in galley style kitchen. Add a personal touch and see what you can do here!REO PROPERTY-BANK OWNED. PROPERTY SOLD AS IS. Buyer or Buyer's Agent will be responsible for activation of utilities related to inspections.
-
2016-12-02soldstatus
-
2004-03-30soldstatus
-
2004-03-29soldstatus
-
2004-03-05$80,000
-
2003-05-31$85,000
-
2001-03-30soldstatus
-
1997-04-29soldstatus
-
1996-06-17soldstatus
ⓘ Source: listings_history table (triggers on properties + properties_extension) + one-shot
backfill from property_details.listing_events for pre-trigger history.
Tax reassessment forecast MS · Resets to sale price
- Current annual tax
- $2,574 · $215/mo
- Projected year-2 tax
- $2,574 · $215/mo
- Expected delta
- $0/yr ($0/mo · 0.0%)
ⓘ Screening estimate from a state-policy table — verify with the county assessor before closing.
Climate risk First Street
- Flood 1/10 Low FEMA zone X (unshaded) · 0% chance over 30 yrs
- Wildfire 3/10 Moderate
- Heat 7/10 Severe 7 d/yr ≥108°F today · 20 d/yr by 30 yrs out
- Wind 8/10 Severe 80% chance of damaging wind over 30 yrs
- Air quality 1/10 Low 0 unhealthy d/yr today · 0 by 30 yrs out
Nearby sold comps map
Loading sold comps map…
Walkable amenities ~0.75 mi
Loading nearby amenities…
Taxation est. · year 1
- Rental income
- $15,323
- − Mortgage interest
- −$4,201
- − Property taxes
- −$2,574
- − Insurance
- −$375
- − Repairs & maintenance
- −$1,226
- − Management
- −$1,226
- − Depreciation
- −$2,182
- Taxable income
- $3,539
- Est. tax owed @ 24.0%
- −$849
- After-tax cash flow
- $3,587/yr
For passive investors: Depreciation is non-cash, so a rental often shows a tax loss while cash-flowing — sheltering income. Rental losses are passive: they offset passive income freely, and up to $25,000/yr can offset ordinary (W-2) income if you actively participate and your MAGI is under $100k (phasing out to $0 by $150k); unused losses carry forward. On sale, claimed depreciation is recaptured at up to 25%, and gains may owe capital-gains tax (a 1031 exchange can defer both). Figures are a year-1 estimate at your 24.0% rate — not tax advice; consult a CPA.
Schools (NCES district)
- District
- Jackson Public School District
- NCES district ID
- 2802190
- Math proficiency
- 9% ▼ -14.00%
- Reading proficiency
- 18% ▼ -7.00%
- Median HH income
- $33,234
- Composite
- 10.89/100
- National rank
- #9755
- State rank
- #112 of 130 in MS
Livability — Jackson
- Score
- 68/100
- State rank
- #66
- US rank
- #9695
Category grades
Schools grade is shown separately in the Schools card above.
Census & demographics
- Census place
- Jackson, MS
- County
- Hinds County · 167,040 people
- City population
- 140,204
- Metro
- Jackson, MS
- Population (ZIP)
- 25,659
- Household income
- $50,722
- Rent vs Own
- Severe rent burden
- 1314.0
Population outlook (Hinds County) Hauer SSP2
- Today (2025)
- 242,528 people
- By 2030
- 241,113 · -0.6%
- By 2040
- 235,557 · -2.9%
- By 2050
- 226,946 · -6.4%
- By 2075
- 199,995 · -17.5%
- By 2100
- 164,165 · -32.3%
Race, ethnicity, and origin ACS 2023
- Neighborhood character
- Predominantly Black (86%)
- Race & ethnicity
- Black 86% White 9% Hispanic / Latino 3% Two or more races 3%
- Common ancestry
- Serbian 1% Lithuanian 1%
- Foreign-born
- 1% · Canada
- Languages at home
- 97% English-only · Spanish 2%
Political lean MEDSL · Hinds
- 2024 margin
- Solid D (+46.1) · D 72.4% · R 26.3% · Other 1.4%
- 2008→2024 swing
- +7.1pp toward D · 2008: 39.0pp · 2024: 46.1pp
- All cycles
- 2024: D+46.1 2020: D+48.3 2016: D+43.7 2012: D+45.1 2008: D+39.0
Not yet ingested
- Civics
- —
Market trends
- HPI YoY
- ▼ -23.01%
- Current HPI
- 174.4025
- Rent YoY
- ▲ 4.23%
- Metro
- Jackson, MS
- State GDP YoY
- —
- F500 in state
- 0
Price history
-11.8% since first listed13 events — show timeline
- 2026-05-18 Listed $75,000 MLSU
- 2021-10-01 Listing Removed — MLSU
- 2017-12-11 Sold (Public Records) — Public Records
- 2017-08-29 Sold (MLS) — MLSU
- 2017-03-28 Listed $42,000 MLSU
- 2016-12-02 Sold (Public Records) — Public Records
- 2004-03-30 Sold (MLS) — MLSU
- 2004-03-29 Sold (Public Records) — Public Records
- 2004-03-05 Listed $80,000 MLSU
- 2003-05-31 Listed $85,000 MLSU
- 2001-03-30 Sold (Public Records) — Public Records
- 1997-04-29 Sold (Public Records) — Public Records
- 1996-06-17 Sold (Public Records) — Public Records
Property tax history
+7.3%/yrLatest (2025): $2,574 · +3.3% YoY. Source: county tax records.
Cash-flow waterfall
monthlySold comps — $/sqft
last 12 mo · ≤1 miLoading sold comps…