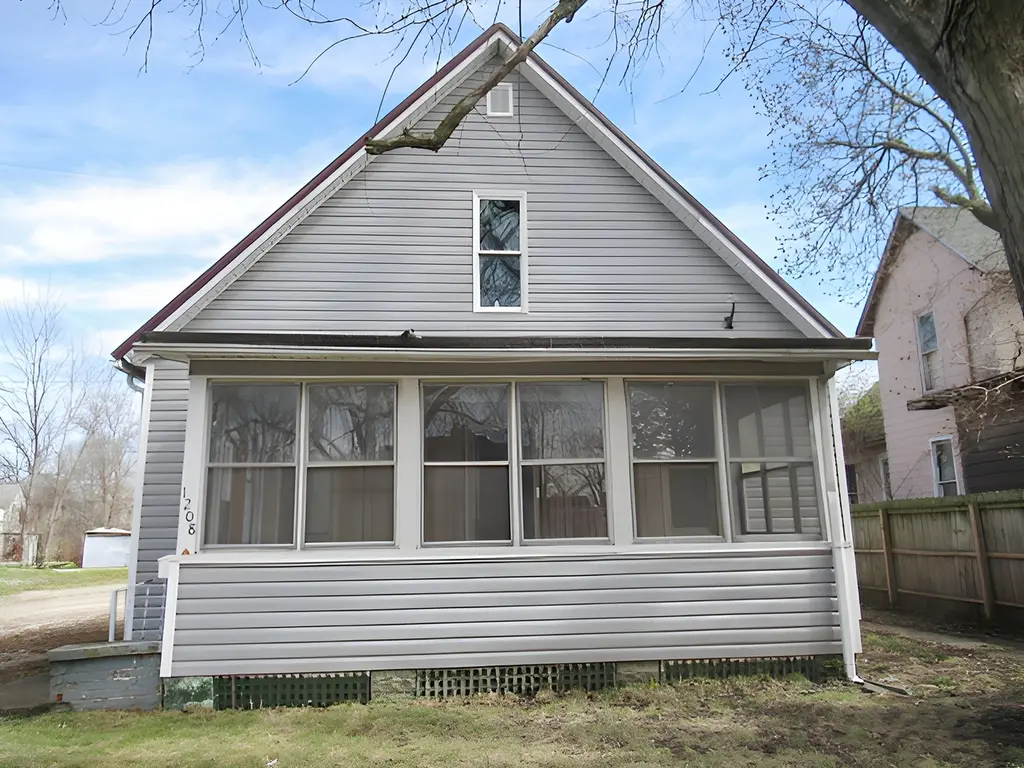
1208 Marshall St · Paris, IL
Flood risk 1/10 · Minimal
- FEMA flood zone
- X (unshaded)
- Chance of flooding over 30 yrs
- 0.0%
- Est. flood insurance / yr
- $473 – $860
Fire risk 1/10 · Minimal
- Est. fire insurance / yr
- $804 – $1,492
Heat risk 4/10 · Minor
- Hot days now (above 104°F)
- 7 days/yr
- Hot days in 30 yrs
- 19 days/yr
Wind risk 2/10 · Minimal
- Chance of severe wind over 30 yrs
- 1.0%
Air-quality risk 4/10 · Minor
- Unhealthy air days now
- 3 days/yr
- Unhealthy air days in 30 yrs
- 5 days/yr
Risk factors via First Street. Map © Google.
Why this score? — see what drove the B+ grade
The composite is a weighted blend of 9 inputs, each scored 0–100. Each bar is that input's sub-score; the figure is the points it added to the 100-point composite (weight × sub-score).
- Cash flow +30.0/30.0
- ARV discount +15.0/15.0
- 1% rule +10.0/10.0
- DSCR +10.0/10.0
- Livability +3.6/5.0
- Schools +2.8/10.0
- Rent growth +2.5/5.0
- Condition / age +2.5/5.0
- Appreciation +0.0/10.0
$47,900
🖨 Deal sheet (PDF) 📄 Offer letter ✓ Due diligence
Listing remarks MLS
Step up to the front porch and sit awhile! Or choose the back deck for evening relaxation. This house is so neat you could move right in. An arched doorway separates the living room from the dining room. The new style barn sliding doors have been left behind. The bathroom is stylish with an oval sink and hand-held shower head. The kitchen colors are bright but attractive. There is even a tankless water heater and side-by-side refrigerator. A small staircase leads upstairs to tandem bedrooms. What are you waiting for?
Key facts
- Barn sliding doors
- Front porch
- Oval sink
Tags
Neighborhood map
What this means for you Summary
Snapshot
- This is a 4-bed/1.0-bath single-family listed at $48k.
Deal economics
- At list price, monthly cash flow is $546 ($7k/yr) — positive.
- The deal already cash-flows at list — no discount required.
- Meets the 1% rule at list price ($1k rent vs $48k).
- Recommended offer: $45k (6.0% below list) — sets the bar for market timing.
- Cap rate 20.0% vs local median 8.3% in Paris — top-decile yield for the area; either an underpriced asset or a hidden risk that comps aren't pricing in. Stress-test before assuming the spread holds.
Location & tenants
- Location reads 71/100 on livability (#342 in IL) — a middle-class / working-renter tenant base. Strengths: cost of living A+, housing A+, health & safety A+; Watch: employment D, crime F, amenities F.
- Paris-Union SD 95 (town): math 25% / reading 42% proficiency, ranked #227 of 620 in IL (top 37%) — families likely to look elsewhere, expect single-tenant / working-renter base with shorter leases.
- Market conditions: 82 active listings in the ZIP; 6 units permitted in Edgar County in 2024 (0 in 5+ unit buildings).
Forward outlook
- Local home prices are declining (-3.0%/yr); year-one equity from $331 of loan paydown is wiped out by about $1k of value loss. Plan a longer hold.
- Edgar County population projected at -30% by 2050 — secular population decline; favor cash flow + early exit over multi-decade hold.
- At projected returns (-3.0% appreciation + 3.0% rent growth), your $13k cash investment doubles in ~3 years — after that, you're playing with house money.
Negotiation context
- It's been on market 76 days — a 6% lower offer ($45k) is reasonable based on typical stale-listing flexibility.
- 5 sale attempts since 8y ago with the ask held roughly flat each time — persistent listings suggest the price (not the market) is what's stuck; bring a comps-based counter.
Risks & watch-outs
- Watch-outs: property tax is 4.4% of price; built in 1905 — expect roof / HVAC / electrical / plumbing capex.
Questions for the listing agent
- It's been on market 76 days. Have you received any prior offers? Is the seller open to a 6% concession, seller financing, or rate buy-down credit?
- Built in 1905 — when were the roof, HVAC, electrical panel, plumbing, and water heater last replaced?
- Property tax is high relative to price — has the assessment been appealed recently, and will the sale trigger a re-assessment?
- Why hasn't it sold? Are there any deal-killer items the seller is aware of (foundation, flood, title, zoning, code violations)?
- Is there a deadline driving the sale (1031 exchange, divorce, estate, relocation)? That informs how much negotiation room exists.
- Crime grade is F in this area — have there been break-ins, vandalism, or insurance claims at this property in the last 3 years? What carrier currently insures it and at what premium?
- What's the average days-on-market for RENTAL listings here right now (not sales)? A rising rental-DOM trend means longer vacancies and softer asking-rent achievability than the comps imply.
- What's the recent tenant-quality profile in this submarket — average credit score on applications, eviction rate, late-payment / NSF rate, and stable-employment percentage? A property-management company in the area should have these aggregated.
- How much new for-sale + rental construction is in the pipeline within 1–3 miles? Heavy new supply typically softens prices + rents 12–24 months out; constrained supply supports both.
Investment metrics
- 1% rule
- 2.63% ✓
- Cap rate
- 19.96%
- Cash-on-cash
- 48.81%
- DSCR
- 3.17
- GRM
- 3.2
CMA / ARV
- ARV (median comp)
- $79,312
- List price
- $47,900
- Delta
- -39.61%
- Verdict
- UNDERPRICED
- Comps
- 20 within 1.0 mi
Show comp detail 8 sales within ~0.75 mi
| Address | Dist | Beds/Ba | Sqft | Sold | Price | $/sf | Match |
|---|---|---|---|---|---|---|---|
| 709 Hannah Ave | 0.39mi | 3/1.5 (-1) | 1,606 (+0%) | 14mo | $83,500 | $52 | 62 |
| 1608 S Main St | 0.28mi | 3/2.0 (-1) | 1,438 (-10%) | 4mo | $130,000 | $90 | 58 |
| 514 W Arthur St | 0.58mi | 3/1.0 (-1) | 1,484 (-7%) | 2mo | $54,900 | $37 | 54 |
| 1011 Douglas St | 0.31mi | 4/2.0 | 1,728 (+8%) | 20mo | $149,900 | $87 | 52 |
| 405 W Madison St | 0.73mi | 3/2.0 (-1) | 1,660 (+4%) | 3mo | $148,000 | $89 | 48 |
| 507 Alexander St | 0.58mi | 3/1.0 (-1) | 1,420 (-11%) | 8mo | $85,000 | $60 | 42 |
| 1 Crawford Ct | 0.56mi | 5/2.0 (+1) | 1,728 (+8%) | 11mo | $108,000 | $63 | 42 |
| 8965 Terre Haute Rd | 0.54mi | 3/2.0 (-1) | 1,698 (+6%) | 18mo | $165,000 | $97 | 40 |
Match score weights: distance 35% · size 25% · config 20% · recency 20%. Top-matched comps best support the ARV.
Projected returns pro-forma
-3.0% appreciation · 3.0% rent growth · sell at horizon
- IRR
- 46.5%
- Equity multiple
- 3.02×
- Total profit
- $27,078
- Equity at exit
- $7,142
- IRR
- 52.3%
- Equity multiple
- 6.12×
- Total profit
- $68,693
- Equity at exit
- $4,142
Cash invested: $13,412 (down + closing). Projections, not guarantees.
Landlord ↔ Tenant lean methodology
- Overall (STATE)
- 43 Moderately Tenant-Leaning
- State Illinois
- 43 Moderately Tenant-Leaning · D+7
- County
- — inherits STATE
- City
- — inherits STATE
ZIP-level market 61944
- Active inventory
- 82
- Price-to-rent
- 3.2×
Monthly cashflow live
- Estimated rent
- $1,258 medium interval (Pro) →
- Mortgage (P&I)
- −$251
- Tax from tax record
- −$177 /mo · $2,127/yr
- Insurance
- −$20
- HOA
- −$0
- Vacancy / Maint / Mgmt
- −$264
- Net cashflow
- $546
Break-even live
Sensitivity live
| Price | -10% $573 | -5% $559 | +0% $546 | +5% $532 | +10% $518 |
|---|---|---|---|---|---|
| Rent | -10% $446 | -5% $496 | +0% $546 | +5% $595 | +10% $645 |
| Rate | -1.0pp $570 | -0.5pp $558 | base $546 | +0.5pp $533 | +1.0pp $521 |
UW: 25.0% down · 7.5% · 30yr · 1.5% tax · 5.0% vac · 8.0% maint · 8.0% mgmt
Financing live
Cash to close
- Down payment
- $11,975
- Closing costs
- $1,437
- Reserves months
- —
- Total cash needed
- —
Loan-product check · same deal, 3 products live
Conventional
25% down · 7.5% · 30yr
- Down + closing
- —
- Monthly P&I
- —
- Monthly cashflow
- —
- DSCR
- —
- Eligible?
- —
Personal DTI + credit; lowest rate.
DSCR
20% down · 8.5% · 30yr
- Down + closing
- —
- Monthly P&I
- —
- Monthly cashflow
- —
- DSCR
- —
- Eligible?
- —
No personal income docs; deal must DSCR.
Hard money
10% down · 12.0% · 12mo
- Down + closing
- —
- Monthly P&I
- —
- Monthly cashflow
- —
- DSCR
- —
- Eligible?
- —
Short-term bridge; refi at stabilization.
Listing history 27 events
-
2026-06-12days on market $47,900 Active 76 DOM
-
2026-06-09days on market $47,900 Active 73 DOM
-
2026-06-08days on market $47,900 Active 72 DOM
-
2026-06-07days on market $47,900 Active 71 DOM
-
2026-06-07days on market $47,900 Active 70 DOM
-
2026-06-04days on market $47,900 Active 67 DOM
-
2026-06-02days on market $47,900 Active 66 DOM
-
2026-06-01days on market $47,900 Active 65 DOM
-
2026-05-31days on market $47,900 Active 64 DOM
-
2026-05-31days on market $47,900 Active 63 DOM
-
2026-05-14price $47,900 529-char remark
Show marketing remark (529 chars)
Step up to the front porch and sit awhile! Or choose the back deck for evening relaxation. This house is so neat you could move right in. An arched doorway separates the living room from the dining room. The new style barn sliding doors have been left behind. The bathroom is stylish with an oval sink and hand-held shower head. The kitchen colors are bright but attractive. There is even a tankless water heater and side-by-side refrigerator. A small staircase leads upstairs to tandem bedrooms. What are you waiting for?
-
2026-03-28$49,900 Active 529-char remark
Show marketing remark (529 chars)
Step up to the front porch and sit awhile! Or choose the back deck for evening relaxation. This house is so neat you could move right in. An arched doorway separates the living room from the dining room. The new style barn sliding doors have been left behind. The bathroom is stylish with an oval sink and hand-held shower head. The kitchen colors are bright but attractive. There is even a tankless water heater and side-by-side refrigerator. A small staircase leads upstairs to tandem bedrooms. What are you waiting for?
-
2024-12-06historical
-
2024-12-05price
-
2024-12-05price $69,900
-
2024-10-23price
-
2024-10-23price $74,900
-
2024-09-06$82,500 Active
-
2024-09-06Active
-
2023-03-10soldstatus $68,900
-
2019-12-03soldstatus $53,000
-
2019-01-09soldstatus $11,000
-
2018-12-31soldstatus $11,000
-
2018-12-31soldstatus $11,000
-
2018-05-22$11,000
-
2018-05-22$11,000
-
1998-01-12soldstatus $39,000
ⓘ Source: listings_history table (triggers on properties + properties_extension) + one-shot
backfill from property_details.listing_events for pre-trigger history.
Tax reassessment forecast IL · Partial reset (capped growth)
- Current annual tax
- $2,127 · $177/mo
- Projected year-2 tax
- $2,127 · $177/mo
- Expected delta
- $0/yr ($0/mo · 0.0%)
ⓘ Screening estimate from a state-policy table — verify with the county assessor before closing.
Climate risk First Street
- Flood 1/10 Low FEMA zone X (unshaded) · 0% chance over 30 yrs
- Wildfire 1/10 Low
- Heat 4/10 Moderate 7 d/yr ≥104°F today · 19 d/yr by 30 yrs out
- Wind 2/10 Low 100% chance of damaging wind over 30 yrs
- Air quality 4/10 Moderate 3 unhealthy d/yr today · 5 by 30 yrs out
Nearby sold comps map
Loading sold comps map…
Walkable amenities ~0.75 mi
Loading nearby amenities…
Taxation est. · year 1
- Rental income
- $15,098
- − Mortgage interest
- −$2,683
- − Property taxes
- −$2,127
- − Insurance
- −$240
- − Repairs & maintenance
- −$1,208
- − Management
- −$1,208
- − Depreciation
- −$1,393
- Taxable income
- $6,240
- Est. tax owed @ 24.0%
- −$1,498
- After-tax cash flow
- $5,050/yr
For passive investors: Depreciation is non-cash, so a rental often shows a tax loss while cash-flowing — sheltering income. Rental losses are passive: they offset passive income freely, and up to $25,000/yr can offset ordinary (W-2) income if you actively participate and your MAGI is under $100k (phasing out to $0 by $150k); unused losses carry forward. On sale, claimed depreciation is recaptured at up to 25%, and gains may owe capital-gains tax (a 1031 exchange can defer both). Figures are a year-1 estimate at your 24.0% rate — not tax advice; consult a CPA.
Schools (NCES district)
- District
- Paris-Union SD 95
- NCES district ID
- 1730750
- Math proficiency
- 25% ▼ -4.00%
- Reading proficiency
- 42% ▼ -7.00%
- Median HH income
- $36,294
- Composite
- 27.73/100
- National rank
- #6901
- State rank
- #227 of 620 in IL
Livability — Paris
- Score
- 71/100
- State rank
- #342
- US rank
- #6933
Category grades
Schools grade is shown separately in the Schools card above.
Census & demographics
- Census place
- Paris, IL
- City population
- 11,426
- Population (ZIP)
- 11,426
Population outlook (Edgar County) Hauer SSP2
- Today (2025)
- 15,960 people
- By 2030
- 14,978 · -6.2%
- By 2040
- 12,990 · -18.6%
- By 2050
- 11,087 · -30.5%
- By 2075
- 7,338 · -54.0%
- By 2100
- 4,526 · -71.6%
Race, ethnicity, and origin ACS 2023
- Neighborhood character
- Predominantly White (96%)
- Race & ethnicity
- White 96% Two or more races 3% Hispanic / Latino 1%
- Common ancestry
- Slovak 2% Serbian 2% Italian 1%
- Foreign-born
- 1%
- Languages at home
- 98% English-only · Spanish 1% Other Indo-European 1%
Political lean MEDSL · Edgar
- 2024 margin
- Solid R (+52.4) · D 23.0% · R 75.3% · Other 1.7%
- 2008→2024 swing
- -44.4pp toward R · 2008: -7.9pp · 2024: -52.4pp
- All cycles
- 2024: R+52.4 2020: R+52.5 2016: R+49.5 2012: R+32.8 2008: R+7.9
Not yet ingested
- Civics
- —
Market trends
- HPI YoY
- ▼ -66.48%
- Current HPI
- 108.1718
- Rent YoY
- —
- Metro
- —
- State GDP YoY
- ▲ 1.59%
- F500 in state
- 60
Industry mix (Fortune 500 HQ in IL)
| Industry | F500 HQs | Revenue |
|---|---|---|
| Insurance | 4 | $201B |
|
||
| Consumer Goods | 4 | $87B |
|
||
| Industrial Machinery | 3 | $64B |
|
||
| Healthcare | 2 | $55B |
|
||
| Retail / Pharmacy | 1 | $148B |
|
||
| Agriculture / Food | 1 | $86B |
|
||
Price history
+22.8% since first listed17 events — show timeline
- 2026-05-14 Price Changed $47,900 MRED as Distributed by MLS Grid
- 2026-03-28 Listed $49,900 MRED as Distributed by MLS Grid
- 2024-12-06 Listing Removed — MRED as Distributed by MLS Grid
- 2024-12-05 Price Changed — MRED as Distributed by MLS Grid
- 2024-12-05 Price Changed $69,900 CIBR
- 2024-10-23 Price Changed — MRED as Distributed by MLS Grid
- 2024-10-23 Price Changed $74,900 CIBR
- 2024-09-06 Listed — MRED as Distributed by MLS Grid
- 2024-09-06 Listed $82,500 CIBR
- 2023-03-10 Sold (Public Records) $68,900 Public Records
- 2019-12-03 Sold (Public Records) $53,000 Public Records
- 2019-01-09 Sold (Public Records) $11,000 Public Records
- 2018-12-31 Sold (MLS) $11,000 MRED as Distributed by MLS Grid
- 2018-12-31 Sold (MLS) $11,000 CIBR
- 2018-05-22 Listed $11,000 MRED as Distributed by MLS Grid
- 2018-05-22 Listed $11,000 CIBR
- 1998-01-12 Sold (Public Records) $39,000 Public Records
Property tax history
+12.1%/yrLatest (2024): $2,127 · +38.6% YoY. Source: county tax records.
Cash-flow waterfall
monthlySold comps — $/sqft
last 12 mo · ≤1 miLoading sold comps…