 Duplex
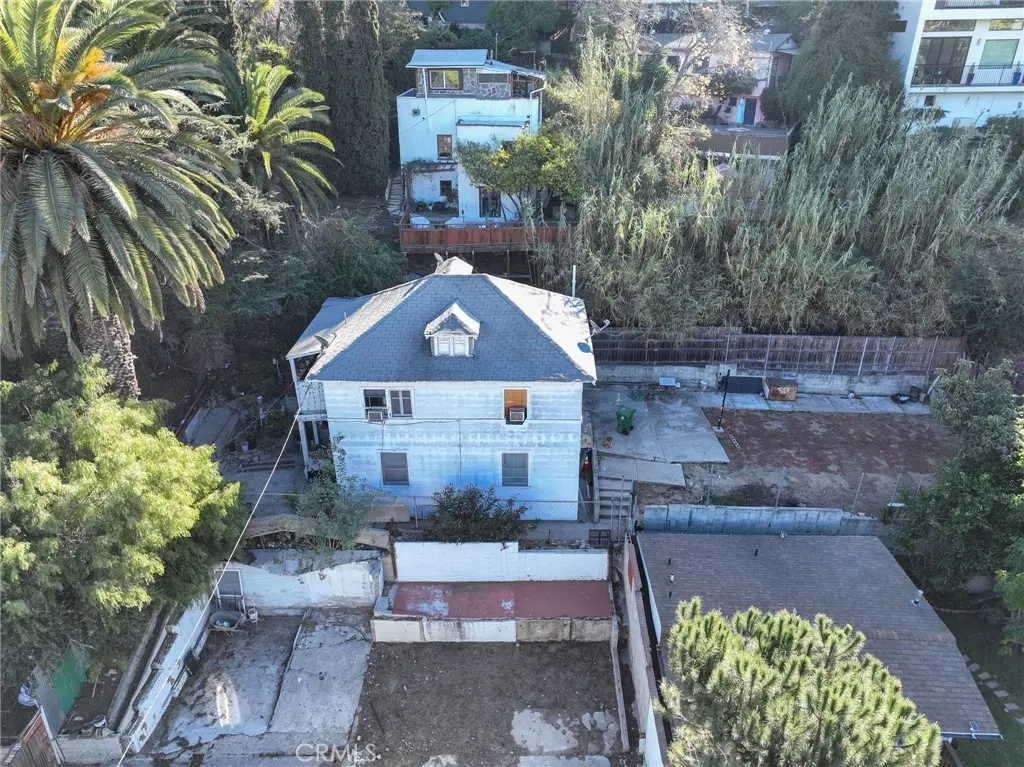
1574 Donaldson St · Los Angeles, CA
Flood risk 5/10 · Moderate
- FEMA flood zone
- X (unshaded)
- Chance of flooding over 30 yrs
- 0.24%
- Est. flood insurance / yr
- $507 – $1,088
Fire risk 2/10 · Minimal
- Est. fire insurance / yr
- $659 – $1,223
Heat risk 5/10 · Moderate
- Hot days now (above 94°F)
- 6 days/yr
- Hot days in 30 yrs
- 18 days/yr
Wind risk 1/10 · Minimal
- Chance of severe wind over 30 yrs
- —
Air-quality risk 6/10 · Moderate
- Unhealthy air days now
- 11 days/yr
- Unhealthy air days in 30 yrs
- 12 days/yr
Risk factors via First Street. Map © Google.
Why this score? — see what drove the C grade
The composite is a weighted blend of 9 inputs, each scored 0–100. Each bar is that input's sub-score; the figure is the points it added to the 100-point composite (weight × sub-score).
- Cash flow +20.4/30.0
- ARV discount +15.0/15.0
- DSCR +6.5/10.0
- 1% rule +5.5/10.0
- Schools +3.6/10.0
- Livability +3.4/5.0
- Rent growth +2.5/5.0
- Condition / age +2.5/5.0
- Appreciation +0.0/10.0
$670,000
🖨 Deal sheet 📄 Offer letter ✓ Due diligence
Multi-family units
County records classify this as Multi-Family (2-4 Unit). Listing-text estimate: 2 units. confirmed
Listing remarks MLS
Duplex in Echo Park—Ideal for Investment or Owner-occupied. Downstairs unit offers 2 beds/1 bath; upstairs unit features 1 bed/1 bath with a private balcony. Located near Echo Park Lake, Elysian Park trails, and the recreation center. Convenient access to major freeways and less than 10 miles from Downtown LA.
Key facts
- Echo park lake
- Elysian park trails
- Private balcony
Tags
Neighborhood map
What this means for you Summary
Snapshot
- This is a 2 × 3-bed/2.0-bath units multifamily listed at $670k.
Deal economics
- At list price, monthly cash flow is $873 ($10k/yr) — positive. Per door: $437/mo.
- The deal already cash-flows at list — no discount required.
- Meets the 1% rule at list price ($7k rent vs $670k).
- Recommended offer: $590k (12.0% below list) — sets the bar for market timing.
- Cap rate 7.9% vs local median 2.1% in Los Angeles — top-decile yield for the area; either an underpriced asset or a hidden risk that comps aren't pricing in. Stress-test before assuming the spread holds.
Location & tenants
- Location reads 68/100 on livability (#273 in CA) — a middle-class / working-renter tenant base. Strengths: amenities A+, commute A+, employment B; Watch: health & safety C-, schools D+, crime F.
- Los Angeles Unified (urban): math 29% / reading 54% proficiency, ranked #223 of 517 in CA (top 43%) — families likely to look elsewhere, expect single-tenant / working-renter base with shorter leases; 67% free/reduced lunch — lower-income household profile, screen leases tightly.
- Market conditions: Rents soft (-0.0%/yr); 179 active listings in the ZIP; 40 comparable units currently listed for rent nearby; rentals lingering (median 44d on market — plan ~5-8 weeks vacancy on turnover, expect pricing pressure); 58% of comp listings sitting > 30 days — soft ceiling on asking rent; solid renter incomes; 19,697 units permitted in Los Angeles County in 2024 (9,426 in 5+ unit buildings).
- At $7,039/mo this rent would consume 97% of the median local household income ($87k/yr) (locally 4974% of renters already pay >50% of income on rent) — very limited rent-growth headroom before tenants either downsize or default.
Forward outlook
- Local home prices are declining (-3.0%/yr); year-one equity from $5k of loan paydown is wiped out by about $20k of value loss. Plan a longer hold.
- Los Angeles County population projected at +9% by 2050 — modest demand growth; plan on rents tracking national, not racing it.
Negotiation context
- It's been on market 123 days — a 12% lower offer ($590k) is reasonable based on typical stale-listing flexibility.
- 9 sale attempts since 2y ago with the ask held roughly flat each time — persistent listings suggest the price (not the market) is what's stuck; bring a comps-based counter.
Risks & watch-outs
- Watch-outs: built in 1910 — expect roof / HVAC / electrical / plumbing capex.
- Climate carrying-cost: moderate flood risk; extreme-heat days projected 6→18/yr by 2055 (HVAC capex compounding) — expect insurance premiums to compound above CPI over the hold.
Questions for the listing agent
- It's been on market 123 days. Have you received any prior offers? Is the seller open to a 12% concession, seller financing, or rate buy-down credit?
- Can we see the unit-by-unit rent roll, current vacancy, and any below-market leases? What's the average tenancy length?
- What capital expenditures (roof, boiler, parking lot, exteriors) have been made in the last 5 years, and what's planned in the next 2?
- Built in 1910 — when were the roof, HVAC, electrical panel, plumbing, and water heater last replaced?
- Why hasn't it sold? Are there any deal-killer items the seller is aware of (foundation, flood, title, zoning, code violations)?
- Is there a deadline driving the sale (1031 exchange, divorce, estate, relocation)? That informs how much negotiation room exists.
- Schools are D-rated, which usually means shorter tenancies and higher turnover. Who's the typical renter profile here, and what's been the actual vacancy rate?
- Crime grade is F in this area — have there been break-ins, vandalism, or insurance claims at this property in the last 3 years? What carrier currently insures it and at what premium?
- What's the average days-on-market for RENTAL listings here right now (not sales)? A rising rental-DOM trend means longer vacancies and softer asking-rent achievability than the comps imply.
- What's the recent tenant-quality profile in this submarket — average credit score on applications, eviction rate, late-payment / NSF rate, and stable-employment percentage? A property-management company in the area should have these aggregated.
- How much new apartment / multifamily construction is in the pipeline within 1–3 miles? Heavy new supply (>2% of stock underway) typically softens rents 12–24 months out; light construction supports rent growth.
Investment metrics
- 1% rule
- 1.05% ✓
- Cap rate
- 7.86%
- Cash-on-cash
- 5.59%
- DSCR
- 1.25
- GRM
- 7.9
CMA / ARV
- ARV (median comp)
- $1,100,451
- List price
- $670,000
- Delta
- -39.12%
- Verdict
- UNDERPRICED
- Comps
- 20 within 1.0 mi
Show comp detail 3 sales within ~0.75 mi
| Address | Dist | Beds/Ba | Sqft | Sold | Price | $/sf | Match |
|---|---|---|---|---|---|---|---|
| 2141 Echo Park Ave | 0.07mi | 2/2.0 | 1,381 (+8%) | 20mo | $1,068,000 | $773 | 68 |
| 2250 Glover Pl | 0.70mi | 2/2.0 | 1,344 (+5%) | 12mo | $835,000 | $621 | 49 |
| 2297 Glendale Blvd | 0.74mi | 3/2.0 (+1) | 1,372 (+7%) | 2mo | $1,100,000 | $802 | 47 |
Match score weights: distance 35% · size 25% · config 20% · recency 20%. Top-matched comps best support the ARV.
Projected returns pro-forma
-3.0% appreciation · 0.0% rent growth · sell at horizon
- IRR
- -11.1%
- Equity multiple
- 0.61×
- Total profit
- $-73,427
- Equity at exit
- $99,899
- IRR
- -6.9%
- Equity multiple
- 0.62×
- Total profit
- $-71,456
- Equity at exit
- $57,929
Cash invested: $187,600 (down + closing). Projections, not guarantees.
Landlord ↔ Tenant lean methodology
- Overall (CITY)
- 0 Strongly Tenant-Friendly
- State California
- 18 Strongly Tenant-Friendly · D+13
- County
- — inherits STATE
- City Los Angeles
- 0 Strongly Tenant-Friendly · D+22
ZIP-level market 90026
- Rents YoY
- -0.0%
- Active inventory
- 179
- Price-to-rent
- 15.9×
Monthly cashflow live
- Estimated rent
- $7,039 high interval (Pro) →
- Mortgage (P&I)
- −$3,514
- Tax from tax record
- −$895 /mo · $10,736/yr
- Insurance
- −$279
- HOA
- −$0
- Vacancy / Maint / Mgmt
- −$1,478
- Net cashflow
- $873
Break-even live
2-unit breakdown (identical units grouped — click to expand)
| Units | Beds | Baths | Est. rent |
|---|---|---|---|
| 2× units | 3 | 2 | $7,038 |
| #1 | 3 | 2 | $3,519 |
| #2 | 3 | 2 | $3,519 |
| Total (2 units) | $7,039 | ||
UW: 25.0% down · 7.5% · 30yr · 1.5% tax · 5.0% vac · 8.0% maint · 8.0% mgmt
Financing live
Cash to close
- Down payment
- $167,500
- Closing costs
- $20,100
- Reserves months
- —
- Total cash needed
- —
Loan-product check · same deal, 3 products live
Conventional
25% down · 7.5% · 30yr
- Down + closing
- —
- Monthly P&I
- —
- Monthly cashflow
- —
- DSCR
- —
- Eligible?
- —
Personal DTI + credit; lowest rate.
DSCR
20% down · 8.5% · 30yr
- Down + closing
- —
- Monthly P&I
- —
- Monthly cashflow
- —
- DSCR
- —
- Eligible?
- —
No personal income docs; deal must DSCR.
Hard money
10% down · 12.0% · 12mo
- Down + closing
- —
- Monthly P&I
- —
- Monthly cashflow
- —
- DSCR
- —
- Eligible?
- —
Short-term bridge; refi at stabilization.
Rent comps 40 comps
| Address | Beds | Baths | Sqft | Rent | $/sqft | DOM | Units | Dist |
|---|---|---|---|---|---|---|---|---|
| 2147 Baxter St Los Angeles, CA | 2.0 | 2.0 | 1100 | $2,900 | $2.64 | 43d | 1 | 0.44mi |
| 2102 Allesandro St Unit 2102 Los Angeles, CA | 2.0 | 2.0 | 1100 | $2,900 | $2.64 | 43d | 1 | 0.44mi |
| 2700 N Current Way Lincoln Heights, CA | 3.0 | 2.5 | 1727 | $6,105 | $3.54 | 43d | 1 | 0.54mi |
| 1771 Blake Ave Los Angeles, CA | 2.0–3.0 | 3.5 | 1582 | $4,755 | $3.00 | 3d | 25 | 0.55mi |
| 2412 Eads St Unit 7 Los Angeles, CA | 2.0 | 2.5 | 1346 | $4,500 | $3.34 | 43d | 1 | 0.57mi |
| 2412 Eads St Unit 2 Los Angeles, CA | 2.0 | 2.5 | 1080 | $4,700 | $4.35 | 43d | 1 | 0.57mi |
| 2720 N Cadence Way Los Angeles, CA | 3.0 | 3.5 | 1468 | $4,995 | $3.40 | 43d | 1 | 0.59mi |
| 2112 Glendale Blvd Los Angeles, CA | 2.0 | 1.0 | 900 | $3,195 | $3.55 | 43d | 1 | 0.59mi |
| 2671 Benedict St Los Angeles, CA | 2.0 | 2.0 | 966 | $3,995 | $4.14 | 43d | 1 | 0.59mi |
| 1805 W Bankside Way Los Angeles, CA | 2.0 | 3.5 | 1438 | $6,395 | $4.45 | 43d | 1 | 0.60mi |
| 2202 Edendale Ln Los Angeles, CA | 2.0 | 2.5 | 1307 | $4,500 | $3.44 | 43d | 1 | 0.61mi |
| 2705 Benedict St Los Angeles, CA | 2.0 | 2.0 | 960 | $4,550 | $4.74 | 19d | 1 | 0.62mi |
| 2705 Benedict St Los Angeles, CA | 2.0 | 2.0 | 960 | $4,550 | $4.74 | 14d | 1 | 0.62mi |
| 1855 Silent Era Dr Los Angeles, CA | 2.0 | 3.0 | 1332 | $4,750 | $3.57 | 43d | 1 | 0.64mi |
| 2204 Fox Ln Los Angeles, CA | 2.0 | 2.5 | 1307 | $5,488 | $4.20 | 7d | 1 | 0.64mi |
| 2205 Tom Mix Rd Los Angeles, CA | 2.0 | 2.5 | 1469 | $4,600 | $3.13 | 43d | 1 | 0.64mi |
| 1750 Glendale Blvd Los Angeles, CA | 2.0 | 1.0–2.0 | 792 | $3,795 | $4.79 | 3d | 1 | 0.65mi |
| 2335 Silver Ridge Ave Los Angeles, CA | 3.0 | 2.0 | 1858 | $7,700 | $4.14 | 43d | 1 | 0.66mi |
| 2217 Branden St Los Angeles, CA | 2.0 | 3.0 | 1307 | $4,495 | $3.44 | 16d | 1 | 0.67mi |
| 1626 Echo Park Ave Los Angeles, CA | 2.0 | 1.0 | 950 | $3,250 | $3.42 | 43d | 1 | 0.68mi |
| 1655 Allesandro St Los Angeles, CA | 1.0–2.0 | 1.0–2.0 | 960 | $3,950 | $4.11 | 2d | 12 | 0.75mi |
| 2305 Glendale Blvd Los Angeles, CA | 2.0 | 2.0 | 900 | $2,795 | $3.11 | 4d | 1 | 0.75mi |
| 2750 Denby Ave Los Angeles, CA | 3.0 | 2.0 | 1344 | $3,800 | $2.83 | 43d | 1 | 0.77mi |
| 2413 Hidalgo Ave Unit 1/2 Los Angeles, CA | 1.0 | 1.0 | 900 | $3,800 | $4.22 | 24d | 1 | 0.78mi |
| 1902 W Liberty Ct Los Angeles, CA | 3.0 | 2.5 | 1806 | $6,700 | $3.71 | 43d | 1 | 0.84mi |
| 2425 Silver Lake Blvd Los Angeles, CA | 2.0 | 1.0 | 920 | $2,995 | $3.26 | 24d | 1 | 0.88mi |
| 2228 Berkeley Ave Unit 2 Los Angeles, CA | 2.0 | 1.5 | 900 | $3,500 | $3.89 | 44d | 1 | 0.88mi |
| 2453 Silver Lake Blvd Los Angeles, CA | 2.0 | 1.0 | 909 | $2,795 | $3.07 | 43d | 1 | 0.89mi |
| 2240 India St Los Angeles, CA | 3.0 | 2.0 | 1450 | $4,350 | $3.00 | 43d | 1 | 0.91mi |
| 1421 N Alvarado St Los Angeles, CA | 2.0 | 1.5 | 1036 | $4,795 | $4.63 | 7d | 1 | 0.98mi |
| 2417 Mayberry St Los Angeles, CA | 2.0 | 1.0 | 900 | $4,000 | $4.44 | 43d | 1 | 0.98mi |
| 1416 Fairbanks Pl Los Angeles, CA | 2.0 | 1.0 | 960 | $5,400 | $5.62 | 14d | 1 | 0.99mi |
| 1520 N Coronado St Los Angeles, CA | 1.0 | 2.0 | 1300 | $4,200 | $3.23 | 43d | 1 | 1.00mi |
| 1806 Montana St Unit 1814 Los Angeles, CA | 3.0 | 1.5 | 1248 | $4,800 | $3.85 | 43d | 1 | 1.02mi |
| 2980 Allesandro St Unit 210 Los Angeles, CA | 3.0 | 2.0 | 1338 | $4,195 | $3.14 | 2d | 1 | 1.03mi |
| 2320 Fernleaf St Los Angeles, CA | 2.0 | 2.0 | 975 | $4,400 | $4.51 | 19d | 1 | 1.04mi |
| 2320 Fernleaf St Los Angeles, CA | 2.0 | 2.0 | 975 | $4,400 | $4.51 | 7d | 1 | 1.04mi |
| 1330 Liberty St Unit 5 Los Angeles, CA | 2.0 | 1.0 | 900 | $2,291 | $2.55 | 5d | 1 | 1.04mi |
| 2318 Fernleaf St Unit 2320 Los Angeles, CA | 2.0 | 2.0 | 975 | $4,400 | $4.51 | 5d | 1 | 1.05mi |
| 1411 Mohawk St Los Angeles, CA | 3.0 | 2.0 | 1120 | $4,495 | $4.01 | 43d | 1 | 1.06mi |
Listing history 24 events
-
2026-06-09days on market $670,000 Active 123 DOM
-
2026-06-08days on market $670,000 Active 122 DOM
-
2026-06-07days on market $670,000 Active 121 DOM
-
2026-06-04days on market $670,000 Active 118 DOM
-
2026-06-03days on market $670,000 Active 117 DOM
-
2026-06-02days on market $670,000 Active 116 DOM
-
2026-06-01days on market $670,000 Active 115 DOM
-
2026-05-31days on market $670,000 Active 114 DOM
-
2026-02-06$670,000 Active 317-char remark
Show marketing remark (317 chars)
Duplex in Echo Park—Ideal for Investment or Owner-occupied. Downstairs unit offers 2 beds/1 bath; upstairs unit features 1 bed/1 bath with a private balcony. Located near Echo Park Lake, Elysian Park trails, and the recreation center. Convenient access to major freeways and less than 10 miles from Downtown LA.
-
2025-06-28price $675,000
-
2025-06-28status Active
-
2025-06-11status Pending Sale
-
2025-03-27price $800,000
-
2025-01-16$850,000 Active
-
2025-01-15historical
-
2024-10-28historical
-
2024-09-20status Active
-
2024-08-27status Pending Sale
-
2024-07-28status Active
-
2024-06-19status Pending Sale
-
2024-06-16status Active
-
2024-06-15status Active
-
2024-06-14status Active
-
2024-05-17$700,000 Active
ⓘ Source: listings_history table (triggers on properties + properties_extension) + one-shot
backfill from property_details.listing_events for pre-trigger history.
Tax reassessment forecast CA · Resets to sale price
- Current annual tax
- $10,736 · $895/mo
- Projected year-2 tax
- $10,736 · $895/mo
- Expected delta
- $0/yr ($0/mo · 0.0%)
ⓘ Screening estimate from a state-policy table — verify with the county assessor before closing.
Climate risk First Street
- Flood 5/10 Major FEMA zone X (unshaded) · 24% chance over 30 yrs
- Wildfire 2/10 Low
- Heat 5/10 Major 6 d/yr ≥94°F today · 18 d/yr by 30 yrs out
- Wind 1/10 Low
- Air quality 6/10 Major 11 unhealthy d/yr today · 12 by 30 yrs out
Nearby sold comps map
Loading sold comps map…
Walkable amenities ~0.75 mi
Loading nearby amenities…
Taxation est. · year 1
- Rental income
- $84,468
- − Mortgage interest
- −$37,530
- − Property taxes
- −$10,736
- − Insurance
- −$3,350
- − Repairs & maintenance
- −$6,757
- − Management
- −$6,757
- − Depreciation
- −$19,491
- Taxable loss
- −$154
- Est. tax savings @ 24.0%
- +$37
- After-tax cash flow
- $10,518/yr
For passive investors: Depreciation is non-cash, so a rental often shows a tax loss while cash-flowing — sheltering income. Rental losses are passive: they offset passive income freely, and up to $25,000/yr can offset ordinary (W-2) income if you actively participate and your MAGI is under $100k (phasing out to $0 by $150k); unused losses carry forward. On sale, claimed depreciation is recaptured at up to 25%, and gains may owe capital-gains tax (a 1031 exchange can defer both). Figures are a year-1 estimate at your 24.0% rate — not tax advice; consult a CPA.
Schools (NCES district)
- District
- Los Angeles Unified
- NCES district ID
- 0622710
- Math proficiency
- 29% ▼ -4.00%
- Reading proficiency
- 54% ▲ 10.00%
- Median HH income
- $50,403
- Composite
- 35.67/100
- National rank
- #4875
- State rank
- #223 of 517 in CA
Livability — Los Angeles
- Score
- 68/100
- State rank
- #273
- US rank
- #9237
Category grades
Schools grade is shown separately in the Schools card above.
Census & demographics
- Census place
- Los Angeles, CA
- County
- Los Angeles County · 9,444,647 people
- City population
- 3,838,149
- Metro
- Los Angeles-Long Beach-Anaheim, CA
- Population (ZIP)
- 62,692
- Household income
- $87,334
- Rent vs Own
- Severe rent burden
- 4974.0
Population outlook (Los Angeles County) Hauer SSP2
- Today (2025)
- 10,940,515 people
- By 2030
- 11,256,481 · +2.9%
- By 2040
- 11,729,929 · +7.2%
- By 2050
- 11,948,407 · +9.2%
- By 2075
- 11,818,114 · +8.0%
- By 2100
- 10,842,928 · -0.9%
Race, ethnicity, and origin ACS 2023
- Neighborhood character
- Diverse neighborhood (Simpson 0.67)
- Race & ethnicity
- Hispanic / Latino 46% White 31% Asian 13% Two or more races 13% Black 4% Native American 1%
- Hispanic origin (detail)
- Mexican 26%
- Common ancestry
- Lithuanian 2% Italian 2% Romanian 1%
- Foreign-born
- 34% · Canada, China, South Korea
- Languages at home
- 47% English-only · Spanish 39% Tagalog/Filipino 5% Chinese 2%
Political lean MEDSL · Los Angeles
- 2024 margin
- Solid D (+32.9) · D 64.8% · R 31.9% · Other 3.3%
- 2008→2024 swing
- -7.4pp toward R · 2008: 40.4pp · 2024: 32.9pp
- All cycles
- 2024: D+32.9 2020: D+44.2 2016: D+48.0 2012: D+40.0 2008: D+40.4
Not yet ingested
- Civics
- —
Market trends
- HPI YoY
- ▼ -1087.70%
- Current HPI
- 456.3465
- Rent YoY
- ▬ -0.01%
- Metro
- Los Angeles-Long Beach-Anaheim, CA
- State GDP YoY
- ▲ 3.21%
- F500 in state
- 116
Industry mix (Fortune 500 HQ in CA)
| Industry | F500 HQs | Revenue |
|---|---|---|
| Technology | 27 | $1,492B |
|
||
| Financial Services | 3 | $174B |
|
||
| Retail | 3 | $44B |
|
||
| Insurance | 3 | $26B |
|
||
| Media / Entertainment | 2 | $115B |
|
||
| Pharmaceuticals / Biotech | 2 | $62B |
|
||
Price history
-4.3% since first listed16 events — show timeline
- 2026-02-06 Listed $670,000 CRMLS
- 2025-06-28 Price Changed $675,000 CRMLS
- 2025-06-28 Relisted — CRMLS
- 2025-06-11 Pending — CRMLS
- 2025-03-27 Price Changed $800,000 CRMLS
- 2025-01-16 Listed $850,000 CRMLS
- 2025-01-15 Coming Soon — CRMLS
- 2024-10-28 Listing Removed — CRMLS
- 2024-09-20 Relisted — CRMLS
- 2024-08-27 Pending — CRMLS
- 2024-07-28 Relisted — CRMLS
- 2024-06-19 Pending — CRMLS
- 2024-06-16 Relisted — CRMLS
- 2024-06-15 Relisted — CRMLS
- 2024-06-14 Relisted — CRMLS
- 2024-05-17 Listed $700,000 CRMLS
Property tax history
+23.0%/yrLatest (2025): $10,736 · +2454.9% YoY. Source: county tax records.
Cash-flow waterfall
monthlySold comps — $/sqft
last 12 mo · ≤1 miLoading sold comps…