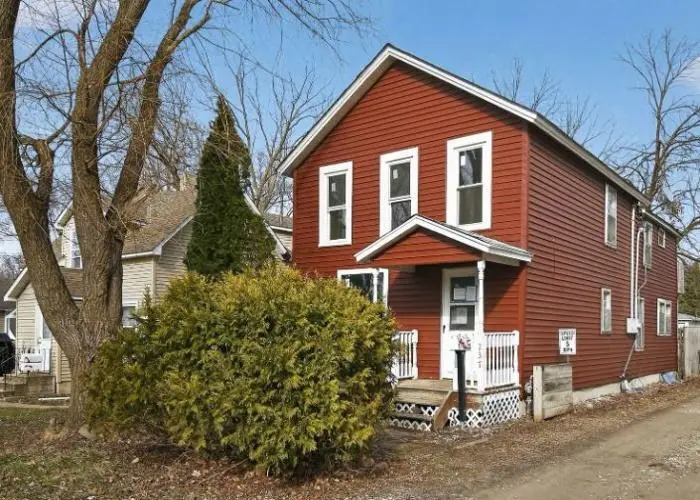
237 Linden Ave · Owatonna, MN
Flood risk 1/10 · Minimal
- FEMA flood zone
- X (unshaded)
- Chance of flooding over 30 yrs
- 0.0%
- Est. flood insurance / yr
- $507 – $1,088
Fire risk 1/10 · Minimal
- Est. fire insurance / yr
- $888 – $1,650
Heat risk 2/10 · Minimal
- Hot days now (above 101°F)
- 7 days/yr
- Hot days in 30 yrs
- 15 days/yr
Wind risk 2/10 · Minimal
- Chance of severe wind over 30 yrs
- —
Air-quality risk 1/10 · Minimal
- Unhealthy air days now
- 0 days/yr
- Unhealthy air days in 30 yrs
- 0 days/yr
Risk factors via First Street. Map © Google.
Why this score? — see what drove the B- grade
The composite is a weighted blend of 9 inputs, each scored 0–100. Each bar is that input's sub-score; the figure is the points it added to the 100-point composite (weight × sub-score).
- Cash flow +30.0/30.0
- DSCR +10.0/10.0
- 1% rule +9.0/10.0
- ARV discount +7.5/15.0
- Livability +3.8/5.0
- Schools +3.7/10.0
- Rent growth +2.5/5.0
- Condition / age +2.5/5.0
- Appreciation +0.0/10.0
$95,400
🖨 Deal sheet 📄 Offer letter ✓ Due diligence
Listing remarks
Great opportunity to buy this two story fixer upper located in Owatanna, MN and sititng on a 41x128 lot. The interior has 1314 sq. ft with 3 bedrooms and 1.5 bathrooms and a basement. Caution possible mold in home.
Key facts
- Basement
- 41x128 lot
- Two story
Tags
Neighborhood map
What this means for you Summary
Snapshot
- This is a 3-bed/2.0-bath single-family listed at $95k.
Deal economics
- At list price, monthly cash flow is $414 ($5k/yr) — positive.
- The deal already cash-flows at list — no discount required.
- Meets the 1% rule at list price ($1k rent vs $95k).
- Cap rate 11.5% vs local median 3.2% in Owatonna — top-decile yield for the area; either an underpriced asset or a hidden risk that comps aren't pricing in. Stress-test before assuming the spread holds.
Location & tenants
- Location reads 76/100 on livability (#155 in MN, #3,413 nationally) — a middle-class / working-renter tenant base. Strengths: cost of living A+, housing A+, crime A; Watch: amenities D-, commute F, health & safety D-.
- Owatonna Public School District (town): math 38% / reading 47% proficiency, ranked #194 of 301 in MN (top 64%) — families likely to look elsewhere, expect single-tenant / working-renter base with shorter leases.
- Market conditions: 224 active listings in the ZIP; 3 comparable units currently listed for rent nearby; rentals lingering (median 44d on market — plan ~5-8 weeks vacancy on turnover, expect pricing pressure); 100% of comp listings sitting > 30 days — soft ceiling on asking rent; solid renter incomes; 28 units permitted in Steele County in 2024 (0 in 5+ unit buildings).
Forward outlook
- Local home prices are declining (-3.0%/yr); year-one equity from $660 of loan paydown is wiped out by about $3k of value loss. Plan a longer hold.
- Steele County population projected to shrink 10% by 2050 — rents likely to lag national; underwrite the cash flow, not the appreciation.
- At projected returns (-3.0% appreciation + 3.0% rent growth), your $27k cash investment doubles in ~7 years — after that, you're playing with house money.
Negotiation context
- Only 10 days on market — expect competitive offers; lowballing is unlikely to land.
Risks & watch-outs
- Watch-outs: built in 1900 — expect roof / HVAC / electrical / plumbing capex.
Questions for the listing agent
- Built in 1900 — when were the roof, HVAC, electrical panel, plumbing, and water heater last replaced?
- Is there a deadline driving the sale (1031 exchange, divorce, estate, relocation)? That informs how much negotiation room exists.
- Schools are B-rated — typically a magnet for longer-tenancy family renters. What's the average tenant stay here, and is there a school-zone premium baked into asking?
- What's the average days-on-market for RENTAL listings here right now (not sales)? A rising rental-DOM trend means longer vacancies and softer asking-rent achievability than the comps imply.
- What's the recent tenant-quality profile in this submarket — average credit score on applications, eviction rate, late-payment / NSF rate, and stable-employment percentage? A property-management company in the area should have these aggregated.
- How much new for-sale + rental construction is in the pipeline within 1–3 miles? Heavy new supply typically softens prices + rents 12–24 months out; constrained supply supports both.
Investment metrics
- 1% rule
- 1.40% ✓
- Cap rate
- 11.50%
- Cash-on-cash
- 18.59%
- DSCR
- 1.83
- GRM
- 5.9
CMA / ARV
No comps found within radius.
Projected returns pro-forma
-3.0% appreciation · 3.0% rent growth · sell at horizon
- IRR
- 10.3%
- Equity multiple
- 1.41×
- Total profit
- $10,907
- Equity at exit
- $14,224
- IRR
- 19.4%
- Equity multiple
- 2.63×
- Total profit
- $43,478
- Equity at exit
- $8,248
Cash invested: $26,712 (down + closing). Projections, not guarantees.
Landlord ↔ Tenant lean methodology
- Overall (STATE)
- 46 Balanced
- State Minnesota
- 46 Balanced · D+2
- County
- — inherits STATE
- City
- — inherits STATE
ZIP-level market 55060
- Home prices YoY
- -30.5%
- Active inventory
- 224
- Price-to-rent
- 5.9×
Monthly cashflow live
- Estimated rent
- $1,339 medium interval (Pro) →
- Mortgage (P&I)
- −$500
- Tax from tax record
- −$104 /mo · $1,248/yr
- Insurance
- −$40
- HOA
- −$0
- Vacancy / Maint / Mgmt
- −$281
- Net cashflow
- $414
Break-even live
UW: 25.0% down · 7.5% · 30yr · 1.5% tax · 5.0% vac · 8.0% maint · 8.0% mgmt
Financing live
Cash to close
- Down payment
- $23,850
- Closing costs
- $2,862
- Reserves months
- —
- Total cash needed
- —
Loan-product check · same deal, 3 products live
Conventional
25% down · 7.5% · 30yr
- Down + closing
- —
- Monthly P&I
- —
- Monthly cashflow
- —
- DSCR
- —
- Eligible?
- —
Personal DTI + credit; lowest rate.
DSCR
20% down · 8.5% · 30yr
- Down + closing
- —
- Monthly P&I
- —
- Monthly cashflow
- —
- DSCR
- —
- Eligible?
- —
No personal income docs; deal must DSCR.
Hard money
10% down · 12.0% · 12mo
- Down + closing
- —
- Monthly P&I
- —
- Monthly cashflow
- —
- DSCR
- —
- Eligible?
- —
Short-term bridge; refi at stabilization.
Rent comps 3 comps
| Address | Beds | Baths | Sqft | Rent | $/sqft | DOM | Units | Dist |
|---|---|---|---|---|---|---|---|---|
| 236 E Rose St Unit 236 1/2 Owatonna, MN | 2.0 | 1.0 | 900 | $1,100 | $1.22 | 43d | 1 | 0.55mi |
| 312 Riverside Ave Unit 1 Owatonna, MN | 2.0 | 1.0 | 1000 | $1,300 | $1.30 | 43d | 1 | 1.02mi |
| 592 Adams Ave NW Owatonna, MN | 4.0 | 1.0 | 1100 | $1,700 | $1.55 | 43d | 1 | 1.24mi |
Listing history 2 events
-
2026-04-27status Pending
-
2026-04-17$95,400 Active
ⓘ Source: listings_history table (triggers on properties + properties_extension) + one-shot
backfill from property_details.listing_events for pre-trigger history.
Tax reassessment forecast MN · Partial reset (capped growth)
- Current annual tax
- $1,248 · $104/mo
- Projected year-2 tax
- $1,248 · $104/mo
- Expected delta
- $0/yr ($0/mo · 0.0%)
ⓘ Screening estimate from a state-policy table — verify with the county assessor before closing.
Climate risk First Street
- Flood 1/10 Low FEMA zone X (unshaded) · 0% chance over 30 yrs
- Wildfire 1/10 Low
- Heat 2/10 Low 7 d/yr ≥101°F today · 15 d/yr by 30 yrs out
- Wind 2/10 Low
- Air quality 1/10 Low 0 unhealthy d/yr today · 0 by 30 yrs out
Nearby sold comps map
Loading sold comps map…
Walkable amenities ~0.75 mi
Loading nearby amenities…
Taxation est. · year 1
- Rental income
- $16,068
- − Mortgage interest
- −$5,344
- − Property taxes
- −$1,248
- − Insurance
- −$477
- − Repairs & maintenance
- −$1,285
- − Management
- −$1,285
- − Depreciation
- −$2,775
- Taxable income
- $3,653
- Est. tax owed @ 24.0%
- −$877
- After-tax cash flow
- $4,089/yr
For passive investors: Depreciation is non-cash, so a rental often shows a tax loss while cash-flowing — sheltering income. Rental losses are passive: they offset passive income freely, and up to $25,000/yr can offset ordinary (W-2) income if you actively participate and your MAGI is under $100k (phasing out to $0 by $150k); unused losses carry forward. On sale, claimed depreciation is recaptured at up to 25%, and gains may owe capital-gains tax (a 1031 exchange can defer both). Figures are a year-1 estimate at your 24.0% rate — not tax advice; consult a CPA.
Schools (NCES district)
- District
- Owatonna Public School District
- NCES district ID
- 2728050
- Math proficiency
- 38% ▼ -12.00%
- Reading proficiency
- 47% ▼ -7.00%
- Median HH income
- $56,373
- Composite
- 37.14/100
- National rank
- #4487
- State rank
- #194 of 301 in MN
Livability — Owatonna
- Score
- 76/100
- State rank
- #155
- US rank
- #3413
Category grades
Schools grade is shown separately in the Schools card above.
Census & demographics
- Census place
- Owatonna, MN
- County
- Steele County · 29,599 people
- City population
- 29,599
- Metro
- Owatonna, MN
- Population (ZIP)
- 29,599
- Household income
- $84,906
- Rent vs Own
- Severe rent burden
- 598.0
Population outlook (Steele County) Hauer SSP2
- Today (2025)
- 36,618 people
- By 2030
- 36,195 · -1.2%
- By 2040
- 34,882 · -4.7%
- By 2050
- 33,052 · -9.7%
- By 2075
- 29,692 · -18.9%
- By 2100
- 25,581 · -30.1%
Race, ethnicity, and origin ACS 2023
- Neighborhood character
- Predominantly White (84%)
- Race & ethnicity
- White 84% Hispanic / Latino 8% Two or more races 5% Black 4%
- Hispanic origin (detail)
- Mexican 7%
- Common ancestry
- Portuguese 16% Romanian 3% Italian 2%
- Foreign-born
- 5% · Canada, South Korea
- Languages at home
- 93% English-only · Spanish 4%
Political lean MEDSL · Steele
- 2024 margin
- Strong R (+24.5) · D 36.8% · R 61.2% · Other 2.0%
- 2008→2024 swing
- -19.1pp toward R · 2008: -5.3pp · 2024: -24.5pp
- All cycles
- 2024: R+24.5 2020: R+22.4 2016: R+26.0 2012: R+6.3 2008: R+5.3
Not yet ingested
- Civics
- —
Market trends
- HPI YoY
- ▼ -92.54%
- Current HPI
- 211.0177
- Rent YoY
- —
- Metro
- Owatonna, MN
- State GDP YoY
- ▲ 2.41%
- F500 in state
- 34
Industry mix (Fortune 500 HQ in MN)
| Industry | F500 HQs | Revenue |
|---|---|---|
| Healthcare | 2 | $407B |
|
||
| Retail | 2 | $150B |
|
||
| Consumer Goods | 2 | $32B |
|
||
| Industrial Machinery | 2 | $6B |
|
||
| Agriculture | 1 | $40B |
|
||
| Healthcare / Medical Devices | 1 | $32B |
|
||
Price history
2 events — show timeline
- 2026-04-27 Pending — NORTHSTARMLS as Distributed by MLS Grid
- 2026-04-17 Listed $95,400 NORTHSTARMLS as Distributed by MLS Grid
Property tax history
+8.0%/yrLatest (2025): $1,248 · +38.1% YoY. Source: county tax records.
Cash-flow waterfall
monthlySold comps — $/sqft
last 12 mo · ≤1 miLoading sold comps…