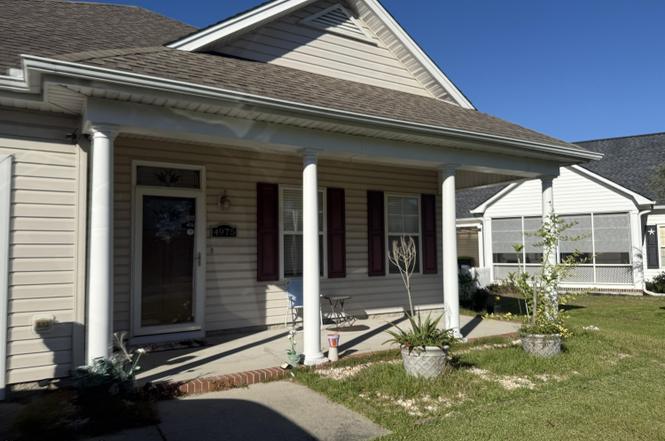
4975 N Hampton Dr SE · Oak Island, NC
Flood risk 1/10 · Minimal
- FEMA flood zone
- X (unshaded)
- Chance of flooding over 30 yrs
- 0.0%
- Est. flood insurance / yr
- $507 – $1,088
Fire risk 4/10 · Minor
- Est. fire insurance / yr
- $906 – $1,684
Heat risk 10/10 · Severe
- Hot days now (above 104°F)
- 7 days/yr
- Hot days in 30 yrs
- 20 days/yr
Wind risk 9/10 · Severe
- Chance of severe wind over 30 yrs
- 99.0%
Air-quality risk 2/10 · Minimal
- Unhealthy air days now
- 1 days/yr
- Unhealthy air days in 30 yrs
- 1 days/yr
Risk factors via First Street. Map © Google.
Why this score? — see what drove the D- grade
The composite is a weighted blend of 9 inputs, each scored 0–100. Each bar is that input's sub-score; the figure is the points it added to the 100-point composite (weight × sub-score).
- Cash flow +12.3/30.0
- ARV discount +6.6/15.0
- Schools +3.9/10.0
- DSCR +3.6/10.0
- Livability +3.4/5.0
- 1% rule +2.9/10.0
- Rent growth +2.7/5.0
- Condition / age +2.5/5.0
- Appreciation +0.0/10.0
$255,000
🖨 Deal sheet (PDF) 📄 Offer letter ✓ Due diligence
Listing remarks
This Pelican model is for the young at heart. A gigantic great room for special entertaining, & a super sized master bedroom with walk in closet. All this is attainable within a short drive to the Oak Island beaches and historic Southport NC. Carolina Place offers a community pool, a crab dock and boat & RV storage.
Key facts
- Community pool
- Boat storage
- Master bedroom
Tags
Neighborhood map
What this means for you Summary
Snapshot
- This is a 3-bed/2.0-bath single-family listed at $255k.
Deal economics
- At list price, monthly cash flow is $-47 ($-562/yr) — negative.
- To cash-flow at today's rent, offer at most $247k (3.2% below list).
- To meet the 1% rule (rent ≥ 1% of price), the offer needs to be $201k (21.1% below list).
- Recommended offer: $201k (21.1% below list) — sets the bar for 1% rule.
- Cap rate 6.1% vs local median 2.8% in Oak Island — top-decile yield for the area; either an underpriced asset or a hidden risk that comps aren't pricing in. Stress-test before assuming the spread holds.
Location & tenants
- Location reads 67/100 on livability (#233 in NC) — a middle-class / working-renter tenant base. Strengths: crime A+, housing A+, employment A; Watch: health & safety D, amenities F, commute F.
- Brunswick County Schools (rural): math 45% / reading 47% proficiency, ranked #82 of 178 in NC (top 46%) — families likely to look elsewhere, expect single-tenant / working-renter base with shorter leases.
- Zoned schools: Southport Elementary (math 59% / reading 56%, grade C+, #245 of 1,410 statewide, top 18%, 403 students, 99% FRL); South Brunswick Middle (math 41% / reading 49%, grade D, #160 of 475 statewide, top 35%, 572 students, 100% FRL); South Brunswick High (math 62% / reading 57%, grade C+, #216 of 535 statewide, top 43%, 1,172 students, 100% FRL) — zoned schools average 100% FRL vs 53% district-wide (46 pts higher); higher-poverty schools than district average — tighter screening recommended.
- Market conditions: Rents flat; 884 active listings in the ZIP; solid renter incomes; 6,112 units permitted in Brunswick County in 2024 (990 in 5+ unit buildings).
Forward outlook
- Local home prices are declining (-3.0%/yr); year-one equity from $2k of loan paydown is wiped out by about $8k of value loss. Plan a longer hold.
- Brunswick County population projected at +36% by 2050 — long-run rental-demand tailwind backs the buy-and-hold thesis.
Negotiation context
- It's been on market 174 days — a 12% lower offer ($224k) is reasonable based on typical stale-listing flexibility.
- 3 sale attempts since 24y ago; this cycle's ask is 725% above the opening price — seller raised mid-cycle; expect resistance to lowballs.
Risks & watch-outs
- Climate carrying-cost: severe wind risk, 99% chance of damaging wind over 30y; extreme-heat days projected 7→20/yr by 2055 (HVAC capex compounding) — expect insurance premiums to compound above CPI over the hold.
Questions for the listing agent
- What do current leases actually rent for vs. the listed asking? Can we see a recent rent roll and the last 12 months of T-12 income?
- It's been on market 174 days. Have you received any prior offers? Is the seller open to a 21% concession, seller financing, or rate buy-down credit?
- What does the HOA fee cover, when was the last increase, and are there any pending special assessments or reserve-fund shortfalls?
- Why hasn't it sold? Are there any deal-killer items the seller is aware of (foundation, flood, title, zoning, code violations)?
- Is there a deadline driving the sale (1031 exchange, divorce, estate, relocation)? That informs how much negotiation room exists.
- Schools are D-rated, which usually means shorter tenancies and higher turnover. Who's the typical renter profile here, and what's been the actual vacancy rate?
- The area grade is low — what's the realistic commute time and amenity access for the typical tenant pool here? Any planned neighborhood developments (good or bad) we should know about?
- What's the average days-on-market for RENTAL listings here right now (not sales)? A rising rental-DOM trend means longer vacancies and softer asking-rent achievability than the comps imply.
- What's the recent tenant-quality profile in this submarket — average credit score on applications, eviction rate, late-payment / NSF rate, and stable-employment percentage? A property-management company in the area should have these aggregated.
- How much new for-sale + rental construction is in the pipeline within 1–3 miles? Heavy new supply typically softens prices + rents 12–24 months out; constrained supply supports both.
Investment metrics
- 1% rule
- 0.79% ✗
- Cap rate
- 6.07%
- Cash-on-cash
- -0.79%
- DSCR
- 0.96
- GRM
- 10.6
CMA / ARV
- ARV (on-the-fly)
- $249,956
- Comps found
- 5
Show comp detail 5 sales within ~0.75 mi
| Address | Dist | Beds/Ba | Sqft | Sold | Price | $/sf | Match |
|---|---|---|---|---|---|---|---|
| 4943 N Hampton Dr SE | 0.07mi | 3/2.0 | 1,193 (+8%) | 5mo | $270,000 | $226 | 80 |
| 5005 N Hampton Dr SE | 0.07mi | 3/2.0 | 1,067 (-4%) | 21mo | $225,000 | $211 | 74 |
| 4537 Fleetwood Dr SE | 0.11mi | 3/2.0 | 1,259 (+14%) | 3mo | $265,000 | $210 | 69 |
| 4412 Flagship Ave SE | 0.37mi | 2/2.0 (-1) | 1,020 (-8%) | 9mo | $255,000 | $250 | 58 |
| 4430 Spinnaker St SE | 0.45mi | 3/2.0 | 1,251 (+13%) | 2mo | $290,000 | $232 | 56 |
Match score weights: distance 35% · size 25% · config 20% · recency 20%. Top-matched comps best support the ARV.
Projected returns pro-forma
-3.0% appreciation · 0.74% rent growth · sell at horizon
- IRR
- -20.0%
- Equity multiple
- 0.32×
- Total profit
- $-48,828
- Equity at exit
- $38,021
- IRR
- -18.3%
- Equity multiple
- 0.10×
- Total profit
- $-64,104
- Equity at exit
- $22,048
Cash invested: $71,400 (down + closing). Projections, not guarantees.
Landlord ↔ Tenant lean methodology
- Overall (STATE)
- 85 Strongly Landlord-Friendly
- State North Carolina
- 85 Strongly Landlord-Friendly · R+3
- County
- — inherits STATE
- City
- — inherits STATE
ZIP-level market 28461
- Rents YoY
- 0.7%
- Active inventory
- 884
- Price-to-rent
- 10.6×
Monthly cashflow live
- Estimated rent
- $2,013 medium interval (Pro) →
- Mortgage (P&I)
- −$1,337
- Tax from tax record
- −$105 /mo · $1,265/yr
- Insurance
- −$106
- HOA
- −$88
- Vacancy / Maint / Mgmt
- −$423
- Net cashflow
- $-47
Break-even live
Sensitivity live
| Price | -10% $97 | -5% $25 | +0% $-47 | +5% $-119 | +10% $-191 |
|---|---|---|---|---|---|
| Rent | -10% $-206 | -5% $-126 | +0% $-47 | +5% $33 | +10% $112 |
| Rate | -1.0pp $82 | -0.5pp $18 | base $-47 | +0.5pp $-113 | +1.0pp $-180 |
UW: 25.0% down · 7.5% · 30yr · 1.5% tax · 5.0% vac · 8.0% maint · 8.0% mgmt
Financing live
Cash to close
- Down payment
- $63,750
- Closing costs
- $7,650
- Reserves months
- —
- Total cash needed
- —
Loan-product check · same deal, 3 products live
Conventional
25% down · 7.5% · 30yr
- Down + closing
- —
- Monthly P&I
- —
- Monthly cashflow
- —
- DSCR
- —
- Eligible?
- —
Personal DTI + credit; lowest rate.
DSCR
20% down · 8.5% · 30yr
- Down + closing
- —
- Monthly P&I
- —
- Monthly cashflow
- —
- DSCR
- —
- Eligible?
- —
No personal income docs; deal must DSCR.
Hard money
10% down · 12.0% · 12mo
- Down + closing
- —
- Monthly P&I
- —
- Monthly cashflow
- —
- DSCR
- —
- Eligible?
- —
Short-term bridge; refi at stabilization.
HOA detail
- Monthly dues
- $88 · $1,056/yr
- Likely covers
- pool
Listing history 13 events
-
2026-04-13status Pending
-
2026-04-11price $255,000
-
2026-02-24status Active
-
2026-02-21status Pending
-
2026-02-15price $275,000
-
2026-01-08price $290,000
-
2025-10-17price $309,000
-
2025-10-17$30,900 Active
-
2021-07-27soldstatus $235,000
-
2021-05-25soldstatus $190,000
-
2003-09-01soldstatus $119,000
-
2003-01-13historical
-
2002-03-15$124,900
ⓘ Source: listings_history table (triggers on properties + properties_extension) + one-shot
backfill from property_details.listing_events for pre-trigger history.
Tax reassessment forecast NC · Resets to sale price
- Current annual tax
- $1,265 · $105/mo
- Projected year-2 tax
- $2,091 · $174/mo
- Expected delta
- +$826/yr (+$69/mo · 65.3%)
ⓘ Screening estimate from a state-policy table — verify with the county assessor before closing.
Climate risk First Street
- Flood 1/10 Low FEMA zone X (unshaded) · 0% chance over 30 yrs
- Wildfire 4/10 Moderate
- Heat 10/10 Extreme 7 d/yr ≥104°F today · 20 d/yr by 30 yrs out
- Wind 9/10 Extreme 99% chance of damaging wind over 30 yrs
- Air quality 2/10 Low 1 unhealthy d/yr today · 1 by 30 yrs out
Nearby sold comps map
Loading sold comps map…
Walkable amenities ~0.75 mi
Loading nearby amenities…
Taxation est. · year 1
- Rental income
- $24,153
- − Mortgage interest
- −$14,284
- − Property taxes
- −$1,265
- − Insurance
- −$1,275
- − Repairs & maintenance
- −$1,932
- − Management
- −$1,932
- − HOA
- −$1,056
- − Depreciation
- −$7,418
- Taxable loss
- −$5,010
- Est. tax savings @ 24.0%
- +$1,202
- After-tax cash flow
- $640/yr
For passive investors: Depreciation is non-cash, so a rental often shows a tax loss while cash-flowing — sheltering income. Rental losses are passive: they offset passive income freely, and up to $25,000/yr can offset ordinary (W-2) income if you actively participate and your MAGI is under $100k (phasing out to $0 by $150k); unused losses carry forward. On sale, claimed depreciation is recaptured at up to 25%, and gains may owe capital-gains tax (a 1031 exchange can defer both). Figures are a year-1 estimate at your 24.0% rate — not tax advice; consult a CPA.
Schools (NCES district)
- District
- Brunswick County Schools
- NCES district ID
- 3700420
- Math proficiency
- 45% ▲ 4.00%
- Reading proficiency
- 47% ▲ 4.00%
- Median HH income
- $47,494
- Composite
- 39.23/100
- National rank
- #4011
- State rank
- #82 of 178 in NC
Livability — Oak Island
- Score
- 67/100
- State rank
- #233
- US rank
- #10757
Category grades
Schools grade is shown separately in the Schools card above.
Census & demographics
- County
- Brunswick County · 131,536 people
- Metro
- Myrtle Beach-Conway-North Myrtle Beach, SC-NC
- Population (ZIP)
- 23,762
- Household income
- $82,692
- Rent vs Own
- Severe rent burden
- 161.0
Population outlook (Brunswick County) Hauer SSP2
- Today (2025)
- 152,111 people
- By 2030
- 165,705 · +8.9%
- By 2040
- 188,494 · +23.9%
- By 2050
- 206,228 · +35.6%
- By 2075
- 237,876 · +56.4%
- By 2100
- 251,451 · +65.3%
Race, ethnicity, and origin ACS 2023
- Neighborhood character
- Predominantly White (89%)
- Race & ethnicity
- White 89% Two or more races 6% Black 4% Hispanic / Latino 3%
- Common ancestry
- Romanian 4% Slovak 3% Serbian 3%
- Foreign-born
- 3% · Canada
- Languages at home
- 96% English-only · Spanish 2%
Political lean MEDSL · Brunswick
- 2024 margin
- Strong R (+24.9) · D 37.2% · R 62.0%
- 2008→2024 swing
- -6.9pp toward R · 2008: -17.9pp · 2024: -24.9pp
- All cycles
- 2024: R+24.9 2020: R+25.0 2016: R+28.7 2012: R+22.2 2008: R+17.9
Not yet ingested
- Civics
- —
Market trends
- HPI YoY
- ▼ -195.19%
- Current HPI
- 142.5667
- Rent YoY
- ▲ 0.74%
- Metro
- Myrtle Beach-Conway-North Myrtle Beach, SC-NC
- State GDP YoY
- ▲ 3.28%
- F500 in state
- 26
Industry mix (Fortune 500 HQ in NC)
| Industry | F500 HQs | Revenue |
|---|---|---|
| Financial Services | 2 | $213B |
|
||
| Retail | 2 | $95B |
|
||
| Industrial Conglomerate | 1 | $38B |
|
||
| Metals / Steel | 1 | $35B |
|
||
| Utilities | 1 | $30B |
|
||
| Industrial Machinery | 1 | $19B |
|
||
Price history
+104.2% since first listed13 events — show timeline
- 2026-04-13 Pending — Hive MLS
- 2026-04-11 Price Changed $255,000 Hive MLS
- 2026-02-24 Relisted — Hive MLS
- 2026-02-21 Pending — Hive MLS
- 2026-02-15 Price Changed $275,000 Hive MLS
- 2026-01-08 Price Changed $290,000 Hive MLS
- 2025-10-17 Price Changed $309,000 Hive MLS
- 2025-10-17 Listed $30,900 Hive MLS
- 2021-07-27 Sold (Public Records) $235,000 Public Records
- 2021-05-25 Sold (Public Records) $190,000 Public Records
- 2003-09-01 Sold (Public Records) $119,000 Public Records
- 2003-01-13 Listing Removed — Hive MLS
- 2002-03-15 Listed $124,900 Hive MLS
Property tax history
+5.2%/yrLatest (2025): $1,265 · +0.0% YoY. Source: county tax records.
Cash-flow waterfall
monthlySold comps — $/sqft
last 12 mo · ≤1 miLoading sold comps…