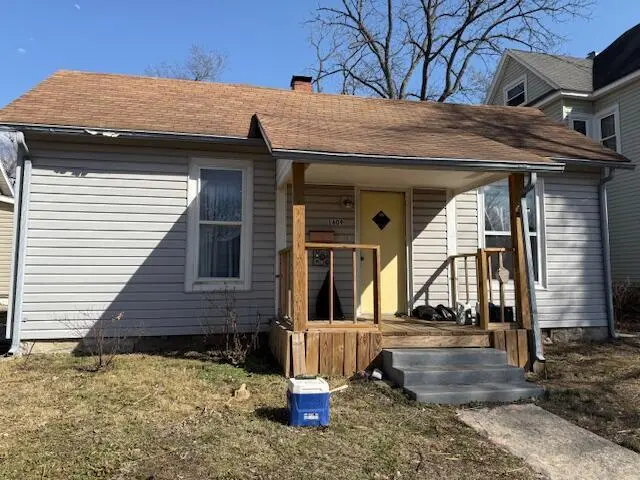
1609 Vermont Ave · Sedalia, MO
Flood risk 1/10 · Minimal
- FEMA flood zone
- X (unshaded)
- Chance of flooding over 30 yrs
- 0.0%
- Est. flood insurance / yr
- $473 – $860
Fire risk 2/10 · Minimal
- Est. fire insurance / yr
- $1,054 – $1,958
Heat risk 4/10 · Minor
- Hot days now (above 106°F)
- 7 days/yr
- Hot days in 30 yrs
- 17 days/yr
Wind risk 2/10 · Minimal
- Chance of severe wind over 30 yrs
- —
Air-quality risk 2/10 · Minimal
- Unhealthy air days now
- 0 days/yr
- Unhealthy air days in 30 yrs
- 1 days/yr
Risk factors via First Street. Map © Google.
Why this score? — see what drove the B+ grade
The composite is a weighted blend of 9 inputs, each scored 0–100. Each bar is that input's sub-score; the figure is the points it added to the 100-point composite (weight × sub-score).
- Cash flow +30.0/30.0
- ARV discount +15.0/15.0
- DSCR +10.0/10.0
- 1% rule +9.0/10.0
- Schools +3.9/10.0
- Livability +3.6/5.0
- Rent growth +2.5/5.0
- Condition / age +2.5/5.0
- Appreciation +0.0/10.0
$85,000
🖨 Deal sheet (PDF) 📄 Offer letter ✓ Due diligence
Listing remarks MLS
Great return on your investment. This three bedroom 1 bath home is located close to dining, shopping and the downtown area. Home has been updated with vinyl siding and most windows have been replaced with vinyl windows. The alley access allows for plenty of parking behind the home.
Key facts
- Alley access
- Vinyl windows
- Plenty of parking
Tags
Neighborhood map
What this means for you Summary
Snapshot
- This is a 2-bed/1.0-bath single-family listed at $85k.
Deal economics
- At list price, monthly cash flow is $428 ($5k/yr) — positive.
- The deal already cash-flows at list — no discount required.
- Meets the 1% rule at list price ($1k rent vs $85k).
- Recommended offer: $75k (12.0% below list) — sets the bar for market timing.
- Cap rate 12.3% vs local median 4.3% in Sedalia — top-decile yield for the area; either an underpriced asset or a hidden risk that comps aren't pricing in. Stress-test before assuming the spread holds.
Location & tenants
- Location reads 71/100 on livability (#107 in MO) — a middle-class / working-renter tenant base. Strengths: cost of living A+, housing A+, health & safety A+; Watch: amenities D, crime F, commute F.
- Sedalia 200 (town): math 47% / reading 46% proficiency, ranked #89 of 324 in MO (top 28%) — families likely to look elsewhere, expect single-tenant / working-renter base with shorter leases.
- Market conditions: 220 active listings in the ZIP; 3 comparable units currently listed for rent nearby; rentals lingering (median 45d on market — plan ~5-8 weeks vacancy on turnover, expect pricing pressure); 100% of comp listings sitting > 30 days — soft ceiling on asking rent; 109 units permitted in Pettis County in 2024 (46 in 5+ unit buildings).
Forward outlook
- Local home prices are declining (-3.0%/yr); year-one equity from $588 of loan paydown is wiped out by about $3k of value loss. Plan a longer hold.
- Pettis County population projected to shrink 7% by 2050 — rents likely to lag national; underwrite the cash flow, not the appreciation.
- At projected returns (-3.0% appreciation + 3.0% rent growth), your $24k cash investment doubles in ~6 years — after that, you're playing with house money.
Negotiation context
- It's been on market 302 days — a 12% lower offer ($75k) is reasonable based on typical stale-listing flexibility.
- 3 sale attempts with the ask held roughly flat each time — persistent listings suggest the price (not the market) is what's stuck; bring a comps-based counter.
Risks & watch-outs
- Watch-outs: built in 1895 — expect roof / HVAC / electrical / plumbing capex.
Questions for the listing agent
- It's been on market 302 days. Have you received any prior offers? Is the seller open to a 12% concession, seller financing, or rate buy-down credit?
- Built in 1895 — when were the roof, HVAC, electrical panel, plumbing, and water heater last replaced?
- Why hasn't it sold? Are there any deal-killer items the seller is aware of (foundation, flood, title, zoning, code violations)?
- Is there a deadline driving the sale (1031 exchange, divorce, estate, relocation)? That informs how much negotiation room exists.
- Crime grade is F in this area — have there been break-ins, vandalism, or insurance claims at this property in the last 3 years? What carrier currently insures it and at what premium?
- What's the average days-on-market for RENTAL listings here right now (not sales)? A rising rental-DOM trend means longer vacancies and softer asking-rent achievability than the comps imply.
- What's the recent tenant-quality profile in this submarket — average credit score on applications, eviction rate, late-payment / NSF rate, and stable-employment percentage? A property-management company in the area should have these aggregated.
- How much new for-sale + rental construction is in the pipeline within 1–3 miles? Heavy new supply typically softens prices + rents 12–24 months out; constrained supply supports both.
Investment metrics
- 1% rule
- 1.40% ✓
- Cap rate
- 12.33%
- Cash-on-cash
- 21.56%
- DSCR
- 1.96
- GRM
- 5.9
CMA / ARV
- ARV (median comp)
- $133,636
- List price
- $85,000
- Delta
- -36.39%
- Verdict
- UNDERPRICED
- Comps
- 20 within 1.0 mi
Show comp detail 10 sales within ~0.75 mi
| Address | Dist | Beds/Ba | Sqft | Sold | Price | $/sf | Match |
|---|---|---|---|---|---|---|---|
| 1100 S Missouri Ave | 0.31mi | 2/1.0 | 888 (0%) | 8mo | $55,000 | $62 | 79 |
| 2011 S Harrison Ave | 0.32mi | 3/1.0 (+1) | 864 (-3%) | 1mo | $138,000 | $160 | 75 |
| 1704 S Moniteau St | 0.07mi | 3/2.0 (+1) | 950 (+7%) | 6mo | $190,000 | $200 | 72 |
| 1317 S Ohio Ave | 0.30mi | 2/1.0 | 960 (+8%) | 4mo | $130,000 | $135 | 69 |
| 1404 S Grand Ave | 0.27mi | 3/1.0 (+1) | 948 (+7%) | 3mo | $153,000 | $161 | 68 |
| 1716 S Ohio Ave | 0.24mi | 2/1.0 | 780 (-12%) | 12mo | $84,900 | $109 | 58 |
| 640 E 11th St | 0.72mi | 2/1.0 | 936 (+5%) | 9mo | $79,000 | $84 | 50 |
| 110 E 11th St | 0.40mi | 2/2.0 | 816 (-8%) | 19mo | $85,000 | $104 | 48 |
| 1624 S Barrett Ave | 0.66mi | 3/2.0 (+1) | 936 (+5%) | 10mo | $140,000 | $150 | 43 |
| 648 E 11th St | 0.74mi | 3/1.0 (+1) | 962 (+8%) | 12mo | $115,000 | $120 | 36 |
Match score weights: distance 35% · size 25% · config 20% · recency 20%. Top-matched comps best support the ARV.
Projected returns pro-forma
-3.0% appreciation · 3.0% rent growth · sell at horizon
- IRR
- 14.1%
- Equity multiple
- 1.56×
- Total profit
- $13,437
- Equity at exit
- $12,674
- IRR
- 22.9%
- Equity multiple
- 2.96×
- Total profit
- $46,661
- Equity at exit
- $7,349
Cash invested: $23,800 (down + closing). Projections, not guarantees.
Landlord ↔ Tenant lean methodology
- Overall (STATE)
- 81 Strongly Landlord-Friendly
- State Missouri
- 81 Strongly Landlord-Friendly · R+10
- County
- — inherits STATE
- City
- — inherits STATE
ZIP-level market 65301
- Home prices YoY
- -21.8%
- Active inventory
- 220
- Price-to-rent
- 5.9×
Monthly cashflow live
- Estimated rent
- $1,191 medium interval (Pro) →
- Mortgage (P&I)
- −$446
- Tax from tax record
- −$32 /mo · $381/yr
- Insurance
- −$35
- HOA
- −$0
- Vacancy / Maint / Mgmt
- −$250
- Net cashflow
- $428
Break-even live
Sensitivity live
| Price | -10% $476 | -5% $452 | +0% $428 | +5% $404 | +10% $380 |
|---|---|---|---|---|---|
| Rent | -10% $334 | -5% $381 | +0% $428 | +5% $475 | +10% $522 |
| Rate | -1.0pp $470 | -0.5pp $449 | base $428 | +0.5pp $406 | +1.0pp $383 |
UW: 25.0% down · 7.5% · 30yr · 1.5% tax · 5.0% vac · 8.0% maint · 8.0% mgmt
Financing live
Cash to close
- Down payment
- $21,250
- Closing costs
- $2,550
- Reserves months
- —
- Total cash needed
- —
Loan-product check · same deal, 3 products live
Conventional
25% down · 7.5% · 30yr
- Down + closing
- —
- Monthly P&I
- —
- Monthly cashflow
- —
- DSCR
- —
- Eligible?
- —
Personal DTI + credit; lowest rate.
DSCR
20% down · 8.5% · 30yr
- Down + closing
- —
- Monthly P&I
- —
- Monthly cashflow
- —
- DSCR
- —
- Eligible?
- —
No personal income docs; deal must DSCR.
Hard money
10% down · 12.0% · 12mo
- Down + closing
- —
- Monthly P&I
- —
- Monthly cashflow
- —
- DSCR
- —
- Eligible?
- —
Short-term bridge; refi at stabilization.
Rent comps 3 comps
| Address | Beds | Baths | Sqft | Rent | $/sqft | DOM | Units | Dist |
|---|---|---|---|---|---|---|---|---|
| 1108 E 10th St Sedalia, MO | 2.0 | 1.0 | 864 | $1,750 | $2.03 | 44d | 1 | 1.07mi |
| 1900 W 10th St Sedalia, MO | 1.0 | 1.0 | 750 | $815 | $1.09 | 44d | 1 | 1.09mi |
| 1501 S State Fair Blvd Sedalia, MO | 2.0 | 2.0 | 934 | $1,218 | $1.30 | 44d | 15 | 1.15mi |
Listing history 17 events
-
2026-06-05statusdays on market $85,000 Pending 302 DOM
-
2026-06-03days on market $85,000 Active 301 DOM
-
2026-06-02days on market $85,000 Active 300 DOM
-
2026-06-01days on market $85,000 Active 299 DOM
-
2026-05-31days on market $85,000 Active 298 DOM
-
2026-05-30days on market $85,000 Active 297 DOM
-
2026-03-24status Active 282-char remark
Show marketing remark (282 chars)
Great return on your investment. This three bedroom 1 bath home is located close to dining, shopping and the downtown area. Home has been updated with vinyl siding and most windows have been replaced with vinyl windows. The alley access allows for plenty of parking behind the home.
-
2026-03-14status Pending 282-char remark
Show marketing remark (282 chars)
Great return on your investment. This three bedroom 1 bath home is located close to dining, shopping and the downtown area. Home has been updated with vinyl siding and most windows have been replaced with vinyl windows. The alley access allows for plenty of parking behind the home.
-
2025-12-18status Active 282-char remark
Show marketing remark (282 chars)
Great return on your investment. This three bedroom 1 bath home is located close to dining, shopping and the downtown area. Home has been updated with vinyl siding and most windows have been replaced with vinyl windows. The alley access allows for plenty of parking behind the home.
-
2025-07-29status Pending 282-char remark
Show marketing remark (282 chars)
Great return on your investment. This three bedroom 1 bath home is located close to dining, shopping and the downtown area. Home has been updated with vinyl siding and most windows have been replaced with vinyl windows. The alley access allows for plenty of parking behind the home.
-
2025-03-08$85,000 Active 282-char remark
Show marketing remark (282 chars)
Great return on your investment. This three bedroom 1 bath home is located close to dining, shopping and the downtown area. Home has been updated with vinyl siding and most windows have been replaced with vinyl windows. The alley access allows for plenty of parking behind the home.
-
2024-05-17soldstatus
-
2021-11-16soldstatus
-
2001-03-01soldstatus
-
1993-09-01soldstatus
-
1991-02-25soldstatus
-
1991-02-25soldstatus
ⓘ Source: listings_history table (triggers on properties + properties_extension) + one-shot
backfill from property_details.listing_events for pre-trigger history.
Tax reassessment forecast MO · Resets to sale price
- Current annual tax
- $381 · $32/mo
- Projected year-2 tax
- $824 · $69/mo
- Expected delta
- +$443/yr (+$37/mo · 116.3%)
ⓘ Screening estimate from a state-policy table — verify with the county assessor before closing.
Climate risk First Street
- Flood 1/10 Low FEMA zone X (unshaded) · 0% chance over 30 yrs
- Wildfire 2/10 Low
- Heat 4/10 Moderate 7 d/yr ≥106°F today · 17 d/yr by 30 yrs out
- Wind 2/10 Low
- Air quality 2/10 Low 0 unhealthy d/yr today · 1 by 30 yrs out
Nearby sold comps map
Loading sold comps map…
Walkable amenities ~0.75 mi
Loading nearby amenities…
Taxation est. · year 1
- Rental income
- $14,288
- − Mortgage interest
- −$4,761
- − Property taxes
- −$381
- − Insurance
- −$425
- − Repairs & maintenance
- −$1,143
- − Management
- −$1,143
- − Depreciation
- −$2,473
- Taxable income
- $3,961
- Est. tax owed @ 24.0%
- −$951
- After-tax cash flow
- $4,181/yr
For passive investors: Depreciation is non-cash, so a rental often shows a tax loss while cash-flowing — sheltering income. Rental losses are passive: they offset passive income freely, and up to $25,000/yr can offset ordinary (W-2) income if you actively participate and your MAGI is under $100k (phasing out to $0 by $150k); unused losses carry forward. On sale, claimed depreciation is recaptured at up to 25%, and gains may owe capital-gains tax (a 1031 exchange can defer both). Figures are a year-1 estimate at your 24.0% rate — not tax advice; consult a CPA.
Schools (NCES district)
- District
- Sedalia 200
- NCES district ID
- 2927830
- Math proficiency
- 47% ▼ -1.00%
- Reading proficiency
- 46% ▼ -3.00%
- Median HH income
- $37,452
- Composite
- 38.7/100
- National rank
- #4141
- State rank
- #89 of 324 in MO
Livability — Sedalia
- Score
- 71/100
- State rank
- #107
- US rank
- #6990
Category grades
Schools grade is shown separately in the Schools card above.
Census & demographics
- Census place
- Sedalia, MO
- County
- Pettis County · 35,091 people
- City population
- 35,091
- Metro
- Sedalia, MO
- Population (ZIP)
- 35,091
- Household income
- $58,064
- Rent vs Own
- Severe rent burden
- 1021.0
Population outlook (Pettis County) Hauer SSP2
- Today (2025)
- 41,992 people
- By 2030
- 41,584 · -1.0%
- By 2040
- 40,483 · -3.6%
- By 2050
- 39,049 · -7.0%
- By 2075
- 35,413 · -15.7%
- By 2100
- 30,870 · -26.5%
Race, ethnicity, and origin ACS 2023
- Neighborhood character
- Predominantly White (81%)
- Race & ethnicity
- White 81% Hispanic / Latino 10% Two or more races 7% Black 3%
- Hispanic origin (detail)
- Mexican 8%
- Common ancestry
- Subsaharan African 3% Lithuanian 2% Italian 1%
- Foreign-born
- 7% · Canada
- Languages at home
- 87% English-only · Spanish 7% Russian/Polish/Slavic 4% German/W. Germanic 1%
Political lean MEDSL · Pettis
- 2024 margin
- Solid R (+48.8) · D 24.9% · R 73.7% · Other 1.4%
- 2008→2024 swing
- -26.3pp toward R · 2008: -22.4pp · 2024: -48.8pp
- All cycles
- 2024: R+48.8 2020: R+47.5 2016: R+46.9 2012: R+28.8 2008: R+22.4
Not yet ingested
- Civics
- —
Market trends
- HPI YoY
- ▼ -81.80%
- Current HPI
- 292.8224
- Rent YoY
- —
- Metro
- Sedalia, MO
- State GDP YoY
- ▲ 1.84%
- F500 in state
- 20
Industry mix (Fortune 500 HQ in MO)
| Industry | F500 HQs | Revenue |
|---|---|---|
| Healthcare | 1 | $163B |
|
||
| Insurance | 1 | $21B |
|
||
| Industrial Technology | 1 | $17B |
|
||
| Retail | 1 | $16B |
|
||
| Industrial Distribution | 1 | $10B |
|
||
| Utilities | 1 | $9B |
|
||
Price history
11 events — show timeline
- 2026-03-24 Relisted — CMBR
- 2026-03-14 Pending — CMBR
- 2025-12-18 Relisted — CMBR
- 2025-07-29 Pending — CMBR
- 2025-03-08 Listed $85,000 CMBR
- 2024-05-17 Sold (Public Records) — Public Records
- 2021-11-16 Sold (Public Records) — Public Records
- 2001-03-01 Sold (Public Records) — Public Records
- 1993-09-01 Sold (Public Records) — Public Records
- 1991-02-25 Sold (Public Records) — Public Records
- 1991-02-25 Sold (Public Records) — Public Records
Property tax history
-0.5%/yrLatest (2025): $381 · +1.2% YoY. Source: county tax records.
Cash-flow waterfall
monthlySold comps — $/sqft
last 12 mo · ≤1 miLoading sold comps…