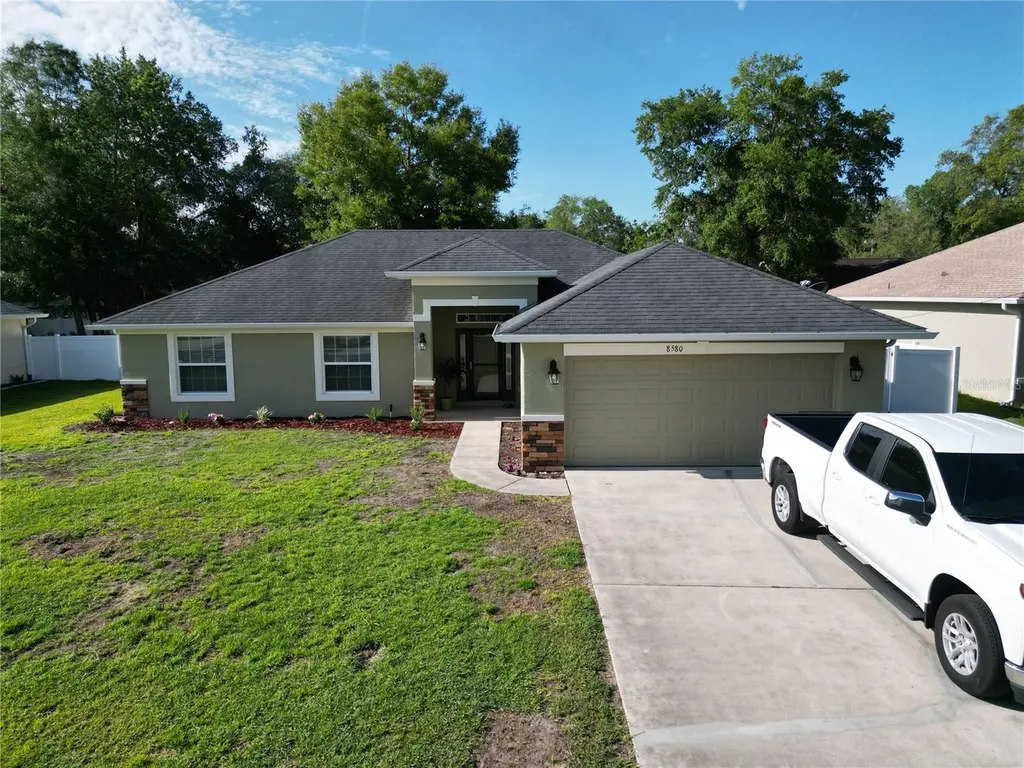
8580 SE 163rd Ln · The Villages, FL
Flood risk 4/10 · Minor
- FEMA flood zone
- X (unshaded)
- Chance of flooding over 30 yrs
- 0.22%
- Est. flood insurance / yr
- $507 – $1,088
Fire risk 4/10 · Minor
- Est. fire insurance / yr
- $947 – $1,759
Heat risk 9/10 · Severe
- Hot days now (above 109°F)
- 7 days/yr
- Hot days in 30 yrs
- 21 days/yr
Wind risk 9/10 · Severe
- Chance of severe wind over 30 yrs
- 99.0%
Air-quality risk 3/10 · Minor
- Unhealthy air days now
- 2 days/yr
- Unhealthy air days in 30 yrs
- 2 days/yr
Risk factors via First Street. Map © Google.
Why this score? — see what drove the D- grade
The composite is a weighted blend of 9 inputs, each scored 0–100. Each bar is that input's sub-score; the figure is the points it added to the 100-point composite (weight × sub-score).
- Cash flow +12.0/30.0
- ARV discount +8.9/15.0
- Schools +3.6/10.0
- DSCR +3.5/10.0
- Livability +3.5/5.0
- 1% rule +2.9/10.0
- Rent growth +2.5/5.0
- Condition / age +2.5/5.0
- Appreciation +0.0/10.0
$299,000
🖨 Deal sheet (PDF) 📄 Offer letter ✓ Due diligence
Listing remarks MLS
Remarkably close to shopping, offices, restaurants and The Villages, this block and stucco, 4 bedroom (all with closets), and 2 bath home is ideal for the buyer who wants a newer home, close to amenities, but located on a quiet street with a private backyard. Built in 2015, this home features volume ceilings in the main living area, tray ceiling in the master bedroom, split floor plan, stainless steel appliances, a security system, and a two-car garage. It also has a backyard shed with electric for extra storage. This home needs no updating and is ready for you to enjoy. Check out this home while it is available to see if it is right for you!
Key facts
- Open floor plan
- Quartz countertops
- Covered patio
Tags
Property features AI
Finance
- Other: Homestead exempt; Zoned R1
Exterior
- Parking: Attached garage; 2-car garage
- Utilities: Well water; Septic tank; Electricity available; Cable available
- Home design: Single family residence; Residential property; One-story; Entry level: One; Facing East
- Construction: Cement siding and concrete construction; Shingle roof; Slab foundation; Built on a single level
- Exterior features: Asphalt road access; Lot dimensions about 85 x 138; Lot size approximately 0.27 acres (1/4 to less than 1/2 acre)
Interior
- Kitchen: Dishwasher; Range; Microwave; Refrigerator
- Bedrooms: 4 bedrooms
- Flooring: Laminate; Tile
- Bathrooms: 2 full bathrooms
- Heating & cooling: Central heating; Central air conditioning
- Interior features: Cathedral ceilings; Ceiling fans
- Laundry & utility: Inside laundry room; Washer; Dryer
Neighborhood map
What this means for you Summary
Snapshot
- This is a 4-bed/2.0-bath single-family listed at $299k.
Deal economics
- At list price, monthly cash flow is $-73 ($-871/yr) — negative.
- To cash-flow at today's rent, offer at most $286k (4.3% below list).
- To meet the 1% rule (rent ≥ 1% of price), the offer needs to be $236k (21.1% below list).
- Recommended offer: $236k (21.1% below list) — sets the bar for 1% rule.
- Cap rate 6.0% vs local median 5.0% in The Villages — meaningfully above typical; check what's discounted (condition, days-on-market, listing class) to confirm the premium yield is real.
Location & tenants
- Location reads 70/100 on livability (#431 in FL) — a middle-class / working-renter tenant base. Strengths: crime A+, housing A, employment B+; Watch: amenities F, commute F, health & safety F.
- Marion (rural): math 42% / reading 43% proficiency, ranked #61 of 73 in FL (top 84%) — families likely to look elsewhere, expect single-tenant / working-renter base with shorter leases; 61% free/reduced lunch — lower-income household profile, screen leases tightly.
- Zoned schools: Harbour View Elementary School (math 41% / reading 38%, grade F, #1,513 of 2,144 statewide, top 73%, 819 students, 71% FRL); Lake Weir Middle School (math 37% / reading 33%, grade F, #416 of 571 statewide, top 74%, 1,207 students, 76% FRL); Belleview High School (math 31% / reading 46%, grade F, #321 of 667 statewide, top 49%, 1,783 students, 56% FRL).
- Market conditions: 713 active listings in the ZIP; 11 comparable units currently listed for rent nearby; rentals at typical pace (median 23d on market — plan ~3-4 weeks tenant-placement turnaround); 7,071 units permitted in Marion County in 2024 (534 in 5+ unit buildings).
- This rent runs 42% of the median local income ($67k/yr) — at the standard rent-burdened threshold; future hikes will face affordability resistance.
Forward outlook
- Local home prices are declining (-3.0%/yr); year-one equity from $2k of loan paydown is wiped out by about $9k of value loss. Plan a longer hold.
- Marion County population projected at +13% by 2050 — modest demand growth; plan on rents tracking national, not racing it.
Negotiation context
- Only 6 days on market — expect competitive offers; lowballing is unlikely to land.
- 3 sale attempts since 6y ago with the ask held roughly flat each time — persistent listings suggest the price (not the market) is what's stuck; bring a comps-based counter.
- Current owner paid $220k; 36% above their basis — modest negotiation headroom, anchor on the comps not their cost.
Risks & watch-outs
- Climate carrying-cost: severe wind risk, 99% chance of damaging wind over 30y; extreme-heat days projected 7→21/yr by 2055 (HVAC capex compounding) — expect insurance premiums to compound above CPI over the hold.
Questions for the listing agent
- What do current leases actually rent for vs. the listed asking? Can we see a recent rent roll and the last 12 months of T-12 income?
- Is there a deadline driving the sale (1031 exchange, divorce, estate, relocation)? That informs how much negotiation room exists.
- Schools are A-rated — typically a magnet for longer-tenancy family renters. What's the average tenant stay here, and is there a school-zone premium baked into asking?
- The area grade is low — what's the realistic commute time and amenity access for the typical tenant pool here? Any planned neighborhood developments (good or bad) we should know about?
- What's the average days-on-market for RENTAL listings here right now (not sales)? A rising rental-DOM trend means longer vacancies and softer asking-rent achievability than the comps imply.
- What's the recent tenant-quality profile in this submarket — average credit score on applications, eviction rate, late-payment / NSF rate, and stable-employment percentage? A property-management company in the area should have these aggregated.
- How much new for-sale + rental construction is in the pipeline within 1–3 miles? Heavy new supply typically softens prices + rents 12–24 months out; constrained supply supports both.
Investment metrics
- 1% rule
- 0.79% ✗
- Cap rate
- 6.00%
- Cash-on-cash
- -1.04%
- DSCR
- 0.95
- GRM
- 10.6
CMA / ARV
- ARV (median comp)
- $308,361
- List price
- $299,000
- Delta
- 2.15%
- Verdict
- FAIR
- Comps
- 20 within 1.0 mi
Show comp detail 12 sales within ~0.75 mi
| Address | Dist | Beds/Ba | Sqft | Sold | Price | $/sf | Match |
|---|---|---|---|---|---|---|---|
| 16356 SE 87th Ave | 0.11mi | 3/2.0 (-1) | 1,621 (-5%) | 3mo | $233,000 | $144 | 78 |
| 16352 SE 84th Ter | 0.13mi | 3/2.0 (-1) | 1,776 (+4%) | 9mo | $314,000 | $177 | 75 |
| 8660 SE 159th Pl | 0.47mi | 4/2.5 | 1,716 (+0%) | 8mo | $205,000 | $119 | 68 |
| 16845 SE 86th Deptford Ct | 0.51mi | 3/2.0 (-1) | 1,666 (-3%) | 2mo | $349,900 | $210 | 65 |
| 8591 SE 159th Ln | 0.44mi | 3/2.0 (-1) | 1,754 (+2%) | 21mo | $325,000 | $185 | 52 |
| 16331 SE 81st Ct | 0.43mi | 3/2.0 (-1) | 1,833 (+7%) | 13mo | $285,000 | $155 | 52 |
| 16817 SE 84th Colerain Cir | 0.46mi | 3/2.0 (-1) | 1,915 (+12%) | 4mo | $574,000 | $300 | 50 |
| 8352 SE 168th Trinity Pl | 0.51mi | 3/2.0 (-1) | 1,559 (-9%) | 11mo | $299,000 | $192 | 47 |
| 10342 SE 161st Lane Rd | 0.59mi | 4/2.0 | 1,828 (+7%) | 21mo | $311,990 | $171 | 43 |
| 8538 SE 168th Kittredge Loop | 0.41mi | 3/2.0 (-1) | 1,866 (+9%) | 22mo | $422,000 | $226 | 42 |
| 16931 SE 84th Colerain Cir | 0.59mi | 3/2.0 (-1) | 1,925 (+12%) | 9mo | $495,000 | $257 | 39 |
| 15831 SE 89th Ter | 0.72mi | 3/2.0 (-1) | 1,806 (+6%) | 16mo | $285,000 | $158 | 39 |
Match score weights: distance 35% · size 25% · config 20% · recency 20%. Top-matched comps best support the ARV.
Projected returns pro-forma
-3.0% appreciation · 3.0% rent growth · sell at horizon
- IRR
- -18.0%
- Equity multiple
- 0.37×
- Total profit
- $-53,118
- Equity at exit
- $44,582
- IRR
- -10.3%
- Equity multiple
- 0.37×
- Total profit
- $-52,389
- Equity at exit
- $25,852
Cash invested: $83,720 (down + closing). Projections, not guarantees.
Landlord ↔ Tenant lean methodology
- Overall (STATE)
- 87 Strongly Landlord-Friendly
- State Florida
- 87 Strongly Landlord-Friendly · R+3
- County
- — inherits STATE
- City
- — inherits STATE
ZIP-level market 34491
- Home prices YoY
- -35.0%
- Active inventory
- 713
- Price-to-rent
- 10.6×
Monthly cashflow live
- Estimated rent
- $2,358 high interval (Pro) →
- Mortgage (P&I)
- −$1,568
- Tax from tax record
- −$243 /mo · $2,912/yr
- Insurance
- −$125
- HOA
- −$0
- Vacancy / Maint / Mgmt
- −$495
- Net cashflow
- $-73
Break-even live
Sensitivity live
| Price | -10% $97 | -5% $12 | +0% $-73 | +5% $-157 | +10% $-242 |
|---|---|---|---|---|---|
| Rent | -10% $-259 | -5% $-166 | +0% $-73 | +5% $21 | +10% $114 |
| Rate | -1.0pp $78 | -0.5pp $3 | base $-73 | +0.5pp $-150 | +1.0pp $-229 |
UW: 25.0% down · 7.5% · 30yr · 1.5% tax · 5.0% vac · 8.0% maint · 8.0% mgmt
Financing live
Cash to close
- Down payment
- $74,750
- Closing costs
- $8,970
- Reserves months
- —
- Total cash needed
- —
Loan-product check · same deal, 3 products live
Conventional
25% down · 7.5% · 30yr
- Down + closing
- —
- Monthly P&I
- —
- Monthly cashflow
- —
- DSCR
- —
- Eligible?
- —
Personal DTI + credit; lowest rate.
DSCR
20% down · 8.5% · 30yr
- Down + closing
- —
- Monthly P&I
- —
- Monthly cashflow
- —
- DSCR
- —
- Eligible?
- —
No personal income docs; deal must DSCR.
Hard money
10% down · 12.0% · 12mo
- Down + closing
- —
- Monthly P&I
- —
- Monthly cashflow
- —
- DSCR
- —
- Eligible?
- —
Short-term bridge; refi at stabilization.
Rent comps 11 comps
| Address | Beds | Baths | Sqft | Rent | $/sqft | DOM | Units | Dist |
|---|---|---|---|---|---|---|---|---|
| 8198 SE 164th Pl Summerfield, FL | 3.0 | 1.5 | 1965 | $2,650 | $1.35 | 22d | 1 | 0.40mi |
| 16475 SE 89th Ter Summerfield, FL | 4.0 | 3.0 | 1942 | $2,700 | $1.39 | 15d | 1 | 0.42mi |
| 8364 SE 158th Pl Summerfield, FL | 3.0 | 2.0 | 1374 | $2,000 | $1.46 | 15d | 1 | 0.53mi |
| 8352 SE 158th Pl Summerfield, FL | 3.0 | 2.0 | 1232 | $2,000 | $1.62 | 15d | 1 | 0.54mi |
| 9195 SE 163rd St Summerfield, FL | 3.0 | 2.0 | 1410 | $1,800 | $1.28 | 22d | 1 | 0.62mi |
| 8721 SE 157th St Summerfield, FL | 3.0 | 2.0 | 1236 | $1,650 | $1.33 | 22d | 1 | 0.71mi |
| 7781 SE 166th Smallwood Pl The Villages, FL | 3.0 | 2.0 | 1924 | $2,300 | $1.20 | 22d | 1 | 0.78mi |
| 9393 SE 158th Pl Summerfield, FL | 4.0 | 3.0 | 1990 | $2,500 | $1.26 | 22d | 1 | 0.97mi |
| 9523 SE 168th Maplesong Ln The Villages, FL | 3.0 | 2.0 | 1265 | $1,975 | $1.56 | 22d | 1 | 1.07mi |
| 9871 SE 161st Lane Rd Unit 0 Summerfield, FL | 4.0 | 2.0 | 1827 | $2,200 | $1.20 | 22d | 1 | 1.36mi |
| 17199 SE 97th Ter Summerfield, FL | 3.0 | 2.0 | 1404 | $1,990 | $1.42 | 22d | 1 | 1.49mi |
Listing history 18 events
-
2026-06-15statusdays on market $299,000 Pending 6 DOM
-
2026-06-14days on market $299,000 Active 5 DOM
-
2026-06-13days on market $299,000 Active 4 DOM
-
2026-06-10days on market $299,000 Active 2 DOM
-
2026-06-09remarks 693-char remark
-
2026-06-09pricedays on market $299,000 Active 1 DOM
-
2026-06-03days on market $315,000 Active 22 DOM
-
2026-06-02days on market $315,000 Active 21 DOM
-
2026-06-01days on market $315,000 Active 20 DOM
-
2026-05-31days on market $315,000 Active 19 DOM
-
2026-05-30days on market $315,000 Active 18 DOM
-
2026-05-12$315,000 Active 691-char remark
-
2020-08-03soldstatus $219,900
-
2020-07-24soldstatus $219,900 650-char remark
Show marketing remark (650 chars)
Remarkably close to shopping, offices, restaurants and The Villages, this block and stucco, 4 bedroom (all with closets), and 2 bath home is ideal for the buyer who wants a newer home, close to amenities, but located on a quiet street with a private backyard. Built in 2015, this home features volume ceilings in the main living area, tray ceiling in the master bedroom, split floor plan, stainless steel appliances, a security system, and a two-car garage. It also has a backyard shed with electric for extra storage. This home needs no updating and is ready for you to enjoy. Check out this home while it is available to see if it is right for you!
-
2020-06-01$219,900 650-char remark
Show marketing remark (650 chars)
Remarkably close to shopping, offices, restaurants and The Villages, this block and stucco, 4 bedroom (all with closets), and 2 bath home is ideal for the buyer who wants a newer home, close to amenities, but located on a quiet street with a private backyard. Built in 2015, this home features volume ceilings in the main living area, tray ceiling in the master bedroom, split floor plan, stainless steel appliances, a security system, and a two-car garage. It also has a backyard shed with electric for extra storage. This home needs no updating and is ready for you to enjoy. Check out this home while it is available to see if it is right for you!
-
2012-02-10soldstatus $13,400
-
2009-07-29soldstatus $20,000
-
2002-10-04soldstatus $5,800
ⓘ Source: listings_history table (triggers on properties + properties_extension) + one-shot
backfill from property_details.listing_events for pre-trigger history.
Tax reassessment forecast FL · Resets to sale price
- Current annual tax
- $2,912 · $243/mo
- Projected year-2 tax
- $2,912 · $243/mo
- Expected delta
- $0/yr ($0/mo · 0.0%)
ⓘ Screening estimate from a state-policy table — verify with the county assessor before closing.
Climate risk First Street
- Flood 4/10 Moderate FEMA zone X (unshaded) · 22% chance over 30 yrs
- Wildfire 4/10 Moderate
- Heat 9/10 Extreme 7 d/yr ≥109°F today · 21 d/yr by 30 yrs out
- Wind 9/10 Extreme 99% chance of damaging wind over 30 yrs
- Air quality 3/10 Moderate 2 unhealthy d/yr today · 2 by 30 yrs out
Nearby sold comps map
Loading sold comps map…
Walkable amenities ~0.75 mi
Loading nearby amenities…
Taxation est. · year 1
- Rental income
- $28,293
- − Mortgage interest
- −$16,749
- − Property taxes
- −$2,912
- − Insurance
- −$1,495
- − Repairs & maintenance
- −$2,263
- − Management
- −$2,263
- − Depreciation
- −$8,698
- Taxable loss
- −$6,087
- Est. tax savings @ 24.0%
- +$1,461
- After-tax cash flow
- $590/yr
For passive investors: Depreciation is non-cash, so a rental often shows a tax loss while cash-flowing — sheltering income. Rental losses are passive: they offset passive income freely, and up to $25,000/yr can offset ordinary (W-2) income if you actively participate and your MAGI is under $100k (phasing out to $0 by $150k); unused losses carry forward. On sale, claimed depreciation is recaptured at up to 25%, and gains may owe capital-gains tax (a 1031 exchange can defer both). Figures are a year-1 estimate at your 24.0% rate — not tax advice; consult a CPA.
Schools (NCES district)
- District
- Marion
- NCES district ID
- 1201260
- Math proficiency
- 42% ▼ -7.00%
- Reading proficiency
- 43% ▼ -4.00%
- Median HH income
- $40,015
- Composite
- 35.61/100
- National rank
- #4890
- State rank
- #61 of 73 in FL
Livability — The Villages
- Score
- 70/100
- State rank
- #431
- US rank
- #7363
Category grades
Schools grade is shown separately in the Schools card above.
Census & demographics
- County
- Marion County · 315,796 people
- City population
- 83,973
- Metro
- Ocala, FL
- Population (ZIP)
- 33,318
- Household income
- $66,679
- Rent vs Own
- Severe rent burden
- 256.0
Population outlook (Marion County) Hauer SSP2
- Today (2025)
- 365,905 people
- By 2030
- 376,768 · +3.0%
- By 2040
- 396,555 · +8.4%
- By 2050
- 412,723 · +12.8%
- By 2075
- 446,090 · +21.9%
- By 2100
- 436,193 · +19.2%
Race, ethnicity, and origin ACS 2023
- Neighborhood character
- Predominantly White (77%)
- Race & ethnicity
- White 77% Hispanic / Latino 14% Two or more races 9% Black 4% Asian 2%
- Hispanic origin (detail)
- Mexican 3% Puerto Rican 6% Cuban 1%
- Common ancestry
- Lithuanian 3% Slovak 2% Romanian 2%
- Foreign-born
- 8% · Canada, Vietnam, Jamaica
- Languages at home
- 85% English-only · Spanish 11% Vietnamese 1% French/Haitian/Cajun 1%
Political lean MEDSL · Marion
- 2024 margin
- Solid R (+31.6) · D 33.8% · R 65.5%
- 2008→2024 swing
- -20.0pp toward R · 2008: -11.6pp · 2024: -31.6pp
- All cycles
- 2024: R+31.6 2020: R+25.9 2016: R+26.2 2012: R+16.2 2008: R+11.6
Not yet ingested
- Civics
- —
Market trends
- HPI YoY
- ▼ -107.67%
- Current HPI
- 200.0792
- Rent YoY
- —
- Metro
- Ocala, FL
- State GDP YoY
- ▲ 3.28%
- F500 in state
- 36
Industry mix (Fortune 500 HQ in FL)
| Industry | F500 HQs | Revenue |
|---|---|---|
| Industrial Technology | 2 | $29B |
|
||
| Insurance | 2 | $17B |
|
||
| Retail | 1 | $60B |
|
||
| Technology Distribution | 1 | $58B |
|
||
| Homebuilding | 1 | $35B |
|
||
| Technology Manufacturing | 1 | $35B |
|
||
Price history
+5055.2% since first listed10 events — show timeline
- 2026-06-14 Pending — Stellar MLS as Distributed by MLS Grid
- 2026-06-08 Listed $299,000 Stellar MLS as Distributed by MLS Grid
- 2026-06-06 Listing Removed — Stellar MLS as Distributed by MLS Grid
- 2026-05-12 Listed $315,000 Stellar MLS as Distributed by MLS Grid
- 2020-08-03 Sold (Public Records) $219,900 Public Records
- 2020-07-24 Sold (MLS) $219,900 Stellar MLS as Distributed by MLS Grid
- 2020-06-01 Listed $219,900 Stellar MLS as Distributed by MLS Grid
- 2012-02-10 Sold (Public Records) $13,400 Public Records
- 2009-07-29 Sold (Public Records) $20,000 Public Records
- 2002-10-04 Sold (Public Records) $5,800 Public Records
Property tax history
+17.3%/yrLatest (2025): $2,912 · +9.5% YoY. Source: county tax records.
Cash-flow waterfall
monthlySold comps — $/sqft
last 12 mo · ≤1 miLoading sold comps…