23937 Killer Bee Ln · New Caney, TX
Flood risk 1/10 · Minimal
- FEMA flood zone
- X (unshaded)
- Chance of flooding over 30 yrs
- 0.0%
- Est. flood insurance / yr
- $507 – $1,088
Fire risk 3/10 · Minor
- Est. fire insurance / yr
- $1,222 – $2,270
Heat risk 8/10 · Major
- Hot days now (above 111°F)
- 6 days/yr
- Hot days in 30 yrs
- 21 days/yr
Wind risk 9/10 · Severe
- Chance of severe wind over 30 yrs
- 99.0%
Air-quality risk 3/10 · Minor
- Unhealthy air days now
- 2 days/yr
- Unhealthy air days in 30 yrs
- 3 days/yr
Risk factors via First Street. Map © Google.
Why this score? — see what drove the B+ grade
The composite is a weighted blend of 9 inputs, each scored 0–100. Each bar is that input's sub-score; the figure is the points it added to the 100-point composite (weight × sub-score).
- Cash flow +30.0/30.0
- ARV discount +15.0/15.0
- 1% rule +10.0/10.0
- DSCR +10.0/10.0
- Schools +2.8/10.0
- Rent growth +2.6/5.0
- Livability +2.5/5.0
- Condition / age +2.2/5.0
- Appreciation +0.0/10.0
$99,900
🖨 Deal sheet 📄 Offer letter ✓ Due diligence
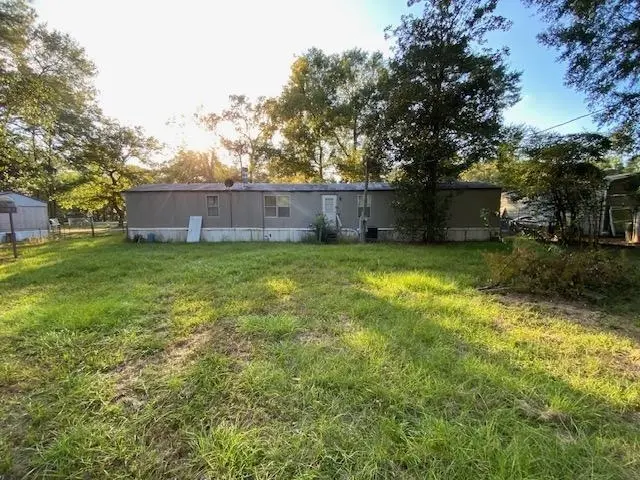
Listing remarks
Fleetwood manufactured home on almost half an acre in the New Caney ISD. This home features three bedrooms, two baths, 1178 sqft, 0.495 acre lot, and mature trees. Remodel is wrapping up so new pics will be coming soon. Great price on this one!!
Key facts
- 0.5 acre lot
- Built 1998
- Listed 3 days
Property features AI
Finance
- Other: Directions: From 494 go East on Keith Dr to right on Liberty/Sharon to Killer Bee
- Financial info: Annual tax amount approximately $1,250
- HOA & community: Details not provided
Exterior
- Parking: Details not provided
- Security: Details not provided
- Utilities: Details not provided
- Home design: Manufactured home; Single-story
- Construction: Construction details not provided
- Exterior features: Subdivision: White Oak Crossing; Lot roughly 0.495 acres
Interior
- Kitchen: Appliances not specified
- Bedrooms: Details not provided
- Flooring: Details not provided
- Bathrooms: 2 full bathrooms
- Heating & cooling: Central heating; Electric heating; Central air conditioning
- Interior features: Electric water heater; Total of 5 rooms
- Laundry & utility: Details not provided
Neighborhood map
What this means for you Summary
Snapshot
- This is a 3-bed/2.0-bath manufactured listed at $100k. Condition is rated fair.
Deal economics
- At list price, monthly cash flow is $822 ($10k/yr) — positive.
- The deal already cash-flows at list — no discount required.
- Meets the 1% rule at list price ($2k rent vs $100k).
Location & tenants
- Location reads: area grade B — affects rentability + tenant quality, not the cash-flow math above.
- New Caney ISD (suburban): math 31% / reading 32% proficiency, ranked #570 of 826 in TX (top 69%) — families likely to look elsewhere, expect single-tenant / working-renter base with shorter leases.
- Market conditions: Rents flat; 979 active listings in the ZIP; 3 comparable units currently listed for rent nearby; rentals lingering (median 44d on market — plan ~5-8 weeks vacancy on turnover, expect pricing pressure); 67% of comp listings sitting > 30 days — soft ceiling on asking rent; solid renter incomes; 13,259 units permitted in Montgomery County in 2024 (1,402 in 5+ unit buildings).
Forward outlook
- Local home prices are declining (-3.0%/yr); year-one equity from $691 of loan paydown is wiped out by about $3k of value loss. Plan a longer hold.
- Montgomery County population projected at +65% by 2050 — long-run rental-demand tailwind backs the buy-and-hold thesis.
- At projected returns (-3.0% appreciation + 0.2% rent growth), your $28k cash investment doubles in ~4 years — after that, you're playing with house money.
Negotiation context
- Only 3 days on market — expect competitive offers; lowballing is unlikely to land.
Risks & watch-outs
- Climate carrying-cost: severe wind risk, 99% chance of damaging wind over 30y; extreme-heat days projected 6→21/yr by 2055 (HVAC capex compounding) — expect insurance premiums to compound above CPI over the hold.
Questions for the listing agent
- Have any recent inspections been done? Can we get a copy of the seller's disclosures and any deferred-maintenance estimates?
- Is there a deadline driving the sale (1031 exchange, divorce, estate, relocation)? That informs how much negotiation room exists.
- What's the average days-on-market for RENTAL listings here right now (not sales)? A rising rental-DOM trend means longer vacancies and softer asking-rent achievability than the comps imply.
- What's the recent tenant-quality profile in this submarket — average credit score on applications, eviction rate, late-payment / NSF rate, and stable-employment percentage? A property-management company in the area should have these aggregated.
- How much new for-sale + rental construction is in the pipeline within 1–3 miles? Heavy new supply typically softens prices + rents 12–24 months out; constrained supply supports both.
Investment metrics
- 1% rule
- 1.88% ✓
- Cap rate
- 16.17%
- Cash-on-cash
- 35.28%
- DSCR
- 2.57
- GRM
- 4.4
CMA / ARV
- ARV (on-the-fly)
- $156,864
- Comps found
- 1
Show comp detail 1 sale within ~0.75 mi
| Address | Dist | Beds/Ba | Sqft | Sold | Price | $/sf | Match |
|---|---|---|---|---|---|---|---|
| 23907 Mydas Fly Ln | 0.52mi | 3/2.0 | 1,088 (-10%) | 2mo | $140,000 | $129 | 57 |
Match score weights: distance 35% · size 25% · config 20% · recency 20%. Top-matched comps best support the ARV.
Projected returns pro-forma
-3.0% appreciation · 0.21% rent growth · sell at horizon
- IRR
- 27.7%
- Equity multiple
- 2.11×
- Total profit
- $31,070
- Equity at exit
- $14,895
- IRR
- 33.6%
- Equity multiple
- 3.67×
- Total profit
- $74,632
- Equity at exit
- $8,638
Cash invested: $27,972 (down + closing). Projections, not guarantees.
Landlord ↔ Tenant lean methodology
- Overall (STATE)
- 87 Strongly Landlord-Friendly
- State Texas
- 87 Strongly Landlord-Friendly · R+5
- County
- — inherits STATE
- City
- — inherits STATE
ZIP-level market 77357
- Home prices YoY
- -24.7%
- Rents YoY
- 0.2%
- Active inventory
- 979
- Price-to-rent
- 4.4×
Monthly cashflow live
- Estimated rent
- $1,879 medium interval (Pro) →
- Mortgage (P&I)
- −$524
- Tax from tax record
- −$96 /mo · $1,158/yr
- Insurance
- −$42
- HOA
- −$0
- Vacancy / Maint / Mgmt
- −$395
- Net cashflow
- $822
Break-even live
UW: 25.0% down · 7.5% · 30yr · 1.5% tax · 5.0% vac · 8.0% maint · 8.0% mgmt
Financing live
Cash to close
- Down payment
- $24,975
- Closing costs
- $2,997
- Reserves months
- —
- Total cash needed
- —
Loan-product check · same deal, 3 products live
Conventional
25% down · 7.5% · 30yr
- Down + closing
- —
- Monthly P&I
- —
- Monthly cashflow
- —
- DSCR
- —
- Eligible?
- —
Personal DTI + credit; lowest rate.
DSCR
20% down · 8.5% · 30yr
- Down + closing
- —
- Monthly P&I
- —
- Monthly cashflow
- —
- DSCR
- —
- Eligible?
- —
No personal income docs; deal must DSCR.
Hard money
10% down · 12.0% · 12mo
- Down + closing
- —
- Monthly P&I
- —
- Monthly cashflow
- —
- DSCR
- —
- Eligible?
- —
Short-term bridge; refi at stabilization.
Rent comps 3 comps
| Address | Beds | Baths | Sqft | Rent | $/sqft | DOM | Units | Dist |
|---|---|---|---|---|---|---|---|---|
| 22744 Keith Dr New Caney, TX | 3.0 | 2.0 | 1370 | $1,650 | $1.20 | 43d | 1 | 1.03mi |
| 22344 Montgomery Pines Rd Porter, TX | 1.0–3.0 | 1.0–2.0 | 982 | $2,002 | $2.04 | 2d | 21 | 1.24mi |
| 23461 Highway 59 Porter, TX | 1.0–3.0 | 1.0–2.0 | 928 | $1,371 | $1.48 | 43d | 1 | 1.29mi |
Listing history 2 events
-
2026-04-30status Pending
-
2026-04-23$99,900 Active
ⓘ Source: listings_history table (triggers on properties + properties_extension) + one-shot
backfill from property_details.listing_events for pre-trigger history.
Tax reassessment forecast TX · Resets to sale price
- Current annual tax
- $1,158 · $96/mo
- Projected year-2 tax
- $1,828 · $152/mo
- Expected delta
- +$670/yr (+$56/mo · 57.9%)
ⓘ Screening estimate from a state-policy table — verify with the county assessor before closing.
Climate risk First Street
- Flood 1/10 Low FEMA zone X (unshaded) · 0% chance over 30 yrs
- Wildfire 3/10 Moderate
- Heat 8/10 Severe 6 d/yr ≥111°F today · 21 d/yr by 30 yrs out
- Wind 9/10 Extreme 99% chance of damaging wind over 30 yrs
- Air quality 3/10 Moderate 2 unhealthy d/yr today · 3 by 30 yrs out
Nearby sold comps map
Loading sold comps map…
Walkable amenities ~0.75 mi
Loading nearby amenities…
Taxation est. · year 1
- Rental income
- $22,548
- − Mortgage interest
- −$5,596
- − Property taxes
- −$1,158
- − Insurance
- −$500
- − Repairs & maintenance
- −$1,804
- − Management
- −$1,804
- − Depreciation
- −$2,906
- Taxable income
- $8,781
- Est. tax owed @ 24.0%
- −$2,107
- After-tax cash flow
- $7,761/yr
For passive investors: Depreciation is non-cash, so a rental often shows a tax loss while cash-flowing — sheltering income. Rental losses are passive: they offset passive income freely, and up to $25,000/yr can offset ordinary (W-2) income if you actively participate and your MAGI is under $100k (phasing out to $0 by $150k); unused losses carry forward. On sale, claimed depreciation is recaptured at up to 25%, and gains may owe capital-gains tax (a 1031 exchange can defer both). Figures are a year-1 estimate at your 24.0% rate — not tax advice; consult a CPA.
Condition & rehab AI · 6 photos
The home requires significant exterior and landscaping repairs, as well as interior updates to improve its condition and value.
Repairs flagged
- Major Exterior siding — The exterior siding appears to be in poor condition, with visible wear and tear.
- Major Landscaping — The yard is overgrown with grass and weeds, indicating a lack of maintenance and a poor curb appeal.
Value-add opportunities
- Both Landscaping and exterior maintenance — A well-maintained yard and exterior can significantly improve the home's curb appeal and overall value.
- Resale Interior updates — Updating the interior can improve the home's appearance and functionality, making it more attractive to potential buyers.
- Rental HVAC and mechanical systems — Upgrading the HVAC and mechanical systems can improve the home's energy efficiency and reduce maintenance costs, making it more attractive to renters.
Renovation cost estimate screening
| Repair item | Severity | Est. cost |
|---|---|---|
| Exterior siding · The exterior siding appears to be in poor condition, with visible wear and tear. | Major | $15,000–50,000 |
| Landscaping · The yard is overgrown with grass and weeds, indicating a lack of maintenance and a poor curb appeal. | Major | $15,000–50,000 |
| Total estimated repair cost · 2 items | $30,000–100,000 |
Value-add ROI direction
- Both Landscaping and exterior maintenance — A well-maintained yard and exterior can significantly improve the home's curb appeal and overall value. ↑
- Resale Interior updates — Updating the interior can improve the home's appearance and functionality, making it more attractive to potential buyers. ↑
- Rental HVAC and mechanical systems — Upgrading the HVAC and mechanical systems can improve the home's energy efficiency and reduce maintenance costs, making it more attractive to renters. ↑
ⓘ Cost ranges are severity-bucket heuristics (US national rule-of-thumb). Get contractor quotes + a written scope before underwriting a rehab budget.
Schools (NCES district)
- District
- New Caney ISD
- NCES district ID
- 4832400
- Math proficiency
- 31% ▼ -16.00%
- Reading proficiency
- 32% ▼ -6.00%
- Median HH income
- $55,380
- Composite
- 27.97/100
- National rank
- #6857
- State rank
- #570 of 826 in TX
Livability — New Caney
No livability data for this city. (Only ~50 U.S. cities are tracked.)
Census & demographics
- County
- Montgomery County · 663,713 people
- City population
- 37,592
- Metro
- Houston-The Woodlands-Sugar Land, TX
- Population (ZIP)
- 37,592
- Household income
- $76,050
- Rent vs Own
- Severe rent burden
- 487.0
Population outlook (Montgomery County) Hauer SSP2
- Today (2025)
- 713,896 people
- By 2030
- 805,263 · +12.8%
- By 2040
- 992,708 · +39.1%
- By 2050
- 1,179,590 · +65.2%
- By 2075
- 1,628,084 · +128.1%
- By 2100
- 1,937,880 · +171.5%
Race, ethnicity, and origin ACS 2023
- Neighborhood character
- Diverse neighborhood (Simpson 0.56)
- Race & ethnicity
- Hispanic / Latino 49% White 45% Two or more races 31% Black 3%
- Hispanic origin (detail)
- Mexican 40%
- Common ancestry
- Lithuanian 2% Romanian 1% Iranian 1%
- Foreign-born
- 23% · Canada, Jamaica
- Languages at home
- 58% English-only · Spanish 40% Other Indo-European 1%
Political lean MEDSL · Montgomery
- 2024 margin
- Solid R (+45.5) · D 26.8% · R 72.3%
- 2008→2024 swing
- +7.2pp toward D · 2008: -52.7pp · 2024: -45.5pp
- All cycles
- 2024: R+45.5 2020: R+43.8 2016: R+51.4 2012: R+60.7 2008: R+52.7
Not yet ingested
- Civics
- —
Market trends
- HPI YoY
- ▼ -87.71%
- Current HPI
- 266.8315
- Rent YoY
- ▲ 0.21%
- Metro
- Houston-The Woodlands-Sugar Land, TX
- State GDP YoY
- ▲ 3.95%
- F500 in state
- 110
Industry mix (Fortune 500 HQ in TX)
| Industry | F500 HQs | Revenue |
|---|---|---|
| Energy | 16 | $1,198B |
|
||
| Technology | 5 | $198B |
|
||
| Engineering / Construction | 4 | $72B |
|
||
| Energy Services | 3 | $60B |
|
||
| Utilities | 3 | $41B |
|
||
| Healthcare | 2 | $330B |
|
||
Price history
2 events — show timeline
- 2026-04-30 Pending — LAAR
- 2026-04-23 Listed $99,900 LAAR
Cash-flow waterfall
monthlySold comps — $/sqft
last 12 mo · ≤1 miLoading sold comps…