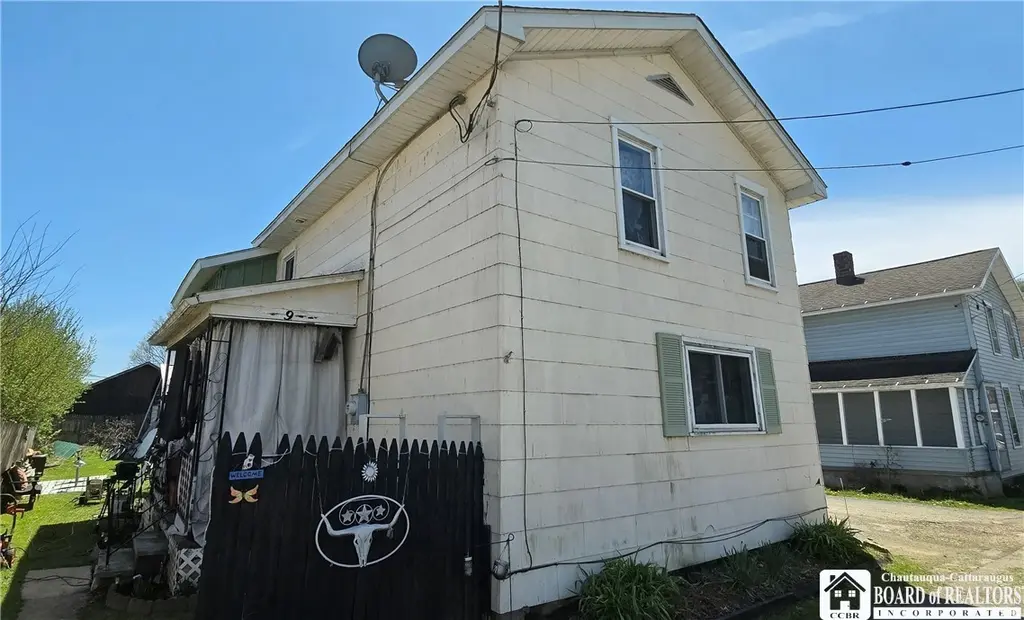
9 Colwell St · Portville, NY
Flood risk 5/10 · Moderate
- FEMA flood zone
- X (shaded)
- Chance of flooding over 30 yrs
- 0.27%
- Est. flood insurance / yr
- $507 – $1,088
Fire risk 2/10 · Minimal
- Est. fire insurance / yr
- $691 – $1,283
Heat risk 2/10 · Minimal
- Hot days now (above 90°F)
- 8 days/yr
- Hot days in 30 yrs
- 18 days/yr
Wind risk 1/10 · Minimal
- Chance of severe wind over 30 yrs
- —
Air-quality risk 1/10 · Minimal
- Unhealthy air days now
- 0 days/yr
- Unhealthy air days in 30 yrs
- 0 days/yr
Risk factors via First Street. Map © Google.
Why this score? — see what drove the B+ grade
The composite is a weighted blend of 9 inputs, each scored 0–100. Each bar is that input's sub-score; the figure is the points it added to the 100-point composite (weight × sub-score).
- Cash flow +30.0/30.0
- 1% rule +10.0/10.0
- DSCR +10.0/10.0
- Appreciation +8.8/10.0
- ARV discount +7.5/15.0
- Schools +5.5/10.0
- Livability +3.1/5.0
- Rent growth +2.5/5.0
- Condition / age +2.5/5.0
$65,000
🖨 Deal sheet 📄 Offer letter ✓ Due diligence
Listing remarks
Located in the Village of Portville, this 3-bedroom, 1-full-bath home offers approximately 1,496 square feet of living space with a functional layout and added potential. The first floor features an eat-in kitchen, office, dining room, living room, and laundry room with space that could be finished into a half bath. Upstairs you will find three bedrooms and a full bathroom, including one bedroom with a vaulted ceiling and generous closet area. Many windows have been updated, adding to the home's appeal. Outside, the property includes an 18' x 24' two-car garage/shop/storage building, providing excellent space for vehicles, hobbies, or extra storage. Conveniently located near village ameniti
Key facts
- Laundry room
- Vaulted ceiling
- Updated windows
Tags
Property features AI
Exterior
- Parking: Detached garage; 2 garage spaces
- Utilities: Public water (connected); Sewer connected
- Home design: 2 stories; Existing/resale property
- Construction: Composite siding; Block foundation
- Exterior features: Blacktop driveway; City street frontage; Rectangular residential lot (approx. 41 x 99)
Interior
- Kitchen: Eat-in kitchen; Appliances negotiable
- Bedrooms: Convertible bedroom (room level not specified)
- Flooring: Laminate; Vinyl; Varies
- Bathrooms: 1 full bathroom
- Heating & cooling: Gas heating; Forced air
- Interior features: Separate/formal dining room; Eat-in kitchen; Separate/formal living room; Home office; Convertible bedroom; Partial basement
- Laundry & utility: Laundry on main level; Gas water heater
Neighborhood map
What this means for you Summary
Snapshot
- This is a 3-bed/1.5-bath single-family listed at $65k.
Deal economics
- At list price, monthly cash flow is $376 ($5k/yr) — positive.
- The deal already cash-flows at list — no discount required.
- Meets the 1% rule at list price ($1k rent vs $65k).
Location & tenants
- Location reads 62/100 on livability (#877 in NY) — a middle-class / working-renter tenant base. Strengths: cost of living A+, housing A+, schools B; Watch: employment D, health & safety D, crime F.
- Portville Central School District (rural): math 63% / reading 65% proficiency, ranked #190 of 590 in NY (top 32%) — acceptable for families but not a draw, mixed tenant base, ~2y average lease.
- Market conditions: 25 active listings in the ZIP; 128 units permitted in Cattaraugus County in 2024 (21 in 5+ unit buildings).
Forward outlook
- In year one you build about $5k of equity ($449 loan paydown + $5k appreciation (7.7% local appreciation)).
- Cattaraugus County population projected at -28% by 2050 — secular population decline; favor cash flow + early exit over multi-decade hold.
- At projected returns (7.7% appreciation + 3.0% rent growth), your $18k cash investment doubles in ~2 years — after that, you're playing with house money.
- By year 6, paydown + projected appreciation supports a ~$31k cash-out refi (75% LTV) — recoverable capital for the next deal without selling this one.
Negotiation context
- Only 13 days on market — expect competitive offers; lowballing is unlikely to land.
- 2 sale attempts since 13y ago with the ask held roughly flat each time — persistent listings suggest the price (not the market) is what's stuck; bring a comps-based counter.
- Current owner paid $20k; list at $65k implies a 225% gain — meaningful room to come down on a strong offer.
Risks & watch-outs
- Watch-outs: property tax is 3.6% of price; built in 1920 — expect roof / HVAC / electrical / plumbing capex.
- Climate carrying-cost: moderate flood risk — expect insurance premiums to compound above CPI over the hold.
Questions for the listing agent
- Built in 1920 — when were the roof, HVAC, electrical panel, plumbing, and water heater last replaced?
- Property tax is high relative to price — has the assessment been appealed recently, and will the sale trigger a re-assessment?
- Is there a deadline driving the sale (1031 exchange, divorce, estate, relocation)? That informs how much negotiation room exists.
- Schools are B-rated — typically a magnet for longer-tenancy family renters. What's the average tenant stay here, and is there a school-zone premium baked into asking?
- Crime grade is F in this area — have there been break-ins, vandalism, or insurance claims at this property in the last 3 years? What carrier currently insures it and at what premium?
- What's the average days-on-market for RENTAL listings here right now (not sales)? A rising rental-DOM trend means longer vacancies and softer asking-rent achievability than the comps imply.
- What's the recent tenant-quality profile in this submarket — average credit score on applications, eviction rate, late-payment / NSF rate, and stable-employment percentage? A property-management company in the area should have these aggregated.
- How much new for-sale + rental construction is in the pipeline within 1–3 miles? Heavy new supply typically softens prices + rents 12–24 months out; constrained supply supports both.
Investment metrics
- 1% rule
- 1.83% ✓
- Cap rate
- 13.24%
- Cash-on-cash
- 24.82%
- DSCR
- 2.10
- GRM
- 4.5
CMA / ARV
- ARV (median comp)
- $138,868
- List price
- $65,000
- Delta
- -53.19%
- Verdict
- UNDERPRICED
- Comps
- 16 within 1.0 mi
Show comp detail 5 sales within ~0.75 mi
| Address | Dist | Beds/Ba | Sqft | Sold | Price | $/sf | Match |
|---|---|---|---|---|---|---|---|
| 11 Colwell St | 0.01mi | 3/1.0 | 1,272 (-15%) | 19mo | $60,000 | $47 | 57 |
| 12 Brooklyn St | 0.23mi | 3/2.0 | 1,697 (+13%) | 11mo | $115,000 | $68 | 56 |
| 16 Goss Ave | 0.66mi | 3/1.0 | 1,450 (-3%) | 8mo | $137,000 | $94 | 55 |
| 32 Temple St | 0.20mi | 3/1.5 | 1,685 (+13%) | 21mo | $148,294 | $88 | 52 |
| 104 S Main St | 0.40mi | 2/1.0 (-1) | 1,300 (-13%) | 8mo | $155,000 | $119 | 46 |
Match score weights: distance 35% · size 25% · config 20% · recency 20%. Top-matched comps best support the ARV.
Projected returns pro-forma
7.68% appreciation · 3.0% rent growth · sell at horizon
- IRR
- 39.2%
- Equity multiple
- 3.72×
- Total profit
- $49,528
- Equity at exit
- $47,986
- IRR
- 35.2%
- Equity multiple
- 7.93×
- Total profit
- $126,045
- Equity at exit
- $93,949
Cash invested: $18,200 (down + closing). Projections, not guarantees.
Landlord ↔ Tenant lean methodology
- Overall (STATE)
- 15 Strongly Tenant-Friendly
- State New York
- 15 Strongly Tenant-Friendly · D+10
- County
- — inherits STATE
- City
- — inherits STATE
ZIP-level market 14770
- Home prices YoY
- 2.9%
- Active inventory
- 25
- Price-to-rent
- 4.5×
Monthly cashflow live
- Estimated rent
- $1,191 medium interval (Pro) →
- Mortgage (P&I)
- −$341
- Tax from tax record
- −$197 /mo · $2,360/yr
- Insurance
- −$27
- HOA
- −$0
- Vacancy / Maint / Mgmt
- −$250
- Net cashflow
- $376
Break-even live
UW: 25.0% down · 7.5% · 30yr · 1.5% tax · 5.0% vac · 8.0% maint · 8.0% mgmt
Financing live
Cash to close
- Down payment
- $16,250
- Closing costs
- $1,950
- Reserves months
- —
- Total cash needed
- —
Loan-product check · same deal, 3 products live
Conventional
25% down · 7.5% · 30yr
- Down + closing
- —
- Monthly P&I
- —
- Monthly cashflow
- —
- DSCR
- —
- Eligible?
- —
Personal DTI + credit; lowest rate.
DSCR
20% down · 8.5% · 30yr
- Down + closing
- —
- Monthly P&I
- —
- Monthly cashflow
- —
- DSCR
- —
- Eligible?
- —
No personal income docs; deal must DSCR.
Hard money
10% down · 12.0% · 12mo
- Down + closing
- —
- Monthly P&I
- —
- Monthly cashflow
- —
- DSCR
- —
- Eligible?
- —
Short-term bridge; refi at stabilization.
Listing history 5 events
-
2026-05-11status Pending 762-char remark
-
2026-05-04historical Active Under Contract 762-char remark
-
2026-04-28$65,000 Active 762-char remark
-
2018-01-16soldstatus $20,000
-
2013-02-18$29,900
ⓘ Source: listings_history table (triggers on properties + properties_extension) + one-shot
backfill from property_details.listing_events for pre-trigger history.
Tax reassessment forecast NY · Partial reset (capped growth)
- Current annual tax
- $2,360 · $197/mo
- Projected year-2 tax
- $2,360 · $197/mo
- Expected delta
- $0/yr ($0/mo · 0.0%)
ⓘ Screening estimate from a state-policy table — verify with the county assessor before closing.
Climate risk First Street
- Flood 5/10 Major FEMA zone X (shaded) · 27% chance over 30 yrs
- Wildfire 2/10 Low
- Heat 2/10 Low 8 d/yr ≥90°F today · 18 d/yr by 30 yrs out
- Wind 1/10 Low
- Air quality 1/10 Low 0 unhealthy d/yr today · 0 by 30 yrs out
Nearby sold comps map
Loading sold comps map…
Walkable amenities ~0.75 mi
Loading nearby amenities…
Taxation est. · year 1
- Rental income
- $14,295
- − Mortgage interest
- −$3,641
- − Property taxes
- −$2,360
- − Insurance
- −$325
- − Repairs & maintenance
- −$1,144
- − Management
- −$1,144
- − Depreciation
- −$1,891
- Taxable income
- $3,790
- Est. tax owed @ 24.0%
- −$910
- After-tax cash flow
- $3,608/yr
For passive investors: Depreciation is non-cash, so a rental often shows a tax loss while cash-flowing — sheltering income. Rental losses are passive: they offset passive income freely, and up to $25,000/yr can offset ordinary (W-2) income if you actively participate and your MAGI is under $100k (phasing out to $0 by $150k); unused losses carry forward. On sale, claimed depreciation is recaptured at up to 25%, and gains may owe capital-gains tax (a 1031 exchange can defer both). Figures are a year-1 estimate at your 24.0% rate — not tax advice; consult a CPA.
Schools (NCES district)
- District
- Portville Central School District
- NCES district ID
- 3623640
- Math proficiency
- 63% ▲ 1.00%
- Reading proficiency
- 65% ▲ 5.00%
- Median HH income
- $52,207
- Composite
- 54.6/100
- National rank
- #1337
- State rank
- #190 of 590 in NY
Livability — Portville
- Score
- 62/100
- State rank
- #877
- US rank
- #17008
Category grades
Schools grade is shown separately in the Schools card above.
Census & demographics
- Census place
- Portville, NY
- Population (ZIP)
- 2,805
Population outlook (Cattaraugus County) Hauer SSP2
- Today (2025)
- 71,623 people
- By 2030
- 67,751 · -5.4%
- By 2040
- 59,488 · -16.9%
- By 2050
- 51,601 · -28.0%
- By 2075
- 35,025 · -51.1%
- By 2100
- 21,243 · -70.3%
Race, ethnicity, and origin ACS 2023
- Neighborhood character
- Predominantly White (93%)
- Race & ethnicity
- White 93% Two or more races 4% Black 2%
- Common ancestry
- Romanian 8% Slovak 4% Lithuanian 1%
- Foreign-born
- 2% · Canada
- Languages at home
- 99% English-only · Spanish 1%
Political lean MEDSL · Cattaraugus
- 2024 margin
- Solid R (+32.8) · D 33.6% · R 66.4%
- 2008→2024 swing
- -22.2pp toward R · 2008: -10.6pp · 2024: -32.8pp
- All cycles
- 2024: R+32.8 2020: R+29.5 2016: R+34.4 2012: R+13.4 2008: R+10.6
Not yet ingested
- Civics
- —
Market trends
- HPI YoY
- ▲ 7.68%
- Current HPI
- 276.8841
- Rent YoY
- —
- Metro
- —
- State GDP YoY
- ▲ 2.60%
- F500 in state
- 92
Industry mix (Fortune 500 HQ in NY)
| Industry | F500 HQs | Revenue |
|---|---|---|
| Financial Services | 10 | $950B |
|
||
| Consumer Goods | 9 | $162B |
|
||
| Insurance | 4 | $225B |
|
||
| Telecommunications | 2 | $144B |
|
||
| Pharmaceuticals | 2 | $112B |
|
||
| Media / Entertainment | 2 | $69B |
|
||
Price history
+117.4% since first listed5 events — show timeline
- 2026-05-11 Pending — UNYREIS
- 2026-05-04 Contingent — UNYREIS
- 2026-04-28 Listed $65,000 UNYREIS
- 2018-01-16 Sold (Public Records) $20,000 Public Records
- 2013-02-18 Listed $29,900 WNYREIS
Property tax history
+1.5%/yrLatest (2025): $2,360 · +5.3% YoY. Source: county tax records.
Cash-flow waterfall
monthlySold comps — $/sqft
last 12 mo · ≤1 miLoading sold comps…