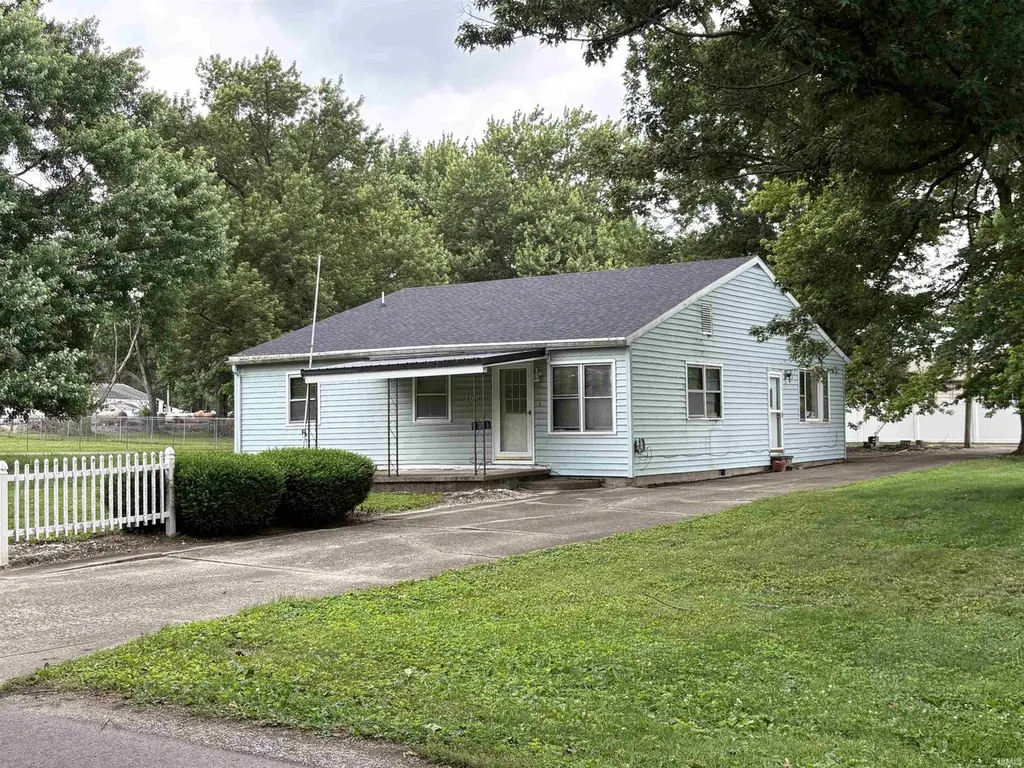
204 Jackson Ave · Peru, IN
Flood risk 9/10 · Severe
- FEMA flood zone
- X (shaded)
- Chance of flooding over 30 yrs
- 0.99%
- Est. flood insurance / yr
- $507 – $1,088
Fire risk 1/10 · Minimal
- Est. fire insurance / yr
- $717 – $1,331
Heat risk 3/10 · Minor
- Hot days now (above 102°F)
- 7 days/yr
- Hot days in 30 yrs
- 16 days/yr
Wind risk 2/10 · Minimal
- Chance of severe wind over 30 yrs
- —
Air-quality risk 2/10 · Minimal
- Unhealthy air days now
- 1 days/yr
- Unhealthy air days in 30 yrs
- 2 days/yr
Risk factors via First Street. Map © Google.
Why this score? — see what drove the B- grade
The composite is a weighted blend of 9 inputs, each scored 0–100. Each bar is that input's sub-score; the figure is the points it added to the 100-point composite (weight × sub-score).
- Cash flow +30.0/30.0
- 1% rule +10.0/10.0
- DSCR +10.0/10.0
- ARV discount +7.5/15.0
- Livability +3.9/5.0
- Schools +3.0/10.0
- Rent growth +2.5/5.0
- Condition / age +2.5/5.0
- Appreciation +0.0/10.0
$69,900
🖨 Deal sheet 📄 Offer letter ✓ Due diligence
Listing remarks
SPACIOUS RANCH HOME WITH TONS OF POTENTIAL! This 4 bedroom 2 bath home needs your finishing touches. Currently has no heating or cooling system. Property offers over 1600 SF. Nice kitchen opens to the large family room. hardwood floors, vinyl exterior and roof replaced in 2022. Property selling AS IS condition. Cash only. Broker has interest.
Key facts
- Hardwood floors
- Roof replaced
- Vinyl exterior
Tags
Property features AI
Exterior
- Parking: Concrete parking surface
- Utilities: Public water; Public sewer
- Home design: Single-family residence; Site-built home; One story; Above-grade finished area noted
- Construction: Vinyl siding; Asphalt shingle roof
- Exterior features: Covered porch; Patio; Porch; Level lot
Interior
- Bedrooms: Total rooms: 7
- Flooring: Hardwood
- Bathrooms: Two full bathrooms (both on the main level)
- Heating & cooling: No heating specified; No cooling specified
- Interior features: Hardwood flooring; Crawl space basement
- Laundry & utility: Laundry on the main level
Neighborhood map
What this means for you Summary
Snapshot
- This is a 4-bed/1.0-bath single-family listed at $70k.
Deal economics
- At list price, monthly cash flow is $591 ($7k/yr) — positive.
- The deal already cash-flows at list — no discount required.
- Meets the 1% rule at list price ($1k rent vs $70k).
- Cap rate 17.6% vs local median 6.1% in Peru — top-decile yield for the area; either an underpriced asset or a hidden risk that comps aren't pricing in. Stress-test before assuming the spread holds.
Location & tenants
- Location reads 77/100 on livability (#35 in IN, #2,834 nationally) — a middle-class / working-renter tenant base. Strengths: amenities A+, cost of living A+, housing A+; Watch: crime D+, commute F, employment F.
- Peru Community Schools (town): math 31% / reading 42% proficiency, ranked #192 of 301 in IN (top 64%) — families likely to look elsewhere, expect single-tenant / working-renter base with shorter leases.
- Zoned schools: Blair Pointe Upper Elementary (math 34% / reading 38%, grade F, #577 of 994 statewide, top 59%, 552 students, 63% FRL); Peru Jr/Sr High School (math 27% / reading 57%, grade F, #197 of 369 statewide, top 57%, 883 students, 59% FRL).
- Market conditions: 129 active listings in the ZIP; 35 units permitted in Miami County in 2024 (0 in 5+ unit buildings).
Forward outlook
- Local home prices are declining (-3.0%/yr); year-one equity from $483 of loan paydown is wiped out by about $2k of value loss. Plan a longer hold.
- Miami County population projected at -12% by 2050 — secular population decline; favor cash flow + early exit over multi-decade hold.
- At projected returns (-3.0% appreciation + 3.0% rent growth), your $20k cash investment doubles in ~4 years — after that, you're playing with house money.
Negotiation context
- Only 11 days on market — expect competitive offers; lowballing is unlikely to land.
- 2 sale attempts since 2y ago with the ask held roughly flat each time — persistent listings suggest the price (not the market) is what's stuck; bring a comps-based counter.
Risks & watch-outs
- Watch-outs: flood insurance adds $66/mo; built in 1956 — expect roof / HVAC / electrical / plumbing capex.
- Climate carrying-cost: severe flood risk — expect insurance premiums to compound above CPI over the hold.
Questions for the listing agent
- Built in 1956 — when were the roof, HVAC, electrical panel, plumbing, and water heater last replaced?
- What's the actual annual flood-insurance premium (NFIP or private), and is the property in a SFHA with mandatory coverage?
- Is there a deadline driving the sale (1031 exchange, divorce, estate, relocation)? That informs how much negotiation room exists.
- Schools are D-rated, which usually means shorter tenancies and higher turnover. Who's the typical renter profile here, and what's been the actual vacancy rate?
- Crime grade is D in this area — have there been break-ins, vandalism, or insurance claims at this property in the last 3 years? What carrier currently insures it and at what premium?
- What's the average days-on-market for RENTAL listings here right now (not sales)? A rising rental-DOM trend means longer vacancies and softer asking-rent achievability than the comps imply.
- What's the recent tenant-quality profile in this submarket — average credit score on applications, eviction rate, late-payment / NSF rate, and stable-employment percentage? A property-management company in the area should have these aggregated.
- How much new for-sale + rental construction is in the pipeline within 1–3 miles? Heavy new supply typically softens prices + rents 12–24 months out; constrained supply supports both.
Investment metrics
- 1% rule
- 2.01% ✓
- Cap rate
- 17.58%
- Cash-on-cash
- 40.29%
- DSCR
- 2.79
- GRM
- 4.2
CMA / ARV
- ARV (on-the-fly)
- $183,816
- Comps found
- 6
Show comp detail 6 sales within ~0.75 mi
| Address | Dist | Beds/Ba | Sqft | Sold | Price | $/sf | Match |
|---|---|---|---|---|---|---|---|
| 321 Harrison Ave | 0.24mi | 3/1.0 (-1) | 1,586 (-4%) | 1mo | $170,000 | $107 | 76 |
| 302 Tyler Ave | 0.23mi | 3/2.0 (-1) | 1,570 (-5%) | 9mo | $225,000 | $143 | 64 |
| 490 N Wayne St. St | 0.29mi | 3/2.0 (-1) | 1,730 (+4%) | 23mo | $129,900 | $75 | 51 |
| 192 N Benton St | 0.58mi | 3/2.0 (-1) | 1,756 (+6%) | 10mo | $210,000 | $120 | 45 |
| 37 Jean Ave Ave | 0.71mi | 3/1.5 (-1) | 1,498 (-10%) | 2mo | $137,000 | $91 | 42 |
| 119 Daniel St | 0.58mi | 3/2.0 (-1) | 1,422 (-14%) | 13mo | $157,500 | $111 | 30 |
Match score weights: distance 35% · size 25% · config 20% · recency 20%. Top-matched comps best support the ARV.
Projected returns pro-forma
-3.0% appreciation · 3.0% rent growth · sell at horizon
- IRR
- 32.0%
- Equity multiple
- 2.35×
- Total profit
- $26,341
- Equity at exit
- $10,422
- IRR
- 39.1%
- Equity multiple
- 4.66×
- Total profit
- $71,557
- Equity at exit
- $6,044
Cash invested: $19,572 (down + closing). Projections, not guarantees.
Landlord ↔ Tenant lean methodology
- Overall (STATE)
- 90 Strongly Landlord-Friendly
- State Indiana
- 90 Strongly Landlord-Friendly · R+11
- County
- — inherits STATE
- City
- — inherits STATE
ZIP-level market 46970
- Home prices YoY
- -8.8%
- Active inventory
- 129
- Price-to-rent
- 4.2×
Monthly cashflow live
- Estimated rent
- $1,403 medium interval (Pro) →
- Mortgage (P&I)
- −$367
- Tax from tax record
- −$55 /mo · $662/yr
- Insurance
- −$29
- Flood insurance flood zone
- −$66 /mo · $798/yr
- HOA
- −$0
- Vacancy / Maint / Mgmt
- −$295
- Net cashflow
- $591
Break-even live
UW: 25.0% down · 7.5% · 30yr · 1.5% tax · 5.0% vac · 8.0% maint · 8.0% mgmt
Financing live
Cash to close
- Down payment
- $17,475
- Closing costs
- $2,097
- Reserves months
- —
- Total cash needed
- —
Loan-product check · same deal, 3 products live
Conventional
25% down · 7.5% · 30yr
- Down + closing
- —
- Monthly P&I
- —
- Monthly cashflow
- —
- DSCR
- —
- Eligible?
- —
Personal DTI + credit; lowest rate.
DSCR
20% down · 8.5% · 30yr
- Down + closing
- —
- Monthly P&I
- —
- Monthly cashflow
- —
- DSCR
- —
- Eligible?
- —
No personal income docs; deal must DSCR.
Hard money
10% down · 12.0% · 12mo
- Down + closing
- —
- Monthly P&I
- —
- Monthly cashflow
- —
- DSCR
- —
- Eligible?
- —
Short-term bridge; refi at stabilization.
Listing history 9 events
-
2026-06-19days on market $69,900 Active 11 DOM
-
2026-06-18days on market $69,900 Active 10 DOM
-
2026-06-17days on market $69,900 Active 9 DOM
-
2026-06-16days on market $69,900 Active 8 DOM
-
2026-06-15days on market $69,900 Active 7 DOM
-
2026-06-14days on market $69,900 Active 5 DOM
-
2026-06-12days on market $69,900 Active 4 DOM
-
2026-06-09remarks 346-char remark
-
2026-06-09$69,900 Active 1 DOM
ⓘ Source: listings_history table (triggers on properties + properties_extension) + one-shot
backfill from property_details.listing_events for pre-trigger history.
Tax reassessment forecast IN · Partial reset (capped growth)
- Current annual tax
- $662 · $55/mo
- Projected year-2 tax
- $662 · $55/mo
- Expected delta
- $0/yr ($0/mo · 0.0%)
ⓘ Screening estimate from a state-policy table — verify with the county assessor before closing.
Climate risk First Street
- Flood 9/10 Extreme FEMA zone X (shaded) · 99% chance over 30 yrs
- Wildfire 1/10 Low
- Heat 3/10 Moderate 7 d/yr ≥102°F today · 16 d/yr by 30 yrs out
- Wind 2/10 Low
- Air quality 2/10 Low 1 unhealthy d/yr today · 2 by 30 yrs out
Nearby sold comps map
Loading sold comps map…
Walkable amenities ~0.75 mi
Loading nearby amenities…
Taxation est. · year 1
- Rental income
- $16,831
- − Mortgage interest
- −$3,915
- − Property taxes
- −$662
- − Insurance
- −$1,147
- − Repairs & maintenance
- −$1,347
- − Management
- −$1,347
- − Depreciation
- −$2,033
- Taxable income
- $6,380
- Est. tax owed @ 24.0%
- −$1,531
- After-tax cash flow
- $5,558/yr
For passive investors: Depreciation is non-cash, so a rental often shows a tax loss while cash-flowing — sheltering income. Rental losses are passive: they offset passive income freely, and up to $25,000/yr can offset ordinary (W-2) income if you actively participate and your MAGI is under $100k (phasing out to $0 by $150k); unused losses carry forward. On sale, claimed depreciation is recaptured at up to 25%, and gains may owe capital-gains tax (a 1031 exchange can defer both). Figures are a year-1 estimate at your 24.0% rate — not tax advice; consult a CPA.
Schools (NCES district)
- District
- Peru Community Schools
- NCES district ID
- 1808850
- Math proficiency
- 31% ▼ -9.00%
- Reading proficiency
- 42% ▼ -2.00%
- Median HH income
- $35,624
- Composite
- 30.18/100
- National rank
- #6316
- State rank
- #192 of 301 in IN
Livability — Peru
- Score
- 77/100
- State rank
- #35
- US rank
- #2834
Category grades
Schools grade is shown separately in the Schools card above.
Census & demographics
- Census place
- Peru, IN
- County
- Miami County · 23,020 people
- City population
- 23,020
- Metro
- Peru, IN
- Population (ZIP)
- 23,020
- Household income
- $57,842
- Rent vs Own
- Severe rent burden
- 498.0
Population outlook (Miami County) Hauer SSP2
- Today (2025)
- 34,421 people
- By 2030
- 33,571 · -2.5%
- By 2040
- 31,919 · -7.3%
- By 2050
- 30,313 · -11.9%
- By 2075
- 26,202 · -23.9%
- By 2100
- 20,856 · -39.4%
Race, ethnicity, and origin ACS 2023
- Neighborhood character
- Predominantly White (87%)
- Race & ethnicity
- White 87% Two or more races 6% Hispanic / Latino 4% Black 3%
- Common ancestry
- Iranian 2% Romanian 2% Slovak 2%
- Foreign-born
- 1% · Canada
- Languages at home
- 97% English-only · Spanish 2% German/W. Germanic 0%
Political lean MEDSL · Miami
- 2024 margin
- Solid R (+54.5) · D 21.8% · R 76.3% · Other 1.9%
- 2008→2024 swing
- -35.1pp toward R · 2008: -19.5pp · 2024: -54.5pp
- All cycles
- 2024: R+54.5 2020: R+53.1 2016: R+53.6 2012: R+30.9 2008: R+19.5
Not yet ingested
- Civics
- —
Market trends
- HPI YoY
- ▼ -24.29%
- Current HPI
- 252.7166
- Rent YoY
- —
- Metro
- Peru, IN
- State GDP YoY
- ▲ 2.90%
- F500 in state
- 18
Industry mix (Fortune 500 HQ in IN)
| Industry | F500 HQs | Revenue |
|---|---|---|
| Industrial Machinery | 2 | $37B |
|
||
| Healthcare | 1 | $177B |
|
||
| Pharmaceuticals | 1 | $45B |
|
||
| Metals / Steel | 1 | $18B |
|
||
| Agriculture | 1 | $17B |
|
||
| Packaging | 1 | $12B |
|
||
Price history
+251.3% since first listed2 events — show timeline
- 2026-06-08 Listed $69,900 IRMLS
- 2024-12-31 Listed $19,900 IRMLS
Property tax history
+55.9%/yrLatest (2024): $662 · -28.0% YoY. Source: county tax records.
Cash-flow waterfall
monthlySold comps — $/sqft
last 12 mo · ≤1 miLoading sold comps…