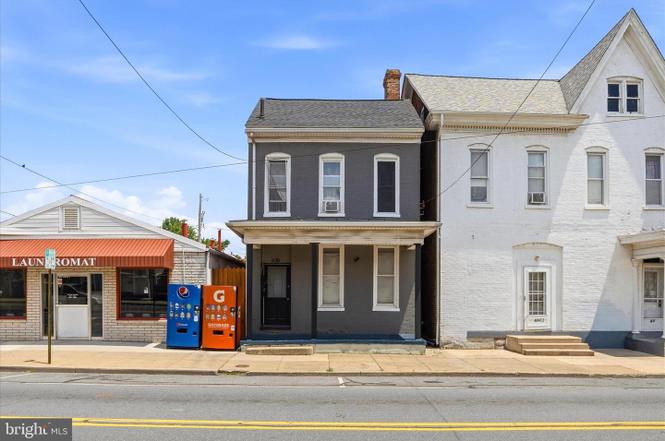
630 Salem Ave · Hagerstown, MD
Flood risk 4/10 · Minor
- FEMA flood zone
- X (unshaded)
- Chance of flooding over 30 yrs
- 0.22%
- Est. flood insurance / yr
- $473 – $860
Fire risk 1/10 · Minimal
- Est. fire insurance / yr
- $755 – $1,403
Heat risk 5/10 · Moderate
- Hot days now (above 101°F)
- 7 days/yr
- Hot days in 30 yrs
- 16 days/yr
Wind risk 2/10 · Minimal
- Chance of severe wind over 30 yrs
- 2.0%
Air-quality risk 1/10 · Minimal
- Unhealthy air days now
- 0 days/yr
- Unhealthy air days in 30 yrs
- 0 days/yr
Risk factors via First Street. Map © Google.
Why this score? — see what drove the D grade
The composite is a weighted blend of 9 inputs, each scored 0–100. Each bar is that input's sub-score; the figure is the points it added to the 100-point composite (weight × sub-score).
- Cash flow +15.1/30.0
- ARV discount +7.2/15.0
- DSCR +4.6/10.0
- Livability +3.9/5.0
- Rent growth +3.5/5.0
- 1% rule +3.0/10.0
- Condition / age +2.5/5.0
- Schools +2.3/10.0
- Appreciation +0.0/10.0
$220,000
🖨 Deal sheet (PDF) 📄 Offer letter ✓ Due diligence
Listing remarks MLS
Add this over/under duplex into your portfolio today! The first floor is currently occupied and the second floor unit just had a turn and will be rented prior to sale (unless a buyer would like it vacant). Tenants pay for their own electric. Heat is currently central. And water is passed on to tenants thru a RUBs program. The units are all City inspected/licensed and LEAD Certified. The Seller is offering 3% seller assistance with an accepted contract. Call today for more information.
Key facts
- Flat roof
- Shingle roof
- Replaced gutters
Tags
Property features AI
Finance
- Other: Fee simple ownership
Exterior
- Parking: Four total garage/parking spaces; Driveway with four spaces; On-street parking available
- Utilities: Public water service; Public sewer service; Electric service for cooling and hot water; Natural gas for heating
- Home design: Detached property; Above-grade and below-grade living areas; Below-grade finished and unfinished space
- Construction: Brick construction; Stone foundation with crawl space; Originally assessed year built by assessor
- Exterior features: Public water; Public sewer; Ground rent paid annually; Located inside city limits (Hagerstown)
Interior
- Kitchen: Microwave; Refrigerator; Stove
- Bedrooms: Two one-bedroom units (multi-unit configuration)
- Flooring: Carpet; Luxury vinyl plank
- Heating & cooling: Forced air heating (natural gas); Window air conditioning units (electric); Electric hot water
- Interior features: 32"+ wide doors for improved accessibility
Neighborhood map
What this means for you Summary
Snapshot
- This is a 4-bed/1.5-bath single-family listed at $220k.
Deal economics
- At list price, monthly cash flow is $72 ($862/yr) — positive.
- The deal already cash-flows at list — no discount required.
- To meet the 1% rule (rent ≥ 1% of price), the offer needs to be $177k (19.6% below list).
- Recommended offer: $177k (19.6% below list) — sets the bar for 1% rule.
- Cap rate 6.7% vs local median 4.4% in Hagerstown — top-decile yield for the area; either an underpriced asset or a hidden risk that comps aren't pricing in. Stress-test before assuming the spread holds.
Location & tenants
- Location reads 77/100 on livability (#83 in MD, #3,170 nationally) — a middle-class / working-renter tenant base. Strengths: commute A+, cost of living A+, health & safety A+; Watch: crime F, employment F.
- Washingtion County Public Schools (suburban): math 18% / reading 33% proficiency, ranked #13 of 24 in MD (top 54%) — low school quality limits family demand, transient renter base, plan for 1-2y turnover.
- Zoned schools: Ruth Ann Monroe Primary (567 students, 80% FRL); Western Heights Middle (math 6% / reading 30%, grade F, #165 of 225 statewide, top 75%, 903 students, 77% FRL); South Hagerstown High (math 30% / reading 63%, grade D-, #118 of 222 statewide, top 54%, 1,487 students, 78% FRL) — zoned schools average 78% FRL vs 39% district-wide (39 pts higher); higher-poverty schools than district average — tighter screening recommended.
- Market conditions: Rents rising fast (+4.0%/yr); 383 active listings in the ZIP; 25 comparable units currently listed for rent nearby; rentals lingering (median 46d on market — plan ~5-8 weeks vacancy on turnover, expect pricing pressure); 52% of comp listings sitting > 30 days — soft ceiling on asking rent; 232 units permitted in Washington County in 2024 (12 in 5+ unit buildings).
- This rent runs 34% of the median local income ($63k/yr) — at the standard rent-burdened threshold; future hikes will face affordability resistance.
Forward outlook
- Local home prices are declining (-3.0%/yr); year-one equity from $2k of loan paydown is wiped out by about $7k of value loss. Plan a longer hold.
Negotiation context
- Only 4 days on market — expect competitive offers; lowballing is unlikely to land.
- 3 sale attempts since 23y ago; this cycle's ask is 16% above the opening price — seller raised mid-cycle; expect resistance to lowballs.
- Current owner paid $185k; 19% above their basis — modest negotiation headroom, anchor on the comps not their cost.
Risks & watch-outs
- Watch-outs: built in 1904 — expect roof / HVAC / electrical / plumbing capex.
- Climate carrying-cost: extreme-heat days projected 7→16/yr by 2055 (HVAC capex compounding) — expect insurance premiums to compound above CPI over the hold.
Questions for the listing agent
- Built in 1904 — when were the roof, HVAC, electrical panel, plumbing, and water heater last replaced?
- Is there a deadline driving the sale (1031 exchange, divorce, estate, relocation)? That informs how much negotiation room exists.
- Crime grade is F in this area — have there been break-ins, vandalism, or insurance claims at this property in the last 3 years? What carrier currently insures it and at what premium?
- The area grade is low — what's the realistic commute time and amenity access for the typical tenant pool here? Any planned neighborhood developments (good or bad) we should know about?
- What's the average days-on-market for RENTAL listings here right now (not sales)? A rising rental-DOM trend means longer vacancies and softer asking-rent achievability than the comps imply.
- What's the recent tenant-quality profile in this submarket — average credit score on applications, eviction rate, late-payment / NSF rate, and stable-employment percentage? A property-management company in the area should have these aggregated.
- How much new for-sale + rental construction is in the pipeline within 1–3 miles? Heavy new supply typically softens prices + rents 12–24 months out; constrained supply supports both.
Investment metrics
- 1% rule
- 0.80% ✗
- Cap rate
- 6.68%
- Cash-on-cash
- 1.40%
- DSCR
- 1.06
- GRM
- 10.4
CMA / ARV
- ARV (on-the-fly)
- $218,708
- Comps found
- 12
Show comp detail 12 sales within ~0.75 mi
| Address | Dist | Beds/Ba | Sqft | Sold | Price | $/sf | Match |
|---|---|---|---|---|---|---|---|
| 527 W Church St | 0.18mi | 3/2.0 (-1) | 1,456 (-3%) | 4mo | $200,000 | $137 | 77 |
| 320 N Prospect St | 0.44mi | 4/1.5 | 1,558 (+4%) | 2mo | $163,000 | $105 | 71 |
| 217 James St | 0.13mi | 3/1.0 (-1) | 1,350 (-10%) | 1mo | $100,000 | $74 | 69 |
| 116 Bethel St | 0.51mi | 3/2.0 (-1) | 1,538 (+3%) | 2mo | $87,500 | $57 | 63 |
| 1321 Marshall St | 0.57mi | 3/1.5 (-1) | 1,525 (+2%) | 3mo | $200,000 | $131 | 63 |
| 239 Devonshire Rd NE | 0.43mi | 3/1.0 (-1) | 1,544 (+3%) | 6mo | $226,000 | $146 | 63 |
| 367 Devonshire Rd | 0.42mi | 3/1.5 (-1) | 1,390 (-7%) | 2mo | $328,000 | $236 | 62 |
| 1072 Kasinof Ave | 0.61mi | 4/2.0 | 1,572 (+5%) | 4mo | $328,000 | $209 | 58 |
| 14 Avalon Ave | 0.48mi | 3/1.0 (-1) | 1,398 (-7%) | 4mo | $180,000 | $129 | 56 |
| 70 Nottingham Rd | 0.58mi | 4/3.5 | 1,680 (+12%) | 2mo | $327,000 | $195 | 44 |
| 1362 Connecticut Ave | 0.67mi | 3/2.0 (-1) | 1,352 (-10%) | 4mo | $300,000 | $222 | 42 |
| 1355 Connecticut Ave | 0.66mi | 3/2.0 (-1) | 1,352 (-10%) | 6mo | $299,900 | $222 | 41 |
Match score weights: distance 35% · size 25% · config 20% · recency 20%. Top-matched comps best support the ARV.
Projected returns pro-forma
-3.0% appreciation · 4.0% rent growth · sell at horizon
- IRR
- -13.1%
- Equity multiple
- 0.52×
- Total profit
- $-29,373
- Equity at exit
- $32,803
- IRR
- -2.9%
- Equity multiple
- 0.80×
- Total profit
- $-12,543
- Equity at exit
- $19,022
Cash invested: $61,600 (down + closing). Projections, not guarantees.
Landlord ↔ Tenant lean methodology
- Overall (STATE)
- 27 Tenant-Leaning
- State Maryland
- 27 Tenant-Leaning · D+14
- County
- — inherits STATE
- City
- — inherits STATE
ZIP-level market 21740
- Rents YoY
- 4.0%
- Active inventory
- 383
- Price-to-rent
- 10.4×
Monthly cashflow live
- Estimated rent
- $1,768 high interval (Pro) →
- Mortgage (P&I)
- −$1,154
- Tax from tax record
- −$80 /mo · $955/yr
- Insurance
- −$92
- HOA
- −$0
- Vacancy / Maint / Mgmt
- −$371
- Net cashflow
- $72
Break-even live
Sensitivity live
| Price | -10% $196 | -5% $134 | +0% $72 | +5% $10 | +10% $-53 |
|---|---|---|---|---|---|
| Rent | -10% $-68 | -5% $2 | +0% $72 | +5% $142 | +10% $211 |
| Rate | -1.0pp $183 | -0.5pp $128 | base $72 | +0.5pp $15 | +1.0pp $-43 |
UW: 25.0% down · 7.5% · 30yr · 1.5% tax · 5.0% vac · 8.0% maint · 8.0% mgmt
Financing live
Cash to close
- Down payment
- $55,000
- Closing costs
- $6,600
- Reserves months
- —
- Total cash needed
- —
Loan-product check · same deal, 3 products live
Conventional
25% down · 7.5% · 30yr
- Down + closing
- —
- Monthly P&I
- —
- Monthly cashflow
- —
- DSCR
- —
- Eligible?
- —
Personal DTI + credit; lowest rate.
DSCR
20% down · 8.5% · 30yr
- Down + closing
- —
- Monthly P&I
- —
- Monthly cashflow
- —
- DSCR
- —
- Eligible?
- —
No personal income docs; deal must DSCR.
Hard money
10% down · 12.0% · 12mo
- Down + closing
- —
- Monthly P&I
- —
- Monthly cashflow
- —
- DSCR
- —
- Eligible?
- —
Short-term bridge; refi at stabilization.
Rent comps 25 comps
| Address | Beds | Baths | Sqft | Rent | $/sqft | DOM | Units | Dist |
|---|---|---|---|---|---|---|---|---|
| 607 Salem Ave Hagerstown, MD | 4.0 | 1.0 | 1344 | $1,775 | $1.32 | 45d | 1 | 0.03mi |
| 616 George St Hagerstown, MD | 3.0 | 1.0 | 1034 | $1,600 | $1.55 | 45d | 1 | 0.15mi |
| 421 Salem Ave Hagerstown, MD | 3.0 | 1.0 | 1256 | $1,550 | $1.23 | 22d | 1 | 0.23mi |
| 464 Peleton St Hagerstown, MD | 3.0 | 2.0 | 1253 | $2,025 | $1.62 | 15d | 1 | 0.30mi |
| 812 Dale St Hagerstown, MD | 3.0 | 1.0 | 1064 | $1,730 | $1.63 | 45d | 1 | 0.34mi |
| 836 W Washington St Hagerstown, MD | 5.0 | 1.5 | 1600 | $1,950 | $1.22 | 15d | 1 | 0.49mi |
| 62 Bethel St Hagerstown, MD | 3.0 | 1.5 | 1088 | $1,700 | $1.56 | 45d | 1 | 0.55mi |
| 92 W Washington St Unit 410 Hagerstown, MD | 3.0 | 1.5 | 1415 | $1,795 | $1.27 | 45d | 1 | 0.62mi |
| 104 Buena Vista Ave Unit 104 Hagerstown, MD | 3.0 | 1.0 | 1100 | $1,400 | $1.27 | 45d | 1 | 0.67mi |
| 42 E Franklin St Hagerstown, MD | 3.0 | 1.5 | 1200 | $1,350 | $1.12 | 45d | 1 | 0.79mi |
| 307 N Locust St Hagerstown, MD | 3.0 | 1.0 | 1140 | $1,490 | $1.31 | 45d | 1 | 0.82mi |
| 210 N Locust St Hagerstown, MD | 3.0 | 1.0 | 1476 | $1,275 | $0.86 | 22d | 1 | 0.83mi |
| 60 E Washington St Apt 1E Hagerstown, MD | 3.0 | 1.5 | 1300 | $1,500 | $1.15 | 22d | 1 | 0.86mi |
| 103 E Washington St Unit 1E Hagerstown, MD | 3.0 | 1.0 | 1200 | $1,200 | $1.00 | 15d | 1 | 0.90mi |
| 109 Fairground Ave Hagerstown, MD | 3.0 | 1.0 | 1470 | $1,600 | $1.09 | 15d | 1 | 0.93mi |
| 322 N Cannon Ave Hagerstown, MD | 3.0 | 1.5 | 1488 | $1,800 | $1.21 | 15d | 1 | 1.00mi |
| 311 Jefferson St Unit 311 Hagerstown, MD | 3.0 | 1.5 | 1200 | $1,550 | $1.29 | 45d | 1 | 1.03mi |
| 805 Mulberry Ave Hagerstown, MD | 3.0 | 1.5 | 1584 | $1,830 | $1.16 | 45d | 1 | 1.05mi |
| 338 S Locust St Hagerstown, MD | 3.0 | 1.5 | 1320 | $1,600 | $1.21 | 22d | 1 | 1.12mi |
| 124 Ray St Hagerstown, MD | 3.0 | 1.0 | 960 | $1,500 | $1.56 | 22d | 1 | 1.16mi |
| 1319 The Ter Hagerstown, MD | 3.0 | 2.0 | 1589 | $2,500 | $1.57 | 45d | 1 | 1.28mi |
| 313 Frederick St Unit 313 Hagerstown, MD | 3.0 | 1.5 | 1650 | $2,500 | $1.52 | 45d | 1 | 1.31mi |
| 313 Frederick St Hagerstown, MD | 3.0 | 1.5 | 1650 | $2,500 | $1.52 | 45d | 1 | 1.31mi |
| 1401 Haven Rd Hagerstown, MD | 1.0–3.0 | 1.0–1.5 | 925 | $1,999 | $2.16 | 15d | 11 | 1.32mi |
| 837 Virginia Ave Hagerstown, MD | 3.0 | 2.0 | 1400 | $2,000 | $1.43 | 15d | 1 | 1.49mi |
Listing history 4 events
-
2026-06-22days on market $220,000 Active 4 DOM
-
2026-06-18status $220,000 Active 1 DOM
-
2026-06-16remarks 699-char remark
-
2026-06-16$220,000 Coming Soon 1 DOM
ⓘ Source: listings_history table (triggers on properties + properties_extension) + one-shot
backfill from property_details.listing_events for pre-trigger history.
Tax reassessment forecast MD · Partial reset (capped growth)
- Current annual tax
- $955 · $80/mo
- Projected year-2 tax
- $1,676 · $140/mo
- Expected delta
- +$722/yr (+$60/mo · 75.6%)
ⓘ Screening estimate from a state-policy table — verify with the county assessor before closing.
Climate risk First Street
- Flood 4/10 Moderate FEMA zone X (unshaded) · 22% chance over 30 yrs
- Wildfire 1/10 Low
- Heat 5/10 Major 7 d/yr ≥101°F today · 16 d/yr by 30 yrs out
- Wind 2/10 Low 2% chance of damaging wind over 30 yrs
- Air quality 1/10 Low 0 unhealthy d/yr today · 0 by 30 yrs out
Nearby sold comps map
Loading sold comps map…
Walkable amenities ~0.75 mi
Loading nearby amenities…
Taxation est. · year 1
- Rental income
- $21,216
- − Mortgage interest
- −$12,323
- − Property taxes
- −$955
- − Insurance
- −$1,100
- − Repairs & maintenance
- −$1,697
- − Management
- −$1,697
- − Depreciation
- −$6,400
- Taxable loss
- −$2,956
- Est. tax savings @ 24.0%
- +$710
- After-tax cash flow
- $1,571/yr
For passive investors: Depreciation is non-cash, so a rental often shows a tax loss while cash-flowing — sheltering income. Rental losses are passive: they offset passive income freely, and up to $25,000/yr can offset ordinary (W-2) income if you actively participate and your MAGI is under $100k (phasing out to $0 by $150k); unused losses carry forward. On sale, claimed depreciation is recaptured at up to 25%, and gains may owe capital-gains tax (a 1031 exchange can defer both). Figures are a year-1 estimate at your 24.0% rate — not tax advice; consult a CPA.
Schools (NCES district)
- District
- Washingtion County Public Schools
- NCES district ID
- 2400660
- Math proficiency
- 18% ▼ -20.00%
- Reading proficiency
- 33% ▼ -17.00%
- Median HH income
- $54,784
- Composite
- 22.87/100
- National rank
- #8007
- State rank
- #13 of 24 in MD
Livability — Hagerstown
- Score
- 77/100
- State rank
- #83
- US rank
- #3170
Category grades
Schools grade is shown separately in the Schools card above.
Census & demographics
- Census place
- Hagerstown, MD
- County
- Washington County · 98,861 people
- City population
- 64,792
- Metro
- Hagerstown-Martinsburg, MD-WV
- Population (ZIP)
- 64,792
- Household income
- $62,873
- Rent vs Own
- Severe rent burden
- 2832.0
Population outlook (Washington County) Hauer SSP2
- Today (2025)
- 151,614 people
- By 2030
- 151,455 · -0.1%
- By 2040
- 150,097 · -1.0%
- By 2050
- 148,193 · -2.3%
- By 2075
- 146,581 · -3.3%
- By 2100
- 138,025 · -9.0%
Race, ethnicity, and origin ACS 2023
- Neighborhood character
- Majority White (64%)
- Race & ethnicity
- White 64% Black 18% Two or more races 10% Hispanic / Latino 10% Asian 2%
- Hispanic origin (detail)
- Mexican 2% Puerto Rican 2% Dominican 2%
- Common ancestry
- Romanian 2% Lithuanian 1% Slovak 1%
- Foreign-born
- 9% · Canada, China
- Languages at home
- 86% English-only · Spanish 9% French/Haitian/Cajun 1% Chinese 1%
Political lean MEDSL · Washington
- 2024 margin
- Strong R (+23.0) · D 37.3% · R 60.4% · Other 2.3%
- 2008→2024 swing
- -10.2pp toward R · 2008: -12.9pp · 2024: -23.0pp
- All cycles
- 2024: R+23.0 2020: R+20.9 2016: R+32.4 2012: R+18.5 2008: R+12.9
Not yet ingested
- Civics
- —
Market trends
- HPI YoY
- ▼ -248.38%
- Current HPI
- 264.8018
- Rent YoY
- ▲ 4.00%
- Metro
- Hagerstown-Martinsburg, MD-WV
- State GDP YoY
- ▲ 2.97%
- F500 in state
- 12
Industry mix (Fortune 500 HQ in MD)
| Industry | F500 HQs | Revenue |
|---|---|---|
| Aerospace / Defense | 1 | $71B |
|
||
| Utilities | 1 | $25B |
|
||
| Hotels | 1 | $24B |
|
||
| Consumer Goods | 1 | $7B |
|
||
| Real Estate | 1 | $6B |
|
||
| Chemicals | 1 | $2B |
|
||
Price history
+279.3% since first listed17 events — show timeline
- 2026-06-16 Coming Soon $220,000 BRIGHT MLS
- 2023-09-06 Sold (Public Records) $185,000 Public Records
- 2023-08-31 Sold (MLS) $188,000 BRIGHT MLS
- 2023-07-26 Pending — BRIGHT MLS
- 2023-07-06 Price Changed $188,000 BRIGHT MLS
- 2023-06-30 Price Changed $188,500 BRIGHT MLS
- 2023-06-16 Listed $189,000 BRIGHT MLS
- 2023-06-06 Coming Soon $189,000 BRIGHT MLS
- 2020-03-18 Sold (Public Records) $55,000 Public Records
- 2020-03-18 Sold (Public Records) $55,000 Public Records
- 2004-12-31 Sold (MLS) $80,500 MRIS
- 2004-12-28 Sold (Public Records) $80,500 Public Records
- 2004-11-11 Delisted — MRIS
- 2004-09-23 Listed $84,900 MRIS
- 2003-10-30 Delisted — MRIS
- 2003-04-24 Listed — MRIS
- 1991-09-30 Sold (Public Records) $58,000 Public Records
Property tax history
-3.5%/yrLatest (2025): $955 · +9.4% YoY. Source: county tax records.
Cash-flow waterfall
monthlySold comps — $/sqft
last 12 mo · ≤1 miLoading sold comps…