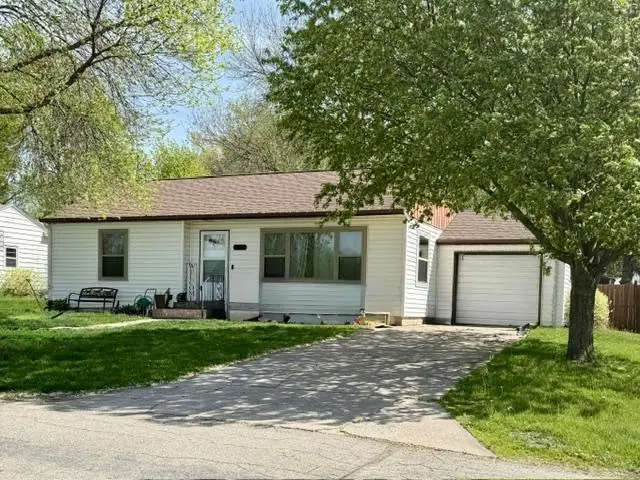
361 N Park Dr · Morton, MN
Flood risk 1/10 · Minimal
- FEMA flood zone
- X (unshaded)
- Chance of flooding over 30 yrs
- 0.0%
- Est. flood insurance / yr
- $473 – $860
Fire risk 3/10 · Minor
- Est. fire insurance / yr
- $888 – $1,650
Heat risk 2/10 · Minimal
- Hot days now (above 100°F)
- 7 days/yr
- Hot days in 30 yrs
- 14 days/yr
Wind risk 2/10 · Minimal
- Chance of severe wind over 30 yrs
- —
Air-quality risk 2/10 · Minimal
- Unhealthy air days now
- 0 days/yr
- Unhealthy air days in 30 yrs
- 2 days/yr
Risk factors via First Street. Map © Google.
Why this score? — see what drove the D grade
The composite is a weighted blend of 9 inputs, each scored 0–100. Each bar is that input's sub-score; the figure is the points it added to the 100-point composite (weight × sub-score).
- Cash flow +9.1/30.0
- Appreciation +8.1/10.0
- ARV discount +7.5/15.0
- Schools +3.6/10.0
- Livability +3.2/5.0
- DSCR +2.5/10.0
- Rent growth +2.5/5.0
- Condition / age +2.5/5.0
- 1% rule +2.2/10.0
$119,900
🖨 Deal sheet 📄 Offer letter ✓ Due diligence
Listing remarks MLS
NA
Key facts
- 9,757 sq ft lot
- 3 garage spots
- Built 1951
Property features AI
Exterior
- Parking: Attached garage; 3 garage spaces; Garage dimensions: 12x22 and 20x24; Garage door 7' high by 9' wide
- Utilities: City water connected; City sewer connected; Propane fuel; Electric: 100 amp service with circuit breakers (Xcel Energy)
- Home design: Residential property; One level
- Construction: Block foundation; Foundation dimensions 36x26; Asphalt roof (over 8 years old)
- Exterior features: Rear porch; Vinyl exterior; Tree coverage - medium; Garage(s); Storage shed
Interior
- Kitchen: Dishwasher; Range
- Bedrooms: 2 bedrooms
- Bathrooms: 1 full bathroom
- Heating & cooling: Forced air heating; Central air conditioning
- Interior features: Dishwasher; Range; Electric water heater; Rented water softener; Full basement with block foundation, egress window(s), and sump pump
- Laundry & utility: Laundry in basement
Neighborhood map
What this means for you Summary
Snapshot
- This is a 2-bed/1.0-bath single-family listed at $120k.
Deal economics
- At list price, monthly cash flow is $-93 ($-1k/yr) — negative.
- To cash-flow at today's rent, offer at most $103k (13.7% below list).
- To meet the 1% rule (rent ≥ 1% of price), the offer needs to be $86k (28.3% below list).
- Recommended offer: $86k (28.3% below list) — sets the bar for 1% rule.
Location & tenants
- Location reads 64/100 on livability (#613 in MN) — a middle-class / working-renter tenant base. Strengths: cost of living A+, housing A+; Watch: health & safety D+, crime D, schools F.
- Redwood Area School District (town): math 39% / reading 46% proficiency, ranked #207 of 301 in MN (top 69%) — families likely to look elsewhere, expect single-tenant / working-renter base with shorter leases.
- Market conditions: 2 active listings in the ZIP; 17 units permitted in Renville County in 2024 (0 in 5+ unit buildings).
Forward outlook
- In year one you build about $8k of equity ($829 loan paydown + $7k appreciation (6.1% local appreciation)).
- Renville County population projected at -28% by 2050 — secular population decline; favor cash flow + early exit over multi-decade hold.
- By year 5, paydown + projected appreciation supports a ~$36k cash-out refi (75% LTV) — recoverable capital for the next deal without selling this one.
Negotiation context
- Only 5 days on market — expect competitive offers; lowballing is unlikely to land.
- 3 sale attempts since 14y ago with the ask held roughly flat each time — persistent listings suggest the price (not the market) is what's stuck; bring a comps-based counter.
- Current owner paid $54k; list at $120k implies a 122% gain — meaningful room to come down on a strong offer.
Risks & watch-outs
- Watch-outs: built in 1951 — expect roof / HVAC / electrical / plumbing capex.
Questions for the listing agent
- What do current leases actually rent for vs. the listed asking? Can we see a recent rent roll and the last 12 months of T-12 income?
- Built in 1951 — when were the roof, HVAC, electrical panel, plumbing, and water heater last replaced?
- Is there a deadline driving the sale (1031 exchange, divorce, estate, relocation)? That informs how much negotiation room exists.
- Schools are F-rated, which usually means shorter tenancies and higher turnover. Who's the typical renter profile here, and what's been the actual vacancy rate?
- Crime grade is D in this area — have there been break-ins, vandalism, or insurance claims at this property in the last 3 years? What carrier currently insures it and at what premium?
- The area grade is low — what's the realistic commute time and amenity access for the typical tenant pool here? Any planned neighborhood developments (good or bad) we should know about?
- What's the average days-on-market for RENTAL listings here right now (not sales)? A rising rental-DOM trend means longer vacancies and softer asking-rent achievability than the comps imply.
- What's the recent tenant-quality profile in this submarket — average credit score on applications, eviction rate, late-payment / NSF rate, and stable-employment percentage? A property-management company in the area should have these aggregated.
- How much new for-sale + rental construction is in the pipeline within 1–3 miles? Heavy new supply typically softens prices + rents 12–24 months out; constrained supply supports both.
Investment metrics
- 1% rule
- 0.72% ✗
- Cap rate
- 5.36%
- Cash-on-cash
- -3.33%
- DSCR
- 0.85
- GRM
- 11.6
CMA / ARV
No comps found within radius.
Projected returns pro-forma
6.13% appreciation · 3.0% rent growth · sell at horizon
- IRR
- 13.0%
- Equity multiple
- 1.88×
- Total profit
- $29,583
- Equity at exit
- $76,350
- IRR
- 13.5%
- Equity multiple
- 3.72×
- Total profit
- $91,379
- Equity at exit
- $139,306
Cash invested: $33,572 (down + closing). Projections, not guarantees.
Landlord ↔ Tenant lean methodology
- Overall (STATE)
- 46 Balanced
- State Minnesota
- 46 Balanced · D+2
- County
- — inherits STATE
- City
- — inherits STATE
ZIP-level market 56270
- Home prices YoY
- 4.8%
- Active inventory
- 2
- Price-to-rent
- 11.6×
Monthly cashflow live
- Estimated rent
- $860 medium interval (Pro) →
- Mortgage (P&I)
- −$629
- Tax from tax record
- −$94 /mo · $1,126/yr
- Insurance
- −$50
- HOA
- −$0
- Vacancy / Maint / Mgmt
- −$181
- Net cashflow
- $-93
Break-even live
UW: 25.0% down · 7.5% · 30yr · 1.5% tax · 5.0% vac · 8.0% maint · 8.0% mgmt
Financing live
Cash to close
- Down payment
- $29,975
- Closing costs
- $3,597
- Reserves months
- —
- Total cash needed
- —
Loan-product check · same deal, 3 products live
Conventional
25% down · 7.5% · 30yr
- Down + closing
- —
- Monthly P&I
- —
- Monthly cashflow
- —
- DSCR
- —
- Eligible?
- —
Personal DTI + credit; lowest rate.
DSCR
20% down · 8.5% · 30yr
- Down + closing
- —
- Monthly P&I
- —
- Monthly cashflow
- —
- DSCR
- —
- Eligible?
- —
No personal income docs; deal must DSCR.
Hard money
10% down · 12.0% · 12mo
- Down + closing
- —
- Monthly P&I
- —
- Monthly cashflow
- —
- DSCR
- —
- Eligible?
- —
Short-term bridge; refi at stabilization.
Listing history 10 events
-
2026-05-20status Pending
-
2026-05-15historical Contingent - Inspection
-
2026-05-14$119,900 Active
-
2019-02-02historical 2-char remark
Show marketing remark (2 chars)
NA
-
2012-11-05soldstatus $54,000
-
2012-10-31soldstatus $54,000 2-char remark
Show marketing remark (2 chars)
NA
-
2012-10-31soldstatus $54,000 2-char remark
Show marketing remark (2 chars)
NA
-
2012-08-20$54,900 2-char remark
Show marketing remark (2 chars)
NA
-
2012-08-20$54,900 2-char remark
Show marketing remark (2 chars)
NA
-
2004-11-15soldstatus $40,000
ⓘ Source: listings_history table (triggers on properties + properties_extension) + one-shot
backfill from property_details.listing_events for pre-trigger history.
Tax reassessment forecast MN · Partial reset (capped growth)
- Current annual tax
- $1,126 · $94/mo
- Projected year-2 tax
- $1,234 · $103/mo
- Expected delta
- +$108/yr (+$9/mo · 9.6%)
ⓘ Screening estimate from a state-policy table — verify with the county assessor before closing.
Climate risk First Street
- Flood 1/10 Low FEMA zone X (unshaded) · 0% chance over 30 yrs
- Wildfire 3/10 Moderate
- Heat 2/10 Low 7 d/yr ≥100°F today · 14 d/yr by 30 yrs out
- Wind 2/10 Low
- Air quality 2/10 Low 0 unhealthy d/yr today · 2 by 30 yrs out
Nearby sold comps map
Loading sold comps map…
Walkable amenities ~0.75 mi
Loading nearby amenities…
Taxation est. · year 1
- Rental income
- $10,321
- − Mortgage interest
- −$6,716
- − Property taxes
- −$1,126
- − Insurance
- −$600
- − Repairs & maintenance
- −$826
- − Management
- −$826
- − Depreciation
- −$3,488
- Taxable loss
- −$3,260
- Est. tax savings @ 24.0%
- +$782
- After-tax cash flow
- $-335/yr
For passive investors: Depreciation is non-cash, so a rental often shows a tax loss while cash-flowing — sheltering income. Rental losses are passive: they offset passive income freely, and up to $25,000/yr can offset ordinary (W-2) income if you actively participate and your MAGI is under $100k (phasing out to $0 by $150k); unused losses carry forward. On sale, claimed depreciation is recaptured at up to 25%, and gains may owe capital-gains tax (a 1031 exchange can defer both). Figures are a year-1 estimate at your 24.0% rate — not tax advice; consult a CPA.
Schools (NCES district)
- District
- Redwood Area School District
- NCES district ID
- 2700182
- Math proficiency
- 39% ▼ -14.00%
- Reading proficiency
- 46% ▼ -12.00%
- Median HH income
- $45,326
- Composite
- 36.1/100
- National rank
- #4756
- State rank
- #207 of 301 in MN
Livability — Morton
- Score
- 64/100
- State rank
- #613
- US rank
- #14608
Category grades
Schools grade is shown separately in the Schools card above.
Census & demographics
- Census place
- Morton, MN
- Population (ZIP)
- 1,208
Population outlook (Renville County) Hauer SSP2
- Today (2025)
- 13,251 people
- By 2030
- 12,443 · -6.1%
- By 2040
- 10,946 · -17.4%
- By 2050
- 9,598 · -27.6%
- By 2075
- 7,411 · -44.1%
- By 2100
- 5,768 · -56.5%
Race, ethnicity, and origin ACS 2023
- Neighborhood character
- Diverse neighborhood (Simpson 0.70)
- Race & ethnicity
- White 54% Native American 38% Hispanic / Latino 10% Two or more races 6% Asian 1%
- Hispanic origin (detail)
- Mexican 10%
- Common ancestry
- Portuguese 11% Iranian 2% Romanian 2%
- Foreign-born
- 1%
- Languages at home
- 92% English-only · Other Asian/Pacific 1% Spanish 1%
Political lean MEDSL · Renville
- 2024 margin
- Solid R (+41.4) · D 28.4% · R 69.8% · Other 1.9%
- 2008→2024 swing
- -40.8pp toward R · 2008: -0.6pp · 2024: -41.4pp
- All cycles
- 2024: R+41.4 2020: R+36.5 2016: R+36.7 2012: R+9.8 2008: R+0.6
Not yet ingested
- Civics
- —
Market trends
- HPI YoY
- ▲ 6.13%
- Current HPI
- 134.6517
- Rent YoY
- —
- Metro
- —
- State GDP YoY
- ▲ 2.41%
- F500 in state
- 34
Industry mix (Fortune 500 HQ in MN)
| Industry | F500 HQs | Revenue |
|---|---|---|
| Healthcare | 2 | $407B |
|
||
| Retail | 2 | $150B |
|
||
| Consumer Goods | 2 | $32B |
|
||
| Industrial Machinery | 2 | $6B |
|
||
| Agriculture | 1 | $40B |
|
||
| Healthcare / Medical Devices | 1 | $32B |
|
||
Price history
+199.8% since first listed10 events — show timeline
- 2026-05-20 Pending — NORTHSTARMLS as Distributed by MLS Grid
- 2026-05-15 Contingent — NORTHSTARMLS as Distributed by MLS Grid
- 2026-05-14 Listed $119,900 NORTHSTARMLS as Distributed by MLS Grid
- 2019-02-02 Listing Removed — NORTHSTARMLS as Distributed by MLS Grid
- 2012-11-05 Sold (Public Records) $54,000 Public Records
- 2012-10-31 Sold (MLS) $54,000 NORTHSTARMLS as Distributed by MLS Grid
- 2012-10-31 Sold (MLS) $54,000 NORTHSTARMLS as Distributed by MLS Grid
- 2012-08-20 Listed $54,900 NORTHSTARMLS as Distributed by MLS Grid
- 2012-08-20 Listed $54,900 NORTHSTARMLS as Distributed by MLS Grid
- 2004-11-15 Sold (Public Records) $40,000 Public Records
Property tax history
+4.5%/yrLatest (2026): $1,126 · +14.0% YoY. Source: county tax records.
Cash-flow waterfall
monthlySold comps — $/sqft
last 12 mo · ≤1 miLoading sold comps…