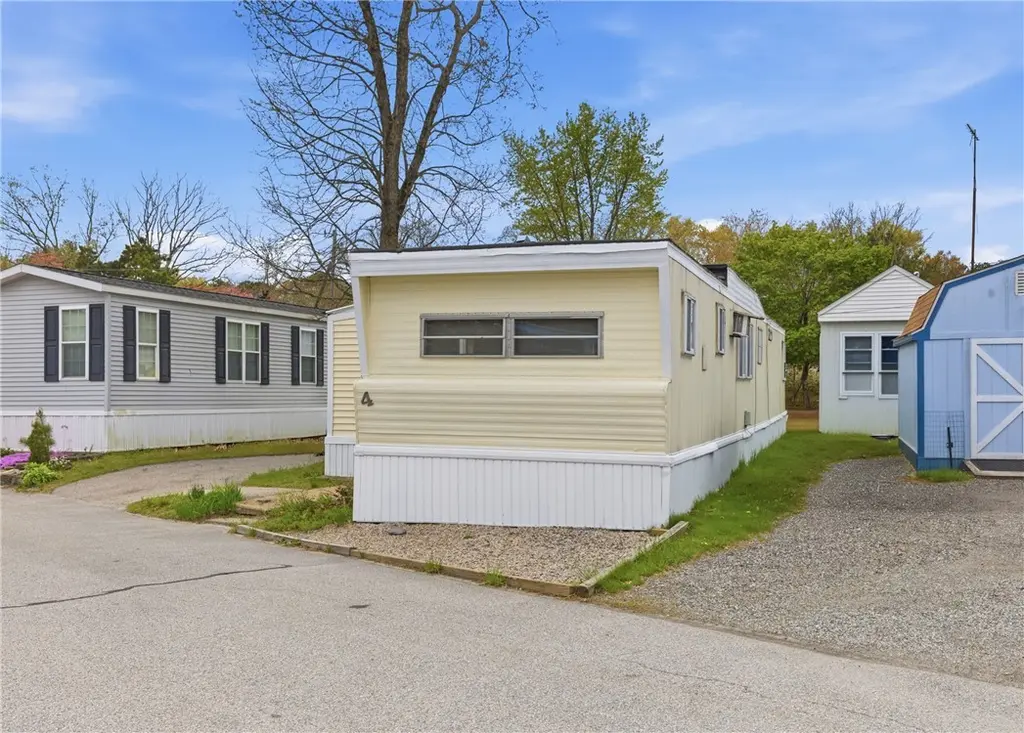
4 Lane 3 Ln · Coventry, RI
Flood risk No data
- FEMA flood zone
- —
- Chance of flooding over 30 yrs
- —
- Est. flood insurance / yr
- —
Fire risk No data
- Est. fire insurance / yr
- —
Heat risk No data
- Hot days now (above threshold)
- —
- Hot days in 30 yrs
- —
Wind risk No data
- Chance of severe wind over 30 yrs
- —
Air-quality risk No data
- Unhealthy air days now
- —
- Unhealthy air days in 30 yrs
- —
Risk factors via First Street. Map © Google.
Why this score? — see what drove the B- grade
The composite is a weighted blend of 9 inputs, each scored 0–100. Each bar is that input's sub-score; the figure is the points it added to the 100-point composite (weight × sub-score).
- Cash flow +30.0/30.0
- 1% rule +10.0/10.0
- DSCR +10.0/10.0
- ARV discount +7.5/15.0
- Schools +3.0/10.0
- Rent growth +2.5/5.0
- Livability +2.5/5.0
- Condition / age +2.5/5.0
- Appreciation +0.0/10.0
$95,000
🖨 Deal sheet 📄 Offer letter ✓ Due diligence
Listing remarks
Welcome to 4 Lane Three, Coventry, RI a beautifully refreshed 2-bedroom, 1-bathroom mobile home offering comfortable, move-in ready living in the sought-after Maple Root Community. This inviting home features a spacious open-concept layout with a large kitchen perfect for cooking and entertaining, flowing seamlessly into a generous living area. Two enclosed porches provide versatile bonus space for seasonal enjoyment, while the spacious bathroom offers ample functionality. Outside, you'll appreciate the convenience of an included storage shed for all your outdoor equipment and belongings. Located in the well-maintained Maple Root Community, this refreshed home is ready for you to move in
Key facts
- Enclosed porches
- Large kitchen
- Storage shed
Tags
Property features AI
Finance
- Other: Assessed value $67,700
- Financial info: Annual taxes (2025): $1,089
- HOA & community: Association fee $418 monthly; Has land lease
Exterior
- Parking: No garage; 2 parking spaces (total)
- Utilities: 100 amp electric service; Water tap fee
- Home design: Single-story home; Above-grade finished area: 672
- Construction: Built with vinyl siding and drywall
- Exterior features: Vinyl siding; Drywall interior walls
Interior
- Bedrooms: 5 total rooms (includes bedrooms and living spaces)
- Flooring: Laminate
- Bathrooms: 1 full bathroom
- Heating & cooling: Forced air heating; Oil heating; Has heating
- Interior features: Laminate flooring; Electric water heater
Neighborhood map
What this means for you Summary
Snapshot
- This is a 2-bed/1.0-bath manufactured listed at $95k.
Deal economics
- At list price, monthly cash flow is $390 ($5k/yr) — positive.
- The deal already cash-flows at list — no discount required.
- Meets the 1% rule at list price ($2k rent vs $95k).
- Recommended offer: $94k (1.5% below list) — sets the bar for market timing.
Location & tenants
- Location reads: area grade B — affects rentability + tenant quality, not the cash-flow math above.
- Coventry (suburban): math 25% / reading 41% proficiency, ranked #19 of 39 in RI (top 49%) — families likely to look elsewhere, expect single-tenant / working-renter base with shorter leases.
- Market conditions: 176 active listings in the ZIP; 1 comparable units currently listed for rent nearby; solid renter incomes; 471 units permitted in Kent County in 2024 (240 in 5+ unit buildings).
Forward outlook
- Local home prices are declining (-3.0%/yr); year-one equity from $657 of loan paydown is wiped out by about $3k of value loss. Plan a longer hold.
- Kent County population projected at -14% by 2050 — secular population decline; favor cash flow + early exit over multi-decade hold.
- At projected returns (-3.0% appreciation + 3.0% rent growth), your $27k cash investment doubles in ~7 years — after that, you're playing with house money.
Negotiation context
- It's been on market 21 days — a 2% lower offer ($94k) is reasonable based on typical stale-listing flexibility.
- 6 sale attempts with the ask held roughly flat each time — persistent listings suggest the price (not the market) is what's stuck; bring a comps-based counter.
- Current owner paid $45k; list at $95k implies a 111% gain — meaningful room to come down on a strong offer.
Risks & watch-outs
- Watch-outs: HOA is 23% of rent.
Questions for the listing agent
- Built in 1969 — when were the roof, HVAC, electrical panel, plumbing, and water heater last replaced?
- What does the HOA fee cover, when was the last increase, and are there any pending special assessments or reserve-fund shortfalls?
- Is there a deadline driving the sale (1031 exchange, divorce, estate, relocation)? That informs how much negotiation room exists.
- What's the average days-on-market for RENTAL listings here right now (not sales)? A rising rental-DOM trend means longer vacancies and softer asking-rent achievability than the comps imply.
- What's the recent tenant-quality profile in this submarket — average credit score on applications, eviction rate, late-payment / NSF rate, and stable-employment percentage? A property-management company in the area should have these aggregated.
- How much new for-sale + rental construction is in the pipeline within 1–3 miles? Heavy new supply typically softens prices + rents 12–24 months out; constrained supply supports both.
Investment metrics
- 1% rule
- 1.91% ✓
- Cap rate
- 11.22%
- Cash-on-cash
- 17.60%
- DSCR
- 1.78
- GRM
- 4.4
CMA / ARV
No comps found within radius.
Projected returns pro-forma
-3.0% appreciation · 3.0% rent growth · sell at horizon
- IRR
- 9.3%
- Equity multiple
- 1.37×
- Total profit
- $9,719
- Equity at exit
- $14,165
- IRR
- 18.6%
- Equity multiple
- 2.56×
- Total profit
- $41,542
- Equity at exit
- $8,214
Cash invested: $26,600 (down + closing). Projections, not guarantees.
Landlord ↔ Tenant lean methodology
- Overall (STATE)
- 31 Tenant-Leaning
- State Rhode Island
- 31 Tenant-Leaning · D+8
- County
- — inherits STATE
- City
- — inherits STATE
ZIP-level market 02816
- Active inventory
- 176
- Price-to-rent
- 4.4×
Monthly cashflow live
- Estimated rent
- $1,819 medium interval (Pro) →
- Mortgage (P&I)
- −$498
- Tax from tax record
- −$91 /mo · $1,089/yr
- Insurance
- −$40
- HOA
- −$418
- Vacancy / Maint / Mgmt
- −$382
- Net cashflow
- $390
Break-even live
UW: 25.0% down · 7.5% · 30yr · 1.5% tax · 5.0% vac · 8.0% maint · 8.0% mgmt
Financing live
Cash to close
- Down payment
- $23,750
- Closing costs
- $2,850
- Reserves months
- —
- Total cash needed
- —
Loan-product check · same deal, 3 products live
Conventional
25% down · 7.5% · 30yr
- Down + closing
- —
- Monthly P&I
- —
- Monthly cashflow
- —
- DSCR
- —
- Eligible?
- —
Personal DTI + credit; lowest rate.
DSCR
20% down · 8.5% · 30yr
- Down + closing
- —
- Monthly P&I
- —
- Monthly cashflow
- —
- DSCR
- —
- Eligible?
- —
No personal income docs; deal must DSCR.
Hard money
10% down · 12.0% · 12mo
- Down + closing
- —
- Monthly P&I
- —
- Monthly cashflow
- —
- DSCR
- —
- Eligible?
- —
Short-term bridge; refi at stabilization.
Rent comps 1 comps
| Address | Beds | Baths | Sqft | Rent | $/sqft | DOM | Units | Dist |
|---|---|---|---|---|---|---|---|---|
| 20 Woodland Dr Coventry, RI | 1.0 | 1.0 | 634 | $1,690 | $2.67 | 1d | 1 | 0.83mi |
HOA detail
- Monthly dues
- $418 · $5,016/yr
Listing history 17 events
-
2026-06-03days on market $95,000 Active 21 DOM
-
2026-06-02days on market $95,000 Active 20 DOM
-
2026-06-01days on market $95,000 Active 19 DOM
-
2026-05-31days on market $95,000 Active 18 DOM
-
2026-05-13$95,000 Active
-
2026-05-05historical
-
2026-04-09$95,000 Active
-
2026-03-31historical
-
2026-03-25price $94,900
-
2026-02-24$99,900 Active
-
2026-02-05historical
-
2026-01-29$99,900 Active
-
2026-01-27historical
-
2026-01-07$99,900 Active
-
2025-12-28historical
-
2025-12-09$99,900 Active
-
2025-11-12soldstatus $45,000
ⓘ Source: listings_history table (triggers on properties + properties_extension) + one-shot
backfill from property_details.listing_events for pre-trigger history.
Tax reassessment forecast RI · Partial reset (capped growth)
- Current annual tax
- $1,089 · $91/mo
- Projected year-2 tax
- $1,319 · $110/mo
- Expected delta
- +$230/yr (+$19/mo · 21.1%)
ⓘ Screening estimate from a state-policy table — verify with the county assessor before closing.
Nearby sold comps map
Loading sold comps map…
Walkable amenities ~0.75 mi
Loading nearby amenities…
Taxation est. · year 1
- Rental income
- $21,822
- − Mortgage interest
- −$5,321
- − Property taxes
- −$1,089
- − Insurance
- −$475
- − Repairs & maintenance
- −$1,746
- − Management
- −$1,746
- − HOA
- −$5,016
- − Depreciation
- −$2,764
- Taxable income
- $3,666
- Est. tax owed @ 24.0%
- −$880
- After-tax cash flow
- $3,802/yr
For passive investors: Depreciation is non-cash, so a rental often shows a tax loss while cash-flowing — sheltering income. Rental losses are passive: they offset passive income freely, and up to $25,000/yr can offset ordinary (W-2) income if you actively participate and your MAGI is under $100k (phasing out to $0 by $150k); unused losses carry forward. On sale, claimed depreciation is recaptured at up to 25%, and gains may owe capital-gains tax (a 1031 exchange can defer both). Figures are a year-1 estimate at your 24.0% rate — not tax advice; consult a CPA.
Schools (NCES district)
- District
- Coventry
- NCES district ID
- 4400210
- Math proficiency
- 25% ▼ -10.00%
- Reading proficiency
- 41% ▼ -10.00%
- Median HH income
- $66,277
- Composite
- 30.18/100
- National rank
- #6317
- State rank
- #19 of 39 in RI
Livability — Coventry
No livability data for this city. (Only ~50 U.S. cities are tracked.)
Census & demographics
- County
- Kent County · 90,904 people
- City population
- 33,298
- Metro
- Providence-Warwick, RI-MA
- Population (ZIP)
- 33,298
- Household income
- $101,431
- Rent vs Own
- Severe rent burden
- 667.0
Population outlook (Kent County) Hauer SSP2
- Today (2025)
- 160,994 people
- By 2030
- 157,428 · -2.2%
- By 2040
- 148,389 · -7.8%
- By 2050
- 137,995 · -14.3%
- By 2075
- 118,536 · -26.4%
- By 2100
- 102,266 · -36.5%
Race, ethnicity, and origin ACS 2023
- Neighborhood character
- Predominantly White (90%)
- Race & ethnicity
- White 90% Two or more races 6% Hispanic / Latino 5% Asian 1%
- Common ancestry
- Lithuanian 13% Russian 8% Romanian 4%
- Foreign-born
- 3% · Canada, China
- Languages at home
- 94% English-only · Spanish 3% Other Indo-European 1% French/Haitian/Cajun 1%
Political lean MEDSL · Kent
- 2024 margin
- Toss-up / Even · D 49.9% · R 48.1% · Other 2.0%
- 2008→2024 swing
- -15.6pp toward R · 2008: 17.5pp · 2024: 1.9pp
- All cycles
- 2024: D+1.9 2020: D+7.6 2016: R+0.7 2012: D+18.4 2008: D+17.5
Not yet ingested
- Civics
- —
Market trends
- HPI YoY
- ▼ -362.74%
- Current HPI
- 336.2662
- Rent YoY
- —
- Metro
- Providence-Warwick, RI-MA
- State GDP YoY
- ▲ 2.25%
- F500 in state
- 10
Industry mix (Fortune 500 HQ in RI)
| Industry | F500 HQs | Revenue |
|---|---|---|
| Healthcare | 1 | $373B |
|
||
| Food Distribution | 1 | $31B |
|
||
| Aerospace / Defense | 1 | $14B |
|
||
| Financial Services | 1 | $8B |
|
||
| Consumer Goods | 1 | $4B |
|
||
Price history
+111.1% since first listed13 events — show timeline
- 2026-05-13 Listed $95,000 RIS
- 2026-05-05 Listing Removed — RIS
- 2026-04-09 Listed $95,000 RIS
- 2026-03-31 Listing Removed — RIS
- 2026-03-25 Price Changed $94,900 RIS
- 2026-02-24 Listed $99,900 RIS
- 2026-02-05 Listing Removed — RIS
- 2026-01-29 Listed $99,900 RIS
- 2026-01-27 Listing Removed — RIS
- 2026-01-07 Listed $99,900 RIS
- 2025-12-28 Listing Removed — RIS
- 2025-12-09 Listed $99,900 RIS
- 2025-11-12 Sold (Public Records) $45,000 Public Records
Property tax history
+10.7%/yrLatest (2025): $1,089 · +1.6% YoY. Source: county tax records.
Cash-flow waterfall
monthlySold comps — $/sqft
last 12 mo · ≤1 miLoading sold comps…