 Multi-family
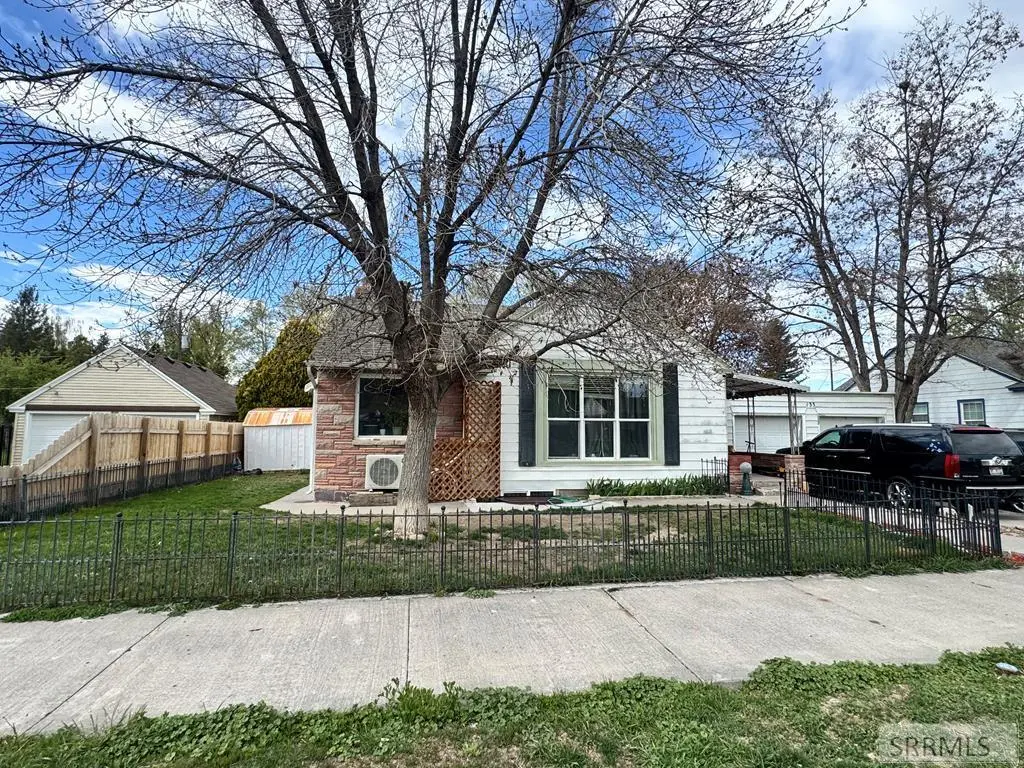
133 E 21st St #4 · Idaho Falls, ID
Flood risk 1/10 · Minimal
- FEMA flood zone
- X
- Chance of flooding over 30 yrs
- 0.0%
- Est. flood insurance / yr
- $473 – $860
Fire risk 3/10 · Minor
- Est. fire insurance / yr
- $584 – $1,086
Heat risk 3/10 · Minor
- Hot days now (above 91°F)
- 6 days/yr
- Hot days in 30 yrs
- 15 days/yr
Wind risk 1/10 · Minimal
- Chance of severe wind over 30 yrs
- —
Air-quality risk 4/10 · Minor
- Unhealthy air days now
- 5 days/yr
- Unhealthy air days in 30 yrs
- 6 days/yr
Risk factors via First Street. Map © Google.
Why this score? — see what drove the C- grade
The composite is a weighted blend of 9 inputs, each scored 0–100. Each bar is that input's sub-score; the figure is the points it added to the 100-point composite (weight × sub-score).
- Cash flow +17.8/30.0
- ARV discount +7.5/15.0
- DSCR +5.6/10.0
- 1% rule +4.8/10.0
- Rent growth +4.3/5.0
- Livability +4.3/5.0
- Schools +3.7/10.0
- Condition / age +2.2/5.0
- Appreciation +0.0/10.0
$517,000
🖨 Deal sheet 📄 Offer letter ✓ Due diligence
Multi-family units
County records classify this as Multi-Family (2-4 Unit). Listing-text estimate: 1 unit. estimate disagrees with records
Listing remarks MLS
Income-producing opportunity in Idaho Falls featuring two dwellings on one lot with a total of 4 rental units, all with separate entrances and currently fully occupied. Property generates approximately $4,400/month with a strong rental history and consistent occupancy. NO Seller Finance. The main home on 21st St includes a spacious 3-bedroom main-level unit and a 2-bedroom basement unit. The second dwelling on 21 St features an upper and lower tenant rentals with multiple rooms and its own separate washer and dryer in this house. Each dwelling offers its own driveway and private access, with a mix of in-unit and shared laundry setups. Several units have been updated, making this a low-maintenance, turn-key investment opportunity. Ideal for investors seeking cash flow, house-hackers, or multi-generational living. Rent roll and financials available upon request. Buyer to verify all information including square footage, zoning, and rental use. Please do not disturb tenants. 24 hour notice needed with some exceptions.
Key facts
- Consistent occupancy
- Main home
- Four rental units
Tags
Property features AI
Exterior
- Parking: 2-car garage
- Utilities: Public water; Public sewer; Natural gas available
- Home design: Two-story single family residence; Residential property
- Construction: Built with block, frame, metal siding and vinyl siding
- Exterior features: Lot in a residential R1 zone
Interior
- Kitchen: Dishwasher; Microwave; Refrigerator
- Flooring: Other flooring
- Bathrooms: Five full bathrooms
- Heating & cooling: Central air conditioning; Electric, forced air and natural gas heating
- Interior features: Gas fireplace (1); Finished basement with crawl space
- Laundry & utility: Washer located in basement
Neighborhood map
What this means for you Summary
Snapshot
- This is a 7-bed/5.0-bath multifamily listed at $517k. Condition is rated fair.
Deal economics
- At list price, monthly cash flow is $423 ($5k/yr) — positive.
- The deal already cash-flows at list — no discount required.
- To meet the 1% rule (rent ≥ 1% of price), the offer needs to be $506k (2.2% below list).
- Recommended offer: $506k (2.2% below list) — sets the bar for 1% rule.
Location & tenants
- Location reads 86/100 on livability (#3 in ID, #428 nationally) — a professional / high-income tenant draw. Strengths: amenities A+, cost of living A+, housing A+.
- Idaho Falls District (urban): math 36% / reading 50% proficiency, ranked #54 of 92 in ID (top 59%) — families likely to look elsewhere, expect single-tenant / working-renter base with shorter leases.
- Market conditions: Rents rising fast (+7.3%/yr); 198 active listings in the ZIP; solid renter incomes; 2,253 units permitted in Bonneville County in 2024 (1,051 in 5+ unit buildings).
- At $5,058/mo this rent would consume 74% of the median local household income ($82k/yr) (locally 490% of renters already pay >50% of income on rent) — very limited rent-growth headroom before tenants either downsize or default.
Forward outlook
- Local home prices are declining (-3.0%/yr); year-one equity from $4k of loan paydown is wiped out by about $16k of value loss. Plan a longer hold.
- Bonneville County population projected at +18% by 2050 — long-run rental-demand tailwind backs the buy-and-hold thesis.
- At projected returns (-3.0% appreciation + 7.3% rent growth), your $145k cash investment doubles in ~10 years — after that, you're playing with house money.
Negotiation context
- It's been on market 24 days — a 2% lower offer ($509k) is reasonable based on typical stale-listing flexibility.
- 4 sale attempts with the ask held roughly flat each time — persistent listings suggest the price (not the market) is what's stuck; bring a comps-based counter.
Questions for the listing agent
- Have any recent inspections been done? Can we get a copy of the seller's disclosures and any deferred-maintenance estimates?
- Built in 1975 — when were the roof, HVAC, electrical panel, plumbing, and water heater last replaced?
- Is there a deadline driving the sale (1031 exchange, divorce, estate, relocation)? That informs how much negotiation room exists.
- What's the average days-on-market for RENTAL listings here right now (not sales)? A rising rental-DOM trend means longer vacancies and softer asking-rent achievability than the comps imply.
- What's the recent tenant-quality profile in this submarket — average credit score on applications, eviction rate, late-payment / NSF rate, and stable-employment percentage? A property-management company in the area should have these aggregated.
- How much new apartment / multifamily construction is in the pipeline within 1–3 miles? Heavy new supply (>2% of stock underway) typically softens rents 12–24 months out; light construction supports rent growth.
Investment metrics
- 1% rule
- 0.98% ✗
- Cap rate
- 7.27%
- Cash-on-cash
- 3.51%
- DSCR
- 1.16
- GRM
- 8.5
CMA / ARV
No comps found within radius.
Projected returns pro-forma
-3.0% appreciation · 7.34% rent growth · sell at horizon
- IRR
- -6.0%
- Equity multiple
- 0.77×
- Total profit
- $-33,710
- Equity at exit
- $77,086
- IRR
- 8.3%
- Equity multiple
- 1.75×
- Total profit
- $109,110
- Equity at exit
- $44,701
Cash invested: $144,760 (down + closing). Projections, not guarantees.
Landlord ↔ Tenant lean methodology
- Overall (STATE)
- 91 Strongly Landlord-Friendly
- State Idaho
- 91 Strongly Landlord-Friendly · R+18
- County
- — inherits STATE
- City
- — inherits STATE
ZIP-level market 83404
- Home prices YoY
- -32.4%
- Rents YoY
- 7.3%
- Active inventory
- 198
- Price-to-rent
- 25.9×
Monthly cashflow live
- Estimated rent
- $5,058 high interval (Pro) →
- Mortgage (P&I)
- −$2,711
- Tax est. 1.5%
- −$646 /mo · $7,755/yr
- Insurance
- −$215
- HOA
- −$0
- Vacancy / Maint / Mgmt
- −$1,062
- Net cashflow
- $423
Break-even live
4-unit breakdown (identical units grouped — click to expand)
| Units | Beds | Baths | Est. rent |
|---|---|---|---|
| 1× unit | 3 | 1 | $1,665 |
| 1× unit | 2 | 1 | $1,261 |
| 2× units | 1 | 1 | $2,134 |
| #3 | 1 | 1 | $1,067 |
| #4 | 1 | 1 | $1,067 |
| Total (4 units) | $5,058 | ||
UW: 25.0% down · 7.5% · 30yr · 1.5% tax · 5.0% vac · 8.0% maint · 8.0% mgmt
Financing live
Cash to close
- Down payment
- $129,250
- Closing costs
- $15,510
- Reserves months
- —
- Total cash needed
- —
Loan-product check · same deal, 3 products live
Conventional
25% down · 7.5% · 30yr
- Down + closing
- —
- Monthly P&I
- —
- Monthly cashflow
- —
- DSCR
- —
- Eligible?
- —
Personal DTI + credit; lowest rate.
DSCR
20% down · 8.5% · 30yr
- Down + closing
- —
- Monthly P&I
- —
- Monthly cashflow
- —
- DSCR
- —
- Eligible?
- —
No personal income docs; deal must DSCR.
Hard money
10% down · 12.0% · 12mo
- Down + closing
- —
- Monthly P&I
- —
- Monthly cashflow
- —
- DSCR
- —
- Eligible?
- —
Short-term bridge; refi at stabilization.
Listing history 14 events
-
2026-06-19days on market $517,000 Active 24 DOM
-
2026-06-18days on market $517,000 Active 23 DOM
-
2026-06-17days on market $517,000 Active 22 DOM
-
2026-06-16days on market $517,000 Active 21 DOM
-
2026-06-15days on market $517,000 Active 20 DOM
-
2026-06-14pricedays on market $517,000 Active 18 DOM
-
2026-06-13days on market $520,000 Active 17 DOM
-
2026-06-10days on market $520,000 Active 15 DOM
-
2026-06-09days on market $520,000 Active 14 DOM
-
2026-06-08days on market $520,000 Active 13 DOM
-
2026-06-07days on market $520,000 Active 12 DOM
-
2026-06-05days on market $520,000 Active 9 DOM
-
2026-06-03remarks 699-char remark
-
2026-06-03$520,000 Active 8 DOM
ⓘ Source: listings_history table (triggers on properties + properties_extension) + one-shot
backfill from property_details.listing_events for pre-trigger history.
Climate risk First Street
- Flood 1/10 Low FEMA zone X · 0% chance over 30 yrs
- Wildfire 3/10 Moderate
- Heat 3/10 Moderate 6 d/yr ≥91°F today · 15 d/yr by 30 yrs out
- Wind 1/10 Low
- Air quality 4/10 Moderate 5 unhealthy d/yr today · 6 by 30 yrs out
Nearby sold comps map
Loading sold comps map…
Walkable amenities ~0.75 mi
Loading nearby amenities…
Taxation est. · year 1
- Rental income
- $60,696
- − Mortgage interest
- −$28,960
- − Property taxes
- −$7,755
- − Insurance
- −$2,585
- − Repairs & maintenance
- −$4,856
- − Management
- −$4,856
- − Depreciation
- −$15,040
- Taxable loss
- −$3,355
- Est. tax savings @ 24.0%
- +$805
- After-tax cash flow
- $5,881/yr
For passive investors: Depreciation is non-cash, so a rental often shows a tax loss while cash-flowing — sheltering income. Rental losses are passive: they offset passive income freely, and up to $25,000/yr can offset ordinary (W-2) income if you actively participate and your MAGI is under $100k (phasing out to $0 by $150k); unused losses carry forward. On sale, claimed depreciation is recaptured at up to 25%, and gains may owe capital-gains tax (a 1031 exchange can defer both). Figures are a year-1 estimate at your 24.0% rate — not tax advice; consult a CPA.
Condition & rehab AI · 14 photos
The property is in fair condition with moderate repairs and maintenance needed. Painting the exterior siding and deep cleaning the bathrooms and kitchen would significantly increase its value.
Repairs flagged
- Minor Kitchen countertops — Visible signs of wear and minor scratches.
- Minor Bathroom fixtures — Visible signs of wear and minor stains.
- Minor Exterior siding — Visible signs of wear and discoloration.
- Minor Carpeting — Visible signs of wear and stains.
- Minor Paint — Visible signs of chipping and wear.
- Minor Windows — Visible signs of wear and discoloration.
- Minor HVAC units — Visible signs of wear and discoloration.
Value-add opportunities
- Resale Painting exterior siding — Fresh paint can significantly improve curb appeal and home value.
- Rental Deep cleaning and sanitizing bathrooms — Clean bathrooms are essential for maintaining high occupancy rates.
- Resale Deep cleaning and sanitizing kitchen — A clean and organized kitchen can attract more buyers and increase the home's value.
- Both Deep cleaning and sanitizing HVAC units — Clean HVAC units can improve air quality and reduce energy costs, benefiting both resale and rental.
Renovation cost estimate screening
| Repair item | Severity | Est. cost |
|---|---|---|
| Kitchen countertops · Visible signs of wear and minor scratches. | Minor | $500–3,000 |
| Bathroom fixtures · Visible signs of wear and minor stains. | Minor | $500–3,000 |
| Exterior siding · Visible signs of wear and discoloration. | Minor | $500–3,000 |
| Carpeting · Visible signs of wear and stains. | Minor | $500–3,000 |
| Paint · Visible signs of chipping and wear. | Minor | $500–3,000 |
| Windows · Visible signs of wear and discoloration. | Minor | $500–3,000 |
| HVAC units · Visible signs of wear and discoloration. | Minor | $500–3,000 |
| Total estimated repair cost · 7 items | $3,500–21,000 |
Value-add ROI direction
- Resale Painting exterior siding — Fresh paint can significantly improve curb appeal and home value. ↑
- Rental Deep cleaning and sanitizing bathrooms — Clean bathrooms are essential for maintaining high occupancy rates. ↑
- Resale Deep cleaning and sanitizing kitchen — A clean and organized kitchen can attract more buyers and increase the home's value. ↑
- Both Deep cleaning and sanitizing HVAC units — Clean HVAC units can improve air quality and reduce energy costs, benefiting both resale and rental. ↑
ⓘ Cost ranges are severity-bucket heuristics (US national rule-of-thumb). Get contractor quotes + a written scope before underwriting a rehab budget.
Schools (NCES district)
- District
- Idaho Falls District
- NCES district ID
- 1601530
- Math proficiency
- 36% ▼ -2.00%
- Reading proficiency
- 50% ▲ 1.00%
- Median HH income
- $48,119
- Composite
- 36.75/100
- National rank
- #4581
- State rank
- #54 of 92 in ID
Livability — Idaho Falls
- Score
- 86/100
- State rank
- #3
- US rank
- #428
Category grades
Schools grade is shown separately in the Schools card above.
Census & demographics
- Census place
- Idaho Falls, ID
- County
- Bonneville County · 125,162 people
- City population
- 105,466
- Metro
- Idaho Falls, ID
- Population (ZIP)
- 27,500
- Household income
- $82,103
- Rent vs Own
- Severe rent burden
- 490.0
Population outlook (Bonneville County) Hauer SSP2
- Today (2025)
- 120,170 people
- By 2030
- 124,993 · +4.0%
- By 2040
- 134,091 · +11.6%
- By 2050
- 142,122 · +18.3%
- By 2075
- 157,767 · +31.3%
- By 2100
- 160,316 · +33.4%
Race, ethnicity, and origin ACS 2023
- Neighborhood character
- Predominantly White (84%)
- Race & ethnicity
- White 84% Hispanic / Latino 12% Two or more races 5% Asian 1%
- Hispanic origin (detail)
- Mexican 9%
- Common ancestry
- Portuguese 4% Italian 3% Slovak 2%
- Foreign-born
- 3% · Canada
- Languages at home
- 94% English-only · Spanish 4% Other Asian/Pacific 1%
Political lean MEDSL · Bonneville
- 2024 margin
- Solid R (+45.4) · D 25.6% · R 71.0% · Other 3.4%
- 2008→2024 swing
- -2.4pp toward R · 2008: -43.0pp · 2024: -45.4pp
- All cycles
- 2024: R+45.4 2020: R+43.6 2016: R+40.2 2012: R+51.8 2008: R+43.0
Not yet ingested
- Civics
- —
Market trends
- HPI YoY
- ▼ -153.06%
- Current HPI
- 319.4023
- Rent YoY
- ▲ 7.34%
- Metro
- Idaho Falls, ID
- State GDP YoY
- ▲ 4.51%
- F500 in state
- 6
Industry mix (Fortune 500 HQ in ID)
| Industry | F500 HQs | Revenue |
|---|---|---|
| Retail | 1 | $79B |
|
||
| Technology | 1 | $25B |
|
||
| Food / Agriculture | 1 | $6B |
|
||
Price history
+0.0% since first listed6 events — show timeline
- 2026-05-29 Relisted — SRMLS
- 2026-05-29 Relisted — SRMLS
- 2026-05-08 Pending — SRMLS
- 2026-05-08 Pending — SRMLS
- 2026-05-05 Listed $520,000 SRMLS
- 2026-05-05 Listed $520,000 SRMLS
Cash-flow waterfall
monthlySold comps — $/sqft
last 12 mo · ≤1 miLoading sold comps…