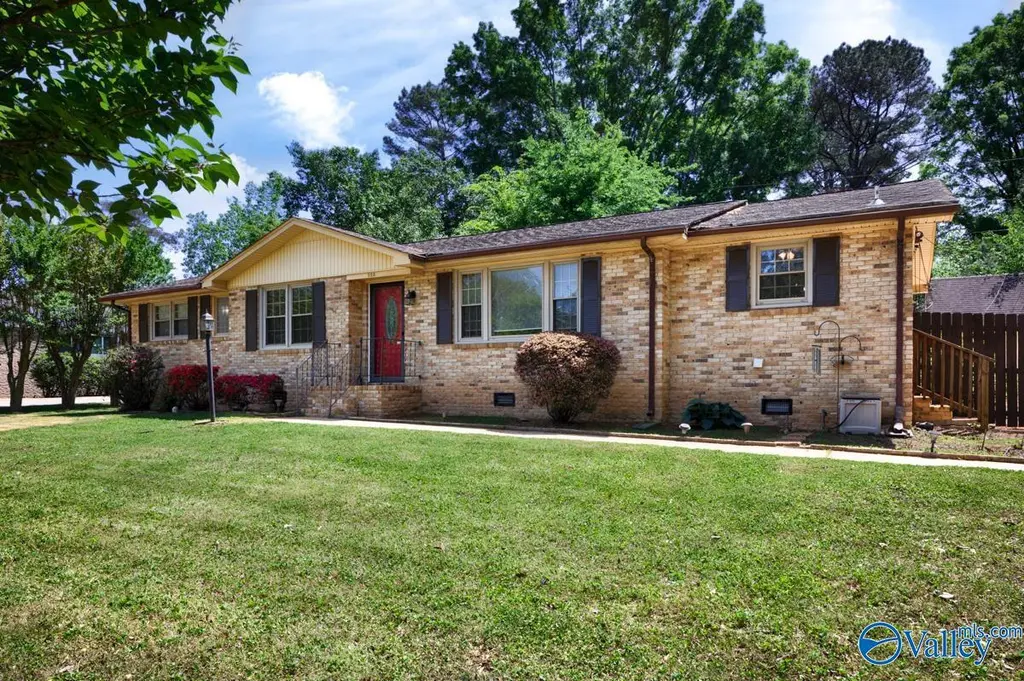
523 Harolds Dr · Huntsville, AL
Flood risk 1/10 · Minimal
- FEMA flood zone
- X (unshaded)
- Chance of flooding over 30 yrs
- 0.0%
- Est. flood insurance / yr
- $507 – $1,088
Fire risk 3/10 · Minor
- Est. fire insurance / yr
- $916 – $1,700
Heat risk 6/10 · Moderate
- Hot days now (above 105°F)
- 7 days/yr
- Hot days in 30 yrs
- 20 days/yr
Wind risk 4/10 · Minor
- Chance of severe wind over 30 yrs
- 15.0%
Air-quality risk 2/10 · Minimal
- Unhealthy air days now
- 0 days/yr
- Unhealthy air days in 30 yrs
- 2 days/yr
Risk factors via First Street. Map © Google.
Why this score? — see what drove the D grade
The composite is a weighted blend of 9 inputs, each scored 0–100. Each bar is that input's sub-score; the figure is the points it added to the 100-point composite (weight × sub-score).
- Appreciation +10.0/10.0
- Cash flow +8.5/30.0
- ARV discount +6.7/15.0
- Livability +4.1/5.0
- Rent growth +3.1/5.0
- Schools +2.9/10.0
- Condition / age +2.5/5.0
- DSCR +2.3/10.0
- 1% rule +1.5/10.0
$264,899
🖨 Deal sheet (PDF) 📄 Offer letter ✓ Due diligence
Listing remarks MLS
Charming 3 BR, 2 BA rancher in desirable Sherwood Park! It feels like home the moment you walk in! This home features hardwoods in the main living areas, an eat in kitchen and a generously sized laundry room! The nicely appointed flex room can be used as an office, playroom, tv room or hobby room...so many options! The master bedroom features an updated master bath and access to additional storage and a storm shelter! Outside, you don't want to miss the covered carport, fire pit and two storage buildings! The perfect house in the perfect location, just minutes away from Research Park, Bridge Street and the Space and Rocket Center! This home is a must-see and won't last long!
Key facts
- Eat in kitchen
- Large laundry room
- Flex room
Tags
Property features AI
Finance
- HOA & community: No homeowners association
Exterior
- Parking: 2-car carport; Concrete driveway
- Utilities: Public sewer
- Home design: Single-family residence; One-level home; Built in 1968
- Construction: Brick construction
- Exterior features: Lot in Sherwood Park subdivision
Interior
- Bathrooms: 1 full bathroom; 1 three-quarter bathroom
- Heating & cooling: Central heating (natural gas); Central cooling
- Interior features: Crawl space basement; No fireplaces
Neighborhood map
What this means for you Summary
Snapshot
- This is a 3-bed/1.0-bath single-family listed at $265k.
Deal economics
- At list price, monthly cash flow is $-234 ($-3k/yr) — negative.
- To cash-flow at today's rent, offer at most $224k (15.6% below list).
- To meet the 1% rule (rent ≥ 1% of price), the offer needs to be $173k (34.9% below list).
- Recommended offer: $173k (34.9% below list) — sets the bar for 1% rule.
- Cap rate 5.2% vs local median 3.8% in Huntsville — top-decile yield for the area; either an underpriced asset or a hidden risk that comps aren't pricing in. Stress-test before assuming the spread holds.
Location & tenants
- Location reads 82/100 on livability (#3 in AL, #1,082 nationally) — a professional / high-income tenant draw. Strengths: commute A+, cost of living A+, housing A+; Watch: crime F.
- Huntsville City (urban): math 21% / reading 46% proficiency, ranked #48 of 129 in AL (top 37%) — families likely to look elsewhere, expect single-tenant / working-renter base with shorter leases.
- Zoned schools: Morris Elementary School (math 5% / reading 31%, grade F, #481 of 627 statewide, top 77%, 515 students, 90% FRL); Columbia High School (math 12% / reading 17%, grade F, #220 of 305 statewide, top 77%, 954 students, 50% FRL) — zoned schools average 70% FRL vs 46% district-wide (24 pts higher); higher-poverty schools than district average — tighter screening recommended.
- Zoned-school proficiency averages 16% at this address vs 34% district-wide (-17 pts) — the specific schools serving this property underperform the Huntsville City average; the district grade overstates school quality for this exact location.
- Market conditions: Rents rising (+2.6%/yr); 216 active listings in the ZIP; 19 comparable units currently listed for rent nearby; rentals at typical pace (median 23d on market — plan ~3-4 weeks tenant-placement turnaround); 42% of comp listings sitting > 30 days — soft ceiling on asking rent; solid renter incomes; 4,709 units permitted in Madison County in 2024 (1,186 in 5+ unit buildings).
Forward outlook
- In year one you build about $28k of equity ($2k loan paydown + $26k appreciation (10.0% local appreciation)).
- Madison County population projected at +18% by 2050 — long-run rental-demand tailwind backs the buy-and-hold thesis.
- By year 2, paydown + projected appreciation supports a ~$46k cash-out refi (75% LTV) — recoverable capital for the next deal without selling this one.
Negotiation context
- It's been on market 28 days — a 2% lower offer ($261k) is reasonable based on typical stale-listing flexibility.
- 4 sale attempts since 13y ago with the ask held roughly flat each time — persistent listings suggest the price (not the market) is what's stuck; bring a comps-based counter.
- Current owner paid $150k; list at $265k implies a 77% gain — meaningful room to come down on a strong offer.
Risks & watch-outs
- Climate carrying-cost: extreme-heat days projected 7→20/yr by 2055 (HVAC capex compounding) — expect insurance premiums to compound above CPI over the hold.
Questions for the listing agent
- What do current leases actually rent for vs. the listed asking? Can we see a recent rent roll and the last 12 months of T-12 income?
- Built in 1968 — when were the roof, HVAC, electrical panel, plumbing, and water heater last replaced?
- Is there a deadline driving the sale (1031 exchange, divorce, estate, relocation)? That informs how much negotiation room exists.
- Crime grade is F in this area — have there been break-ins, vandalism, or insurance claims at this property in the last 3 years? What carrier currently insures it and at what premium?
- The area grade is low — what's the realistic commute time and amenity access for the typical tenant pool here? Any planned neighborhood developments (good or bad) we should know about?
- What's the average days-on-market for RENTAL listings here right now (not sales)? A rising rental-DOM trend means longer vacancies and softer asking-rent achievability than the comps imply.
- What's the recent tenant-quality profile in this submarket — average credit score on applications, eviction rate, late-payment / NSF rate, and stable-employment percentage? A property-management company in the area should have these aggregated.
- How much new for-sale + rental construction is in the pipeline within 1–3 miles? Heavy new supply typically softens prices + rents 12–24 months out; constrained supply supports both.
Investment metrics
- 1% rule
- 0.65% ✗
- Cap rate
- 5.24%
- Cash-on-cash
- -3.78%
- DSCR
- 0.83
- GRM
- 12.8
CMA / ARV
- ARV (on-the-fly)
- $260,005
- Comps found
- 12
Show comp detail 12 sales within ~0.75 mi
| Address | Dist | Beds/Ba | Sqft | Sold | Price | $/sf | Match |
|---|---|---|---|---|---|---|---|
| 6110 Stratford Ct NW | 0.07mi | 3/2.0 | 1,671 (-4%) | 2mo | $249,000 | $149 | 84 |
| 6418 Robinhood Ln | 0.06mi | 3/2.0 | 1,648 (-6%) | 3mo | $235,000 | $143 | 82 |
| 6206 NW Stratford Ct | 0.15mi | 3/2.0 | 1,800 (+3%) | 3mo | $185,000 | $103 | 81 |
| 6112 Stratford Ct NW | 0.05mi | 3/2.0 | 1,888 (+8%) | 6mo | $225,000 | $119 | 75 |
| 6205 Deramus Ave | 0.20mi | 3/2.0 | 1,720 (-1%) | 12mo | $270,000 | $157 | 74 |
| 6411 Robinhood Ln NW | 0.12mi | 3/2.0 | 1,599 (-8%) | 5mo | $220,000 | $138 | 72 |
| 504 Delaney Rd NW | 0.22mi | 4/3.0 (+1) | 1,804 (+3%) | 3mo | $285,000 | $158 | 69 |
| 528 Delaney Rd | 0.40mi | 3/2.0 | 1,750 (+0%) | 11mo | $189,000 | $108 | 68 |
| 319 Forrest Park Ct NW | 0.48mi | 3/2.0 | 1,852 (+6%) | 7mo | $265,000 | $143 | 57 |
| 303 Blocker St NW | 0.43mi | 3/2.0 | 1,580 (-10%) | 9mo | $285,000 | $180 | 53 |
| 505 NW Greendale Dr | 0.57mi | 4/2.0 (+1) | 1,601 (-8%) | 4mo | $265,000 | $166 | 48 |
| 4836 Benjamins Bloom Loop | 0.41mi | 3/2.0 | 1,484 (-15%) | 12mo | $271,666 | $183 | 42 |
Match score weights: distance 35% · size 25% · config 20% · recency 20%. Top-matched comps best support the ARV.
Projected returns pro-forma
10.0% appreciation · 2.57% rent growth · sell at horizon
- IRR
- 21.5%
- Equity multiple
- 2.73×
- Total profit
- $128,537
- Equity at exit
- $238,642
- IRR
- 19.3%
- Equity multiple
- 6.24×
- Total profit
- $388,500
- Equity at exit
- $514,640
Cash invested: $74,172 (down + closing). Projections, not guarantees.
Landlord ↔ Tenant lean methodology
- Overall (STATE)
- 90 Strongly Landlord-Friendly
- State Alabama
- 90 Strongly Landlord-Friendly · R+15
- County
- — inherits STATE
- City
- — inherits STATE
ZIP-level market 35806
- Home prices YoY
- 20.0%
- Rents YoY
- 2.6%
- Active inventory
- 216
- Price-to-rent
- 12.8×
Monthly cashflow live
- Estimated rent
- $1,726 high interval (Pro) →
- Mortgage (P&I)
- −$1,389
- Tax from tax record
- −$97 /mo · $1,168/yr
- Insurance
- −$110
- HOA
- −$0
- Vacancy / Maint / Mgmt
- −$362
- Net cashflow
- $-234
Break-even live
Sensitivity live
| Price | -10% $-84 | -5% $-159 | +0% $-234 | +5% $-308 | +10% $-383 |
|---|---|---|---|---|---|
| Rent | -10% $-370 | -5% $-302 | +0% $-234 | +5% $-165 | +10% $-97 |
| Rate | -1.0pp $-100 | -0.5pp $-166 | base $-234 | +0.5pp $-302 | +1.0pp $-372 |
UW: 25.0% down · 7.5% · 30yr · 1.5% tax · 5.0% vac · 8.0% maint · 8.0% mgmt
Financing live
Cash to close
- Down payment
- $66,225
- Closing costs
- $7,947
- Reserves months
- —
- Total cash needed
- —
Loan-product check · same deal, 3 products live
Conventional
25% down · 7.5% · 30yr
- Down + closing
- —
- Monthly P&I
- —
- Monthly cashflow
- —
- DSCR
- —
- Eligible?
- —
Personal DTI + credit; lowest rate.
DSCR
20% down · 8.5% · 30yr
- Down + closing
- —
- Monthly P&I
- —
- Monthly cashflow
- —
- DSCR
- —
- Eligible?
- —
No personal income docs; deal must DSCR.
Hard money
10% down · 12.0% · 12mo
- Down + closing
- —
- Monthly P&I
- —
- Monthly cashflow
- —
- DSCR
- —
- Eligible?
- —
Short-term bridge; refi at stabilization.
Rent comps 19 comps
| Address | Beds | Baths | Sqft | Rent | $/sqft | DOM | Units | Dist |
|---|---|---|---|---|---|---|---|---|
| 413 Harolds Dr NW Huntsville, AL | 3.0 | 2.0 | 1700 | $1,795 | $1.06 | 45d | 1 | 0.20mi |
| 400 Harolds Dr NW Huntsville, AL | 3.0 | 2.0 | 1750 | $1,795 | $1.03 | 45d | 1 | 0.27mi |
| 511 Delaney Rd NW Huntsville, AL | 3.0 | 2.0 | 1550 | $1,550 | $1.00 | 45d | 1 | 0.30mi |
| 6203 Friar Tuck Dr NW Unit C Huntsville, AL | 2.0 | 2.0 | 1100 | $995 | $0.90 | 45d | 1 | 0.33mi |
| 400 Forrest Park Ct NW Huntsville, AL | 3.0 | 3.0 | 2021 | $1,800 | $0.89 | 45d | 1 | 0.36mi |
| 505 Forrest Park Ct NW Huntsville, AL | 3.0 | 2.5 | 2091 | $2,200 | $1.05 | 15d | 1 | 0.41mi |
| 6407 Marsh Ave NW Huntsville, AL | 3.0 | 2.0 | 1600 | $1,699 | $1.06 | 45d | 1 | 0.48mi |
| 6315 Old Madison Pike NW Huntsville, AL | 1.0–3.0 | 1.0–1.5 | 1065 | $1,437 | $1.35 | 45d | 1 | 0.50mi |
| 6620 Old Madison Pike NW Huntsville, AL | 1.0–2.0 | 1.0–2.0 | 866 | $1,458 | $1.68 | 15d | 15 | 0.52mi |
| 4810 Bradford Dr NW Huntsville, AL | 2.0 | 1.0–2.0 | 898 | $2,204 | $2.45 | 15d | 16 | 0.59mi |
| 224 Royal Pines Dr NW Huntsville, AL | 1.0–2.0 | 1.0–2.0 | 904 | $1,295 | $1.43 | 15d | 8 | 0.63mi |
| 6928 Steeplechase Dr NW Huntsville, AL | 2.0 | 2.5 | 1550 | $1,650 | $1.06 | 45d | 1 | 0.77mi |
| 6864 Steeplechase Dr NW Huntsville, AL | 2.0 | 2.0 | 1476 | $1,725 | $1.17 | 15d | 1 | 0.80mi |
| 6854 Governors West NW Huntsville, AL | 1.0–3.0 | 1.0–2.0 | 1083 | $1,662 | $1.53 | 15d | 16 | 0.88mi |
| 320 Voyager Way NW Huntsville, AL | 1.0–3.0 | 1.0–2.0 | 1063 | $1,714 | $1.61 | 23d | 19 | 0.97mi |
| 5801 Sanderson St NW Huntsville, AL | 1.0–3.0 | 1.0–2.0 | 1088 | $2,016 | $1.85 | 15d | 14 | 1.01mi |
| 5810 Stax St NW Huntsville, AL | 3.0 | 1.0–2.0 | 1188 | $2,705 | $2.28 | 15d | 237 | 1.19mi |
| 925 Makers Way NW Huntsville, AL | 3.0 | 1.0–2.0 | 1072 | $2,455 | $2.29 | 25d | 52 | 1.21mi |
| 1100 Enterprise Way Huntsville, AL | 1.0–3.0 | 1.0–2.0 | 1059 | $2,174 | $2.05 | 15d | 35 | 1.37mi |
Listing history 24 events
-
2026-06-22pricedays on market $264,899 Active 28 DOM
-
2026-06-18days on market $264,999 Active 25 DOM
-
2026-06-18price $264,999 Active 24 DOM
-
2026-06-17days on market $264,998 Active 24 DOM
-
2026-06-16days on market $264,998 Active 23 DOM
-
2026-06-15days on market $264,998 Active 22 DOM
-
2026-06-14pricedays on market $264,998 Active 20 DOM
-
2026-06-10days on market $264,999 Active 17 DOM
-
2026-06-09days on market $264,999 Active 16 DOM
-
2026-06-08days on market $264,999 Active 15 DOM
-
2026-06-07days on market $264,999 Active 14 DOM
-
2026-06-03remarks 699-char remark
-
2026-06-03status $264,999 Active 10 DOM
-
2026-05-30statusdays on market $264,999 Pending 10 DOM
-
2026-05-22status Active
-
2026-04-19status Pending
-
2026-04-16$264,999 Active
-
2018-10-03soldstatus $150,000 690-char remark
Show marketing remark (690 chars)
Charming 3 BR, 2 BA rancher in desirable Sherwood Park! It feels like home the moment you walk in! This home features hardwoods in the main living areas, an eat in kitchen and a generously sized laundry room! The nicely appointed flex room can be used as an office, playroom, tv room or hobby room...so many options! The master bedroom features an updated master bath and access to additional storage and a storm shelter! Outside, you don't want to miss the covered carport, fire pit and two storage buildings! The perfect house in the perfect location, just minutes away from Research Park, Bridge Street and the Space and Rocket Center! This home is a must-see and won't last long!
-
2018-10-03soldstatus $150,000
Show marketing remark (690 chars)
Charming 3 BR, 2 BA rancher in desirable Sherwood Park! It feels like home the moment you walk in! This home features hardwoods in the main living areas, an eat in kitchen and a generously sized laundry room! The nicely appointed flex room can be used as an office, playroom, tv room or hobby room...so many options! The master bedroom features an updated master bath and access to additional storage and a storm shelter! Outside, you don't want to miss the covered carport, fire pit and two storage buildings! The perfect house in the perfect location, just minutes away from Research Park, Bridge Street and the Space and Rocket Center! This home is a must-see and won't last long!
-
2018-08-16$155,000 690-char remark
Show marketing remark (690 chars)
Charming 3 BR, 2 BA rancher in desirable Sherwood Park! It feels like home the moment you walk in! This home features hardwoods in the main living areas, an eat in kitchen and a generously sized laundry room! The nicely appointed flex room can be used as an office, playroom, tv room or hobby room...so many options! The master bedroom features an updated master bath and access to additional storage and a storm shelter! Outside, you don't want to miss the covered carport, fire pit and two storage buildings! The perfect house in the perfect location, just minutes away from Research Park, Bridge Street and the Space and Rocket Center! This home is a must-see and won't last long!
-
2013-04-02soldstatus $229,900
-
2013-03-27soldstatus $122,725 484-char remark
Show marketing remark (484 chars)
WELL MAINTAINED AND UPDATED HOME, GREAT LOCATION NEAR GATE #9,RESEARCH PARK & BRIDGE STREET.POSSIBLE 4TH BEDROOM BEING USED AS EXTRA FAMILY ROOM.30-YR ARCHITECTURAL ROOF IN 08, NEW CHAMPION VINYL WINDOWS, HVAC AND DUCTS IN 07, UPDATED LIGHTING AND PLUMBING FIXTURES. HALL BATHROOM UPDATED WITH NEW TUB, VANITY AND CERAMIC FLOOR.TWO EXTERIOR BUILDINGS, ONE WAS USED BY OWNER AS MAN CAVE HAS POWER,AIR,ETC. BASEMENT HAS HEAT/AC AND POWER AND HAS BEEN USED BY OWNER AS STORM SHELTER.
-
2013-01-01$124,900 484-char remark
Show marketing remark (484 chars)
WELL MAINTAINED AND UPDATED HOME, GREAT LOCATION NEAR GATE #9,RESEARCH PARK & BRIDGE STREET.POSSIBLE 4TH BEDROOM BEING USED AS EXTRA FAMILY ROOM.30-YR ARCHITECTURAL ROOF IN 08, NEW CHAMPION VINYL WINDOWS, HVAC AND DUCTS IN 07, UPDATED LIGHTING AND PLUMBING FIXTURES. HALL BATHROOM UPDATED WITH NEW TUB, VANITY AND CERAMIC FLOOR.TWO EXTERIOR BUILDINGS, ONE WAS USED BY OWNER AS MAN CAVE HAS POWER,AIR,ETC. BASEMENT HAS HEAT/AC AND POWER AND HAS BEEN USED BY OWNER AS STORM SHELTER.
-
2010-11-24soldstatus $132,500
ⓘ Source: listings_history table (triggers on properties + properties_extension) + one-shot
backfill from property_details.listing_events for pre-trigger history.
Tax reassessment forecast AL · Resets to sale price
- Current annual tax
- $1,168 · $97/mo
- Projected year-2 tax
- $1,168 · $97/mo
- Expected delta
- $0/yr ($0/mo · 0.0%)
ⓘ Screening estimate from a state-policy table — verify with the county assessor before closing.
Climate risk First Street
- Flood 1/10 Low FEMA zone X (unshaded) · 0% chance over 30 yrs
- Wildfire 3/10 Moderate
- Heat 6/10 Major 7 d/yr ≥105°F today · 20 d/yr by 30 yrs out
- Wind 4/10 Moderate 15% chance of damaging wind over 30 yrs
- Air quality 2/10 Low 0 unhealthy d/yr today · 2 by 30 yrs out
Nearby sold comps map
Loading sold comps map…
Walkable amenities ~0.75 mi
Loading nearby amenities…
Taxation est. · year 1
- Rental income
- $20,709
- − Mortgage interest
- −$14,838
- − Property taxes
- −$1,168
- − Insurance
- −$1,324
- − Repairs & maintenance
- −$1,657
- − Management
- −$1,657
- − Depreciation
- −$7,706
- Taxable loss
- −$7,641
- Est. tax savings @ 24.0%
- +$1,834
- After-tax cash flow
- $-968/yr
For passive investors: Depreciation is non-cash, so a rental often shows a tax loss while cash-flowing — sheltering income. Rental losses are passive: they offset passive income freely, and up to $25,000/yr can offset ordinary (W-2) income if you actively participate and your MAGI is under $100k (phasing out to $0 by $150k); unused losses carry forward. On sale, claimed depreciation is recaptured at up to 25%, and gains may owe capital-gains tax (a 1031 exchange can defer both). Figures are a year-1 estimate at your 24.0% rate — not tax advice; consult a CPA.
Schools (NCES district)
- District
- Huntsville City
- NCES district ID
- 0101800
- Math proficiency
- 21% ▼ -23.00%
- Reading proficiency
- 46% ▬ 0.00%
- Median HH income
- $48,264
- Composite
- 28.84/100
- National rank
- #6647
- State rank
- #48 of 129 in AL
Livability — Huntsville
- Score
- 82/100
- State rank
- #3
- US rank
- #1082
Category grades
Schools grade is shown separately in the Schools card above.
Census & demographics
- Census place
- Huntsville, AL
- County
- Madison County · 380,832 people
- City population
- 220,435
- Metro
- Huntsville, AL
- Population (ZIP)
- 29,161
- Household income
- $86,768
- Rent vs Own
- Severe rent burden
- 1249.0
Population outlook (Madison County) Hauer SSP2
- Today (2025)
- 392,086 people
- By 2030
- 409,788 · +4.5%
- By 2040
- 440,557 · +12.4%
- By 2050
- 460,990 · +17.6%
- By 2075
- 502,872 · +28.3%
- By 2100
- 513,623 · +31.0%
Race, ethnicity, and origin ACS 2023
- Neighborhood character
- Diverse neighborhood (Simpson 0.57)
- Race & ethnicity
- White 58% Black 30% Hispanic / Latino 5% Two or more races 5% Asian 4%
- Hispanic origin (detail)
- Mexican 2% Puerto Rican 2%
- Common ancestry
- Slovak 2% Italian 2% Serbian 2%
- Foreign-born
- 7% · Canada, Vietnam, China
- Languages at home
- 93% English-only · Spanish 2% Other Indo-European 1% Other Asian/Pacific 1%
Political lean MEDSL · Madison
- 2024 margin
- Lean R (+9.0) · D 44.7% · R 53.7% · Other 1.6%
- 2008→2024 swing
- +6.0pp toward D · 2008: -14.9pp · 2024: -9.0pp
- All cycles
- 2024: R+9.0 2020: R+8.0 2016: R+16.8 2012: R+18.7 2008: R+14.9
Not yet ingested
- Civics
- —
Market trends
- HPI YoY
- ▲ 71.67%
- Current HPI
- 430.5866
- Rent YoY
- ▲ 2.57%
- Metro
- Huntsville, AL
- State GDP YoY
- ▲ 2.94%
- F500 in state
- 4
Industry mix (Fortune 500 HQ in AL)
| Industry | F500 HQs | Revenue |
|---|---|---|
| Financial Services | 1 | $8B |
|
||
| Healthcare | 1 | $5B |
|
||
Price history
+100.0% since first listed10 events — show timeline
- 2026-05-22 Relisted — VMLS
- 2026-04-19 Pending — VMLS
- 2026-04-16 Listed $264,999 VMLS
- 2018-10-03 Sold (Public Records) $150,000 Public Records
- 2018-10-03 Sold (MLS) $150,000 VMLS
- 2018-08-16 Listed $155,000 VMLS
- 2013-04-02 Sold (Public Records) $229,900 Public Records
- 2013-03-27 Sold (MLS) $122,725 VMLS
- 2013-01-01 Listed $124,900 VMLS
- 2010-11-24 Sold (Public Records) $132,500 Public Records
Property tax history
+6.6%/yrLatest (2024): $1,168 · +4.7% YoY. Source: county tax records.
Cash-flow waterfall
monthlySold comps — $/sqft
last 12 mo · ≤1 miLoading sold comps…