 Multi-family
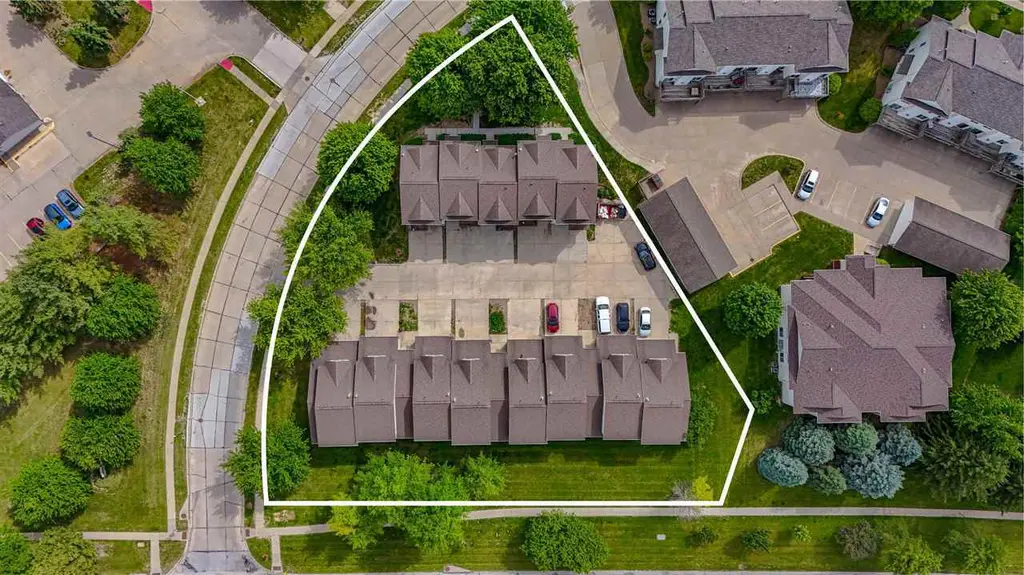
1003-1049 Scott Park Dr Unit 13 Total Units · Iowa City, IA
Flood risk 1/10 · Minimal
- FEMA flood zone
- X (unshaded)
- Chance of flooding over 30 yrs
- 0.0%
- Est. flood insurance / yr
- $473 – $860
Fire risk 4/10 · Minor
- Est. fire insurance / yr
- $902 – $1,676
Heat risk 3/10 · Minor
- Hot days now (above 105°F)
- 7 days/yr
- Hot days in 30 yrs
- 16 days/yr
Wind risk 2/10 · Minimal
- Chance of severe wind over 30 yrs
- —
Air-quality risk 2/10 · Minimal
- Unhealthy air days now
- 1 days/yr
- Unhealthy air days in 30 yrs
- 2 days/yr
Risk factors via First Street. Map © Google.
Why this score? — see what drove the C grade
The composite is a weighted blend of 9 inputs, each scored 0–100. Each bar is that input's sub-score; the figure is the points it added to the 100-point composite (weight × sub-score).
- Cash flow +19.8/30.0
- ARV discount +7.5/15.0
- DSCR +6.3/10.0
- Schools +5.7/10.0
- 1% rule +5.2/10.0
- Livability +4.3/5.0
- Rent growth +4.0/5.0
- Condition / age +3.8/5.0
- Appreciation +0.0/10.0
$1,975,000
🖨 Deal sheet 📄 Offer letter ✓ Due diligence
Multi-family units
County records classify this as Multi-Family (5+ Unit). Listing-text estimate: 1 unit. estimate disagrees with records
5+ unit building — per-unit beds/baths from public records are typically unavailable; the breakdown below (if shown) is an estimate from the listing text.
Listing remarks
Office Exclusive Listing - Exceptional multifamily investment opportunity on the east side of Iowa City featuring 13 well-maintained townhouse-style condominium units. This income-producing property consists entirely of 2-bedroom, 2.5-bathroom townhomes with two similar floor plans.
Key facts
- Garage
- Built 2002
Neighborhood map
What this means for you Summary
Snapshot
- This is a ?-bed/8.0-bath multifamily listed at $1.98M. Condition is rated good.
Deal economics
- At list price, monthly cash flow is $2k ($28k/yr) — positive.
- The deal already cash-flows at list — no discount required.
- Meets the 1% rule at list price ($20k rent vs $1.98M).
- Cap rate 7.7% vs local median 2.7% in Iowa City — top-decile yield for the area; either an underpriced asset or a hidden risk that comps aren't pricing in. Stress-test before assuming the spread holds.
Location & tenants
- Location reads 86/100 on livability (#13 in IA, #450 nationally) — a professional / high-income tenant draw. Strengths: amenities A+, commute A+, cost of living A+.
- Iowa City Community School District (urban): math 65% / reading 70% proficiency, ranked #174 of 289 in IA (top 60%) — acceptable for families but not a draw, mixed tenant base, ~2y average lease.
- Zoned schools: Herbert Hoover Elementary School (math 57% / reading 61%, grade B-, #428 of 616 statewide, top 70%, 504 students, 48% FRL); Southeast Junior High School (math 64% / reading 68%, grade A-, #152 of 246 statewide, top 62%, 812 students, 50% FRL); Iowa City High School (math 62% / reading 73%, grade B, #186 of 336 statewide, top 57%, 1,599 students, 40% FRL) — zoned schools average 46% FRL vs 30% district-wide (16 pts higher); higher-poverty schools than district average — tighter screening recommended.
- Market conditions: Rents rising fast (+6.0%/yr); 204 active listings in the ZIP; solid renter incomes; 714 units permitted in Johnson County in 2024 (158 in 5+ unit buildings).
- At $20,236/mo this rent would consume 311% of the median local household income ($78k/yr) (locally 1268% of renters already pay >50% of income on rent) — very limited rent-growth headroom before tenants either downsize or default.
Forward outlook
- Local home prices are declining (-3.0%/yr); year-one equity from $14k of loan paydown is wiped out by about $59k of value loss. Plan a longer hold.
- Johnson County population projected at +60% by 2050 — long-run rental-demand tailwind backs the buy-and-hold thesis.
Negotiation context
- Only 0 days on market — expect competitive offers; lowballing is unlikely to land.
Questions for the listing agent
- Is there a deadline driving the sale (1031 exchange, divorce, estate, relocation)? That informs how much negotiation room exists.
- Schools are A-rated — typically a magnet for longer-tenancy family renters. What's the average tenant stay here, and is there a school-zone premium baked into asking?
- What's the average days-on-market for RENTAL listings here right now (not sales)? A rising rental-DOM trend means longer vacancies and softer asking-rent achievability than the comps imply.
- What's the recent tenant-quality profile in this submarket — average credit score on applications, eviction rate, late-payment / NSF rate, and stable-employment percentage? A property-management company in the area should have these aggregated.
- How much new apartment / multifamily construction is in the pipeline within 1–3 miles? Heavy new supply (>2% of stock underway) typically softens rents 12–24 months out; light construction supports rent growth.
Investment metrics
- 1% rule
- 1.02% ✓
- Cap rate
- 7.71%
- Cash-on-cash
- 5.07%
- DSCR
- 1.23
- GRM
- 8.1
CMA / ARV
No comps found within radius.
Projected returns pro-forma
-3.0% appreciation · 5.97% rent growth · sell at horizon
- IRR
- -5.1%
- Equity multiple
- 0.80×
- Total profit
- $-108,576
- Equity at exit
- $294,479
- IRR
- 7.8%
- Equity multiple
- 1.67×
- Total profit
- $369,998
- Equity at exit
- $170,762
Cash invested: $553,000 (down + closing). Projections, not guarantees.
Landlord ↔ Tenant lean methodology
- Overall (STATE)
- 83 Strongly Landlord-Friendly
- State Iowa
- 83 Strongly Landlord-Friendly · R+6
- County
- — inherits STATE
- City
- — inherits STATE
ZIP-level market 52245
- Rents YoY
- 6.0%
- Active inventory
- 204
- Price-to-rent
- 105.7×
Monthly cashflow live
- Estimated rent
- $20,236 medium interval (Pro) →
- Mortgage (P&I)
- −$10,357
- Tax est. 1.5%
- −$2,469 /mo · $29,625/yr
- Insurance
- −$823
- HOA
- −$0
- Vacancy / Maint / Mgmt
- −$4,250
- Net cashflow
- $2,338
Break-even live
13-unit breakdown (identical units grouped — click to expand)
| Units | Beds | Baths | Est. rent |
|---|---|---|---|
| 13× units | 2 | 2.5 | $20,241 |
| #1 | 2 | 2.5 | $1,557 |
| #2 | 2 | 2.5 | $1,557 |
| #3 | 2 | 2.5 | $1,557 |
| #4 | 2 | 2.5 | $1,557 |
| #5 | 2 | 2.5 | $1,557 |
| #6 | 2 | 2.5 | $1,557 |
| #7 | 2 | 2.5 | $1,557 |
| #8 | 2 | 2.5 | $1,557 |
| #9 | 2 | 2.5 | $1,557 |
| #10 | 2 | 2.5 | $1,557 |
| #11 | 2 | 2.5 | $1,557 |
| #12 | 2 | 2.5 | $1,557 |
| #13 | 2 | 2.5 | $1,557 |
| Total (13 units) | $20,236 | ||
UW: 25.0% down · 7.5% · 30yr · 1.5% tax · 5.0% vac · 8.0% maint · 8.0% mgmt
Financing live
Cash to close
- Down payment
- $493,750
- Closing costs
- $59,250
- Reserves months
- —
- Total cash needed
- —
Loan-product check · same deal, 3 products live
Conventional
25% down · 7.5% · 30yr
- Down + closing
- —
- Monthly P&I
- —
- Monthly cashflow
- —
- DSCR
- —
- Eligible?
- —
Personal DTI + credit; lowest rate.
DSCR
20% down · 8.5% · 30yr
- Down + closing
- —
- Monthly P&I
- —
- Monthly cashflow
- —
- DSCR
- —
- Eligible?
- —
No personal income docs; deal must DSCR.
Hard money
10% down · 12.0% · 12mo
- Down + closing
- —
- Monthly P&I
- —
- Monthly cashflow
- —
- DSCR
- —
- Eligible?
- —
Short-term bridge; refi at stabilization.
Listing history 2 events
-
2026-06-10remarks 283-char remark
-
2026-06-10$1,975,000 Pending
ⓘ Source: listings_history table (triggers on properties + properties_extension) + one-shot
backfill from property_details.listing_events for pre-trigger history.
Climate risk First Street
- Flood 1/10 Low FEMA zone X (unshaded) · 0% chance over 30 yrs
- Wildfire 4/10 Moderate
- Heat 3/10 Moderate 7 d/yr ≥105°F today · 16 d/yr by 30 yrs out
- Wind 2/10 Low
- Air quality 2/10 Low 1 unhealthy d/yr today · 2 by 30 yrs out
Nearby sold comps map
Loading sold comps map…
Walkable amenities ~0.75 mi
Loading nearby amenities…
Taxation est. · year 1
- Rental income
- $242,832
- − Mortgage interest
- −$110,631
- − Property taxes
- −$29,625
- − Insurance
- −$9,875
- − Repairs & maintenance
- −$19,427
- − Management
- −$19,427
- − Depreciation
- −$57,455
- Taxable loss
- −$3,606
- Est. tax savings @ 24.0%
- +$866
- After-tax cash flow
- $28,917/yr
For passive investors: Depreciation is non-cash, so a rental often shows a tax loss while cash-flowing — sheltering income. Rental losses are passive: they offset passive income freely, and up to $25,000/yr can offset ordinary (W-2) income if you actively participate and your MAGI is under $100k (phasing out to $0 by $150k); unused losses carry forward. On sale, claimed depreciation is recaptured at up to 25%, and gains may owe capital-gains tax (a 1031 exchange can defer both). Figures are a year-1 estimate at your 24.0% rate — not tax advice; consult a CPA.
Condition & rehab AI · 12 photos
This well-maintained multi-family property offers 13 townhouse-style condominium units with 2-bedroom, 2.5-bathroom layouts. The property is in good condition with minimal maintenance required.
Value-add opportunities
- Both Paint exterior — Enhances curb appeal and resale value
- Both Clean gutters — Improves drainage and prevents water damage
Renovation cost estimate screening
Value-add ROI direction
- Both Paint exterior — Enhances curb appeal and resale value ↑
- Both Clean gutters — Improves drainage and prevents water damage ↑
ⓘ Cost ranges are severity-bucket heuristics (US national rule-of-thumb). Get contractor quotes + a written scope before underwriting a rehab budget.
Schools (NCES district)
- District
- Iowa City Community School District
- NCES district ID
- 1914700
- Math proficiency
- 65% ▼ -6.00%
- Reading proficiency
- 70% ▲ 2.00%
- Median HH income
- $50,229
- Composite
- 57.3/100
- National rank
- #1088
- State rank
- #174 of 289 in IA
Livability — Iowa City
- Score
- 86/100
- State rank
- #13
- US rank
- #450
Category grades
Schools grade is shown separately in the Schools card above.
Census & demographics
- Census place
- Iowa City, IA
- County
- Johnson County · 132,710 people
- City population
- 80,235
- Metro
- Iowa City, IA
- Population (ZIP)
- 22,853
- Household income
- $78,020
- Rent vs Own
- Severe rent burden
- 1268.0
Population outlook (Johnson County) Hauer SSP2
- Today (2025)
- 180,405 people
- By 2030
- 200,014 · +10.9%
- By 2040
- 241,428 · +33.8%
- By 2050
- 288,144 · +59.7%
- By 2075
- 420,009 · +132.8%
- By 2100
- 546,596 · +203.0%
Race, ethnicity, and origin ACS 2023
- Neighborhood character
- Predominantly White (84%)
- Race & ethnicity
- White 84% Hispanic / Latino 5% Asian 4% Two or more races 4% Black 3%
- Hispanic origin (detail)
- Mexican 2%
- Common ancestry
- Portuguese 4% Romanian 3% Italian 3%
- Foreign-born
- 8% · Canada, China, Vietnam
- Languages at home
- 90% English-only · Spanish 3% Chinese 1% Other Indo-European 1%
Political lean MEDSL · Johnson
- 2024 margin
- Solid D (+38.1) · D 68.4% · R 30.3% · Other 1.3%
- 2008→2024 swing
- -3.4pp toward R · 2008: 41.5pp · 2024: 38.1pp
- All cycles
- 2024: D+38.1 2020: D+43.2 2016: D+38.3 2012: D+35.4 2008: D+41.5
Not yet ingested
- Civics
- —
Market trends
- HPI YoY
- ▼ -205.41%
- Current HPI
- 164.751
- Rent YoY
- ▲ 5.97%
- Metro
- Iowa City, IA
- State GDP YoY
- ▲ 2.48%
- F500 in state
- 4
Industry mix (Fortune 500 HQ in IA)
| Industry | F500 HQs | Revenue |
|---|---|---|
| Financial Services | 1 | $16B |
|
||
| Retail / Convenience | 1 | $15B |
|
||
Price history
2 events — show timeline
- 2026-06-09 Delisted — ICAARMLS
- 2026-06-09 Listed $1,975,000 ICAARMLS
Cash-flow waterfall
monthlySold comps — $/sqft
last 12 mo · ≤1 miLoading sold comps…