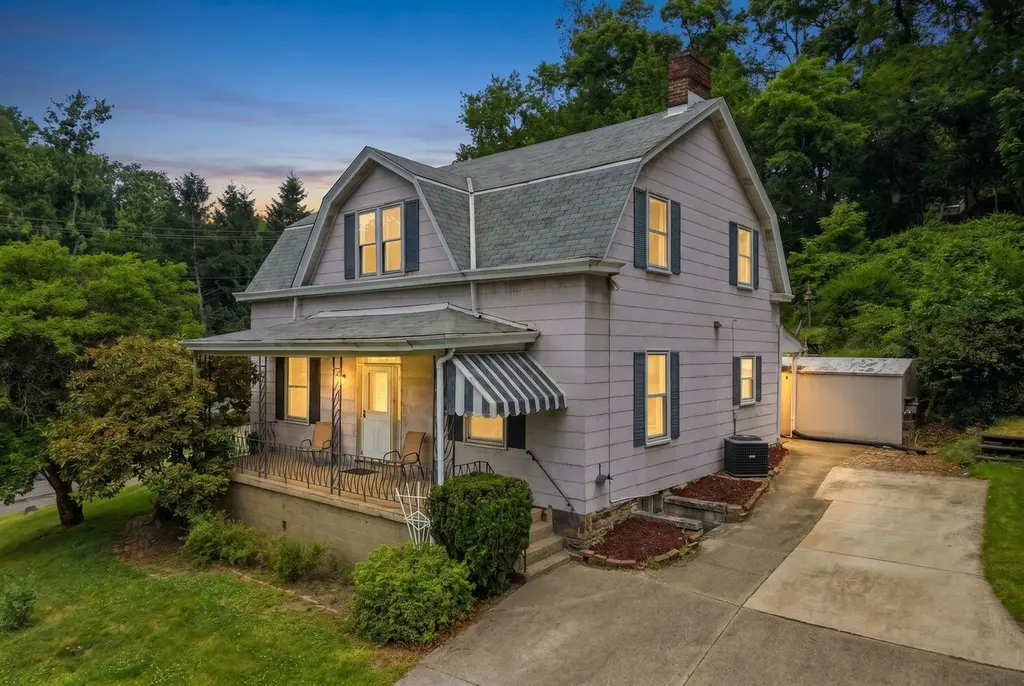
48 Glasgow Rd · Forest Hills, PA
Flood risk 4/10 · Minor
- FEMA flood zone
- X (unshaded)
- Chance of flooding over 30 yrs
- 0.2%
- Est. flood insurance / yr
- $473 – $860
Fire risk 1/10 · Minimal
- Est. fire insurance / yr
- $511 – $949
Heat risk 3/10 · Minor
- Hot days now (above 98°F)
- 7 days/yr
- Hot days in 30 yrs
- 16 days/yr
Wind risk 2/10 · Minimal
- Chance of severe wind over 30 yrs
- —
Air-quality risk 4/10 · Minor
- Unhealthy air days now
- 4 days/yr
- Unhealthy air days in 30 yrs
- 5 days/yr
Risk factors via First Street. Map © Google.
Why this score? — see what drove the C- grade
The composite is a weighted blend of 9 inputs, each scored 0–100. Each bar is that input's sub-score; the figure is the points it added to the 100-point composite (weight × sub-score).
- Cash flow +15.0/30.0
- ARV discount +15.0/15.0
- DSCR +4.6/10.0
- Livability +4.2/5.0
- 1% rule +4.0/10.0
- Rent growth +3.5/5.0
- Condition / age +2.5/5.0
- Schools +1.8/10.0
- Appreciation +0.0/10.0
$215,000
🖨 Deal sheet 📄 Offer letter ✓ Due diligence
Listing remarks
Great opportunity to own a classic Forest Hills home situated on two parcels. The adjacent wooded lot enhances the property's sense of privacy and creates a beautiful natural setting, providing additional green space for recreation, gardening, or simply enjoying the outdoors. Offering generous living space, high ceilings, and spacious rooms throughout, this home is filled with character and opportunity. The inviting front porch overlooks a mature treed setting and provides the perfect spot for morning coffee or relaxing evenings. The main level features a welcoming living room, formal dining room, eat-in kitchen, and a versatile bonus room ideal for a home office, playroom, den, or hobby sp
Key facts
- Green space
- Two parcels
- Wooded lot
Tags
Property features AI
Finance
- HOA & community: Public transportation access
Exterior
- Parking: Off-street parking
- Utilities: Public water; Public sewer
- Home design: 2-story residence; Resale property
- Construction: Composition roof
- Exterior features: Lot dimensions approximately 90 x 88 x 100 x 88 feet
Interior
- Kitchen: Dishwasher; Stove; Refrigerator; Some gas appliances
- Flooring: Hardwood; Tile; Carpet
- Bathrooms: 1 full bathroom
- Heating & cooling: Gas heating; Hot water heating; Central air conditioning
- Interior features: Hardwood, tile and carpet flooring; Walk-out basement; Two fireplaces
Neighborhood map
What this means for you Summary
Snapshot
- This is a 3-bed/1.0-bath single-family listed at $215k.
Deal economics
- At list price, monthly cash flow is $66 ($795/yr) — positive.
- The deal already cash-flows at list — no discount required.
- To meet the 1% rule (rent ≥ 1% of price), the offer needs to be $193k (10.2% below list).
- Recommended offer: $193k (10.2% below list) — sets the bar for 1% rule.
- Cap rate 6.7% vs local median 4.2% in Forest Hills — top-decile yield for the area; either an underpriced asset or a hidden risk that comps aren't pricing in. Stress-test before assuming the spread holds.
Location & tenants
- Location reads 83/100 on livability (#112 in PA, #873 nationally) — a professional / high-income tenant draw. Strengths: schools A+, crime A+, commute A+; Watch: amenities F.
- Woodland Hills SD (suburban): math 13% / reading 30% proficiency, ranked #486 of 539 in PA (top 90%) — low school quality limits family demand, transient renter base, plan for 1-2y turnover; 69% free/reduced lunch — lower-income household profile, screen leases tightly.
- Market conditions: Rents rising (+3.9%/yr); 118 active listings in the ZIP; 9 comparable units currently listed for rent nearby; rentals at typical pace (median 24d on market — plan ~3-4 weeks tenant-placement turnaround); 2,996 units permitted in Allegheny County in 2024 (1,588 in 5+ unit buildings).
- This rent runs 42% of the median local income ($55k/yr) — at the standard rent-burdened threshold; future hikes will face affordability resistance.
Forward outlook
- Local home prices are declining (-3.0%/yr); year-one equity from $1k of loan paydown is wiped out by about $6k of value loss. Plan a longer hold.
Negotiation context
- Only 6 days on market — expect competitive offers; lowballing is unlikely to land.
Risks & watch-outs
- Watch-outs: built in 1890 — expect roof / HVAC / electrical / plumbing capex.
Questions for the listing agent
- Built in 1890 — when were the roof, HVAC, electrical panel, plumbing, and water heater last replaced?
- Is there a deadline driving the sale (1031 exchange, divorce, estate, relocation)? That informs how much negotiation room exists.
- Schools are A-rated — typically a magnet for longer-tenancy family renters. What's the average tenant stay here, and is there a school-zone premium baked into asking?
- What's the average days-on-market for RENTAL listings here right now (not sales)? A rising rental-DOM trend means longer vacancies and softer asking-rent achievability than the comps imply.
- What's the recent tenant-quality profile in this submarket — average credit score on applications, eviction rate, late-payment / NSF rate, and stable-employment percentage? A property-management company in the area should have these aggregated.
- How much new for-sale + rental construction is in the pipeline within 1–3 miles? Heavy new supply typically softens prices + rents 12–24 months out; constrained supply supports both.
Investment metrics
- 1% rule
- 0.90% ✗
- Cap rate
- 6.66%
- Cash-on-cash
- 1.32%
- DSCR
- 1.06
- GRM
- 9.3
CMA / ARV
- ARV (on-the-fly)
- $348,160
- Comps found
- 12
Show comp detail 12 sales within ~0.75 mi
| Address | Dist | Beds/Ba | Sqft | Sold | Price | $/sf | Match |
|---|---|---|---|---|---|---|---|
| 344 Woodside Rd | 0.20mi | 3/2.0 | 1,773 (-13%) | 4mo | $320,000 | $180 | 61 |
| 259 Cascade Rd | 0.49mi | 3/2.0 | 1,945 (-5%) | 7mo | $270,000 | $139 | 59 |
| 127 Fairfax Rd | 0.50mi | 4/2.5 (+1) | 2,000 (-2%) | 3mo | $315,000 | $158 | 59 |
| 1932 Ardmore Blvd | 0.44mi | 4/2.5 (+1) | 2,160 (+6%) | 1mo | $380,000 | $176 | 58 |
| 1004 Sherwood Rd | 0.15mi | 3/2.5 | 1,753 (-14%) | 7mo | $399,900 | $228 | 58 |
| 813 Maine St | 0.28mi | 3/2.0 | 1,768 (-14%) | 6mo | $180,000 | $102 | 55 |
| 217 Thornberry Dr | 0.62mi | 4/2.5 (+1) | 2,120 (+4%) | 1mo | $372,500 | $176 | 54 |
| 419 Burlington Rd | 0.62mi | 4/1.5 (+1) | 1,824 (-11%) | 1mo | $310,000 | $170 | 44 |
| 310 Edgewood Rd | 0.55mi | 4/2.0 (+1) | 1,800 (-12%) | 2mo | $324,000 | $180 | 44 |
| 440 Pacific Ave | 0.72mi | 3/2.5 | 1,848 (-10%) | 2mo | $306,000 | $166 | 42 |
| 58 Ridge Rd | 0.67mi | 3/1.0 | 1,747 (-15%) | 8mo | $242,000 | $139 | 38 |
| 616 Edgewood Rd | 0.65mi | 4/2.5 (+1) | 2,320 (+13%) | 3mo | $262,000 | $113 | 34 |
Match score weights: distance 35% · size 25% · config 20% · recency 20%. Top-matched comps best support the ARV.
Projected returns pro-forma
-3.0% appreciation · 3.86% rent growth · sell at horizon
- IRR
- -13.2%
- Equity multiple
- 0.52×
- Total profit
- $-28,924
- Equity at exit
- $32,057
- IRR
- -3.0%
- Equity multiple
- 0.79×
- Total profit
- $-12,667
- Equity at exit
- $18,589
Cash invested: $60,200 (down + closing). Projections, not guarantees.
Landlord ↔ Tenant lean methodology
- Overall (STATE)
- 62 Landlord-Friendly
- State Pennsylvania
- 62 Landlord-Friendly · EVEN
- County
- — inherits STATE
- City
- — inherits STATE
ZIP-level market 15221
- Home prices YoY
- -32.3%
- Rents YoY
- 3.9%
- Active inventory
- 118
- Price-to-rent
- 9.3×
Monthly cashflow live
- Estimated rent
- $1,931 high interval (Pro) →
- Mortgage (P&I)
- −$1,127
- Tax from tax record
- −$242 /mo · $2,905/yr
- Insurance
- −$90
- HOA
- −$0
- Vacancy / Maint / Mgmt
- −$405
- Net cashflow
- $66
Break-even live
UW: 25.0% down · 7.5% · 30yr · 1.5% tax · 5.0% vac · 8.0% maint · 8.0% mgmt
Financing live
Cash to close
- Down payment
- $53,750
- Closing costs
- $6,450
- Reserves months
- —
- Total cash needed
- —
Loan-product check · same deal, 3 products live
Conventional
25% down · 7.5% · 30yr
- Down + closing
- —
- Monthly P&I
- —
- Monthly cashflow
- —
- DSCR
- —
- Eligible?
- —
Personal DTI + credit; lowest rate.
DSCR
20% down · 8.5% · 30yr
- Down + closing
- —
- Monthly P&I
- —
- Monthly cashflow
- —
- DSCR
- —
- Eligible?
- —
No personal income docs; deal must DSCR.
Hard money
10% down · 12.0% · 12mo
- Down + closing
- —
- Monthly P&I
- —
- Monthly cashflow
- —
- DSCR
- —
- Eligible?
- —
Short-term bridge; refi at stabilization.
Rent comps 9 comps
| Address | Beds | Baths | Sqft | Rent | $/sqft | DOM | Units | Dist |
|---|---|---|---|---|---|---|---|---|
| 2525 Greensburg Pike #305 Pittsburgh, PA | 2.0 | 3.0 | 2964 | $2,975 | $1.00 | 1d | 1 | 0.62mi |
| 442 Locust St Pittsburgh, PA | 2.0 | 1.0 | 1600 | $2,600 | $1.62 | 2d | 1 | 0.96mi |
| 1148 East St Pittsburgh, PA | 3.0 | 3.0 | 1738 | $1,700 | $0.98 | 43d | 1 | 1.14mi |
| 1962 McNary Blvd Pittsburgh, PA | 3.0 | 1.0 | 1517 | $1,545 | $1.02 | 7d | 1 | 1.20mi |
| 2323 Patterson Ave Unit NA Pittsburgh, PA | 3.0 | 1.0 | 1440 | $1,500 | $1.04 | 23d | 1 | 1.21mi |
| 2323 Patterson Ave Pittsburgh, PA | 3.0 | 1.0 | 1440 | $1,800 | $1.25 | 43d | 1 | 1.21mi |
| 2210 Hampton St Pittsburgh, PA | 3.0 | 1.5 | 1512 | $1,650 | $1.09 | 23d | 1 | 1.23mi |
| 1030 Ross Ave Pittsburgh, PA | 4.0 | 3.5 | 2856 | $2,200 | $0.77 | 1d | 1 | 1.30mi |
| 2219 Manor Ave Pittsburgh, PA | 3.0 | 1.0 | 1638 | $1,600 | $0.98 | 23d | 1 | 1.45mi |
Listing history 6 events
-
2026-06-18days on market $215,000 Active 6 DOM
-
2026-06-17days on market $215,000 Active 5 DOM
-
2026-06-16days on market $215,000 Active 4 DOM
-
2026-06-15days on market $215,000 Active 3 DOM
-
2026-06-13remarks 699-char remark
-
2026-06-13$215,000 Active 1 DOM
ⓘ Source: listings_history table (triggers on properties + properties_extension) + one-shot
backfill from property_details.listing_events for pre-trigger history.
Tax reassessment forecast PA · Partial reset (capped growth)
- Current annual tax
- $2,905 · $242/mo
- Projected year-2 tax
- $3,151 · $263/mo
- Expected delta
- +$246/yr (+$21/mo · 8.5%)
ⓘ Screening estimate from a state-policy table — verify with the county assessor before closing.
Climate risk First Street
- Flood 4/10 Moderate FEMA zone X (unshaded) · 20% chance over 30 yrs
- Wildfire 1/10 Low
- Heat 3/10 Moderate 7 d/yr ≥98°F today · 16 d/yr by 30 yrs out
- Wind 2/10 Low
- Air quality 4/10 Moderate 4 unhealthy d/yr today · 5 by 30 yrs out
Nearby sold comps map
Loading sold comps map…
Walkable amenities ~0.75 mi
Loading nearby amenities…
Taxation est. · year 1
- Rental income
- $23,170
- − Mortgage interest
- −$12,043
- − Property taxes
- −$2,905
- − Insurance
- −$1,075
- − Repairs & maintenance
- −$1,854
- − Management
- −$1,854
- − Depreciation
- −$6,255
- Taxable loss
- −$2,815
- Est. tax savings @ 24.0%
- +$676
- After-tax cash flow
- $1,470/yr
For passive investors: Depreciation is non-cash, so a rental often shows a tax loss while cash-flowing — sheltering income. Rental losses are passive: they offset passive income freely, and up to $25,000/yr can offset ordinary (W-2) income if you actively participate and your MAGI is under $100k (phasing out to $0 by $150k); unused losses carry forward. On sale, claimed depreciation is recaptured at up to 25%, and gains may owe capital-gains tax (a 1031 exchange can defer both). Figures are a year-1 estimate at your 24.0% rate — not tax advice; consult a CPA.
Schools (NCES district)
- District
- Woodland Hills SD
- NCES district ID
- 4216500
- Math proficiency
- 13% ▼ -13.00%
- Reading proficiency
- 30% ▼ -10.00%
- Median HH income
- $41,803
- Composite
- 18.31/100
- National rank
- #8954
- State rank
- #486 of 539 in PA
Livability — Forest Hills
- Score
- 83/100
- State rank
- #112
- US rank
- #873
Category grades
Schools grade is shown separately in the Schools card above.
Census & demographics
- Census place
- Forest Hills, PA
- County
- Allegheny County · 1,022,028 people
- Metro
- Pittsburgh, PA
- Population (ZIP)
- 29,374
- Household income
- $55,028
- Rent vs Own
- Severe rent burden
- 1933.0
Population outlook (Allegheny County) Hauer SSP2
- Today (2025)
- 1,250,282 people
- By 2030
- 1,256,482 · +0.5%
- By 2040
- 1,256,318 · +0.5%
- By 2050
- 1,244,169 · -0.5%
- By 2075
- 1,197,693 · -4.2%
- By 2100
- 1,093,187 · -12.6%
Race, ethnicity, and origin ACS 2023
- Neighborhood character
- Diverse neighborhood (Simpson 0.60)
- Race & ethnicity
- White 47% Black 43% Two or more races 7% Hispanic / Latino 4% Asian 1%
- Common ancestry
- Romanian 4% Lithuanian 2% Serbian 1%
- Foreign-born
- 4% · Canada, South Korea, China
- Languages at home
- 93% English-only · Spanish 2% French/Haitian/Cajun 1% Other Indo-European 1%
Political lean MEDSL · Allegheny
- 2024 margin
- Strong D (+20.3) · D 59.7% · R 39.4%
- 2008→2024 swing
- +4.8pp toward D · 2008: 15.5pp · 2024: 20.3pp
- All cycles
- 2024: D+20.3 2020: D+20.4 2016: D+16.4 2012: D+14.4 2008: D+15.5
Not yet ingested
- Civics
- —
Market trends
- HPI YoY
- ▼ -109.77%
- Current HPI
- 230.0486
- Rent YoY
- ▲ 3.86%
- Metro
- Pittsburgh, PA
- State GDP YoY
- ▲ 1.68%
- F500 in state
- 34
Industry mix (Fortune 500 HQ in PA)
| Industry | F500 HQs | Revenue |
|---|---|---|
| Healthcare | 2 | $309B |
|
||
| Insurance | 2 | $27B |
|
||
| Telecommunications / Media | 1 | $124B |
|
||
| Industrial Distribution | 1 | $22B |
|
||
| Financial Services | 1 | $20B |
|
||
| Chemicals / Materials | 1 | $18B |
|
||
Price history
1 event — show timeline
- 2026-06-10 Listed $215,000 West Penn MLS
Property tax history
+1.8%/yrLatest (2026): $2,905 · +5.6% YoY. Source: county tax records.
Cash-flow waterfall
monthlySold comps — $/sqft
last 12 mo · ≤1 miLoading sold comps…