 116-Plex
4011 E Columbus Dr · Tampa, FL
Flood risk No data
- FEMA flood zone
- —
- Chance of flooding over 30 yrs
- —
- Est. flood insurance / yr
- —
Fire risk No data
- Est. fire insurance / yr
- —
Heat risk No data
- Hot days now (above threshold)
- —
- Hot days in 30 yrs
- —
Wind risk No data
- Chance of severe wind over 30 yrs
- —
Air-quality risk No data
- Unhealthy air days now
- —
- Unhealthy air days in 30 yrs
- —
Risk factors via First Street. Map © Google.
Why this score? — see what drove the A- grade
The composite is a weighted blend of 9 inputs, each scored 0–100. Each bar is that input's sub-score; the figure is the points it added to the 100-point composite (weight × sub-score).
- Cash flow +30.0/30.0
- 1% rule +10.0/10.0
- DSCR +10.0/10.0
- Appreciation +10.0/10.0
- ARV discount +7.5/15.0
- Schools +4.2/10.0
- Livability +4.0/5.0
- Rent growth +2.6/5.0
- Condition / age +2.5/5.0
$9,000,000
🖨 Deal sheet (PDF) 📄 Offer letter ✓ Due diligence
Listing remarks MLS
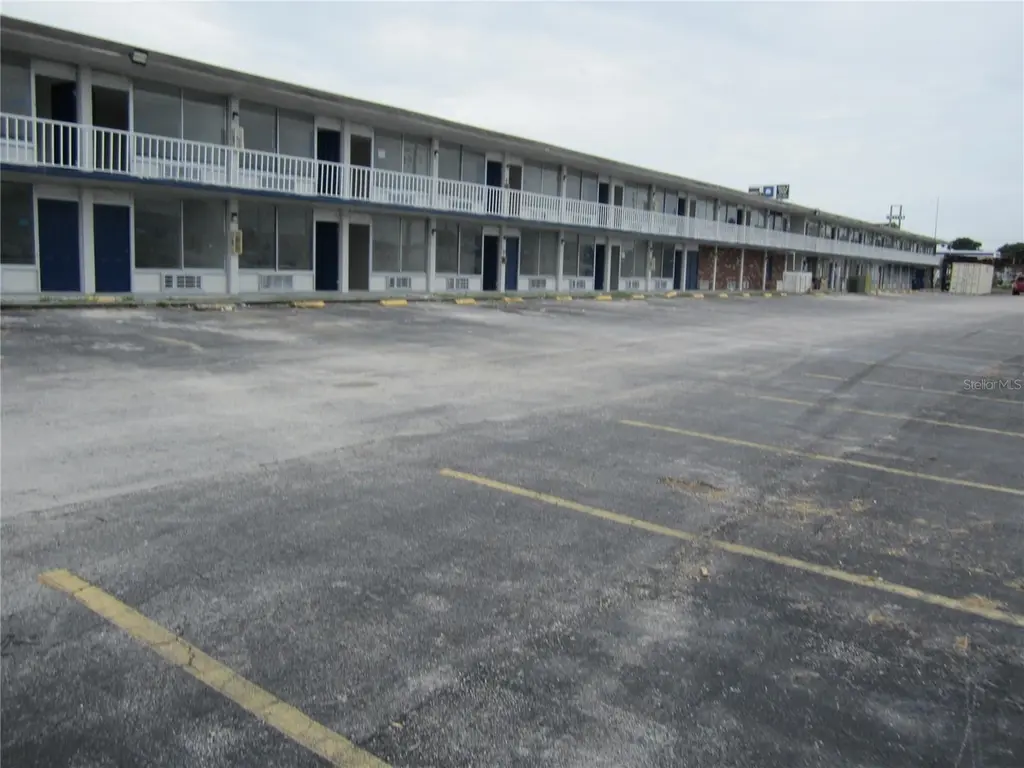
This building is 116 unit hotel/apartment complex: building is two-story concrete block/brick: second floor is concrete: each unit is 300 ft. ² MOL efficiency apartments: new roof in 2024: building is being totally remodeled and has land to build on an additional 100 units MOL: you can rent these units by the day, week, month, or year: if you rent by the week at $350 per unit proforma income is $2,111,200 with the expenses at $844,480 and your net income will be $1,266,720. Total Acreage - 5+ acres
Key facts
- 2.5 acre lot
- Built 1974
- Listed 628 days
Neighborhood map
What this means for you Summary
Snapshot
- This is a 116 × ?-bed/1-bath units multifamily listed at $9.00M.
Deal economics
- At list price, monthly cash flow is $49k ($585k/yr) — positive. Per door: $420/mo.
- The deal already cash-flows at list — no discount required.
- Meets the 1% rule at list price ($140k rent vs $9.00M).
- Recommended offer: $7.92M (12.0% below list) — sets the bar for market timing.
Location & tenants
- Location reads 79/100 on livability (#142 in FL, #2,135 nationally) — a middle-class / working-renter tenant base. Strengths: commute A+, housing A+, health & safety A+; Watch: crime D+.
- Hillsborough (suburban): math 47% / reading 50% proficiency, ranked #41 of 73 in FL (top 56%) — families likely to look elsewhere, expect single-tenant / working-renter base with shorter leases.
- Zoned schools: Oak Park Elementary School (math 42% / reading 25%, grade F, #1,758 of 2,144 statewide, top 83%, 354 students, 90% FRL); Greco Middle Magnet School (math 23% / reading 23%, grade F, #542 of 571 statewide, top 95%, 700 students, 77% FRL); Blake High School (math 24% / reading 45%, grade F, #386 of 667 statewide, top 59%, 1,537 students, 55% FRL) — zoned schools average 74% FRL vs 52% district-wide (22 pts higher); higher-poverty schools than district average — tighter screening recommended.
- Zoned-school proficiency averages 30% at this address vs 48% district-wide (-18 pts) — the specific schools serving this property underperform the Hillsborough average; the district grade overstates school quality for this exact location.
- Market conditions: Rents flat; 190 active listings in the ZIP; lower-income renter base — watch delinquency; 9,053 units permitted in Hillsborough County in 2024 (4,555 in 5+ unit buildings).
- At $140,434/mo this rent would consume 4558% of the median local household income ($37k/yr) (locally 1374% of renters already pay >50% of income on rent) — very limited rent-growth headroom before tenants either downsize or default.
Forward outlook
- In year one you build about $962k of equity ($62k loan paydown + $900k appreciation (10.0% local appreciation)).
- Hillsborough County population projected at +37% by 2050 — long-run rental-demand tailwind backs the buy-and-hold thesis.
- At projected returns (10.0% appreciation + 0.6% rent growth), your $2.52M cash investment doubles in ~2 years — after that, you're playing with house money.
- By year 2, paydown + projected appreciation supports a ~$1.55M cash-out refi (75% LTV) — recoverable capital for the next deal without selling this one.
Negotiation context
- It's been on market 628 days — a 12% lower offer ($7.92M) is reasonable based on typical stale-listing flexibility.
- Current owner paid $1k; list at $9.00M implies a 749900% gain — meaningful room to come down on a strong offer.
Questions for the listing agent
- It's been on market 628 days. Have you received any prior offers? Is the seller open to a 12% concession, seller financing, or rate buy-down credit?
- Can we see the unit-by-unit rent roll, current vacancy, and any below-market leases? What's the average tenancy length?
- What capital expenditures (roof, boiler, parking lot, exteriors) have been made in the last 5 years, and what's planned in the next 2?
- Built in 1974 — when were the roof, HVAC, electrical panel, plumbing, and water heater last replaced?
- Why hasn't it sold? Are there any deal-killer items the seller is aware of (foundation, flood, title, zoning, code violations)?
- Is there a deadline driving the sale (1031 exchange, divorce, estate, relocation)? That informs how much negotiation room exists.
- Crime grade is D in this area — have there been break-ins, vandalism, or insurance claims at this property in the last 3 years? What carrier currently insures it and at what premium?
- What's the average days-on-market for RENTAL listings here right now (not sales)? A rising rental-DOM trend means longer vacancies and softer asking-rent achievability than the comps imply.
- What's the recent tenant-quality profile in this submarket — average credit score on applications, eviction rate, late-payment / NSF rate, and stable-employment percentage? A property-management company in the area should have these aggregated.
- How much new apartment / multifamily construction is in the pipeline within 1–3 miles? Heavy new supply (>2% of stock underway) typically softens rents 12–24 months out; light construction supports rent growth.
Investment metrics
- 1% rule
- 1.56% ✓
- Cap rate
- 12.79%
- Cash-on-cash
- 23.21%
- DSCR
- 2.03
- GRM
- 5.3
CMA / ARV
No comps found within radius.
Projected returns pro-forma
10.0% appreciation · 0.58% rent growth · sell at horizon
- IRR
- 40.4%
- Equity multiple
- 4.05×
- Total profit
- $7,674,517
- Equity at exit
- $8,107,913
- IRR
- 33.9%
- Equity multiple
- 8.76×
- Total profit
- $19,550,199
- Equity at exit
- $17,485,021
Cash invested: $2,520,000 (down + closing). Projections, not guarantees.
Landlord ↔ Tenant lean methodology
- Overall (STATE)
- 87 Strongly Landlord-Friendly
- State Florida
- 87 Strongly Landlord-Friendly · R+3
- County
- — inherits STATE
- City
- — inherits STATE
ZIP-level market 33605
- Home prices YoY
- 3.7%
- Rents YoY
- 0.6%
- Active inventory
- 190
- Price-to-rent
- 619.5×
Monthly cashflow live
- Estimated rent
- $140,434 medium interval (Pro) →
- Mortgage (P&I)
- −$47,197
- Tax est. 1.5%
- −$11,250 /mo · $135,000/yr
- Insurance
- −$3,750
- HOA
- −$0
- Vacancy / Maint / Mgmt
- −$29,491
- Net cashflow
- $48,746
Break-even live
Sensitivity live
| Price | -10% $54,966 | -5% $51,856 | +0% $48,746 | +5% $45,636 | +10% $42,526 |
|---|---|---|---|---|---|
| Rent | -10% $37,652 | -5% $43,199 | +0% $48,746 | +5% $54,293 | +10% $59,840 |
| Rate | -1.0pp $53,278 | -0.5pp $51,035 | base $48,746 | +0.5pp $46,414 | +1.0pp $44,041 |
116-unit breakdown (identical units grouped — click to expand)
| Units | Beds | Baths | Est. rent |
|---|---|---|---|
| 116× units | 0 | 1 | $140,476 |
| #1 | 0 | 1 | $1,211 |
| #2 | 0 | 1 | $1,211 |
| #3 | 0 | 1 | $1,211 |
| #4 | 0 | 1 | $1,211 |
| #5 | 0 | 1 | $1,211 |
| #6 | 0 | 1 | $1,211 |
| #7 | 0 | 1 | $1,211 |
| #8 | 0 | 1 | $1,211 |
| #9 | 0 | 1 | $1,211 |
| #10 | 0 | 1 | $1,211 |
| #11 | 0 | 1 | $1,211 |
| #12 | 0 | 1 | $1,211 |
| #13 | 0 | 1 | $1,211 |
| #14 | 0 | 1 | $1,211 |
| #15 | 0 | 1 | $1,211 |
| #16 | 0 | 1 | $1,211 |
| #17 | 0 | 1 | $1,211 |
| #18 | 0 | 1 | $1,211 |
| #19 | 0 | 1 | $1,211 |
| #20 | 0 | 1 | $1,211 |
| #21 | 0 | 1 | $1,211 |
| #22 | 0 | 1 | $1,211 |
| #23 | 0 | 1 | $1,211 |
| #24 | 0 | 1 | $1,211 |
| #25 | 0 | 1 | $1,211 |
| #26 | 0 | 1 | $1,211 |
| #27 | 0 | 1 | $1,211 |
| #28 | 0 | 1 | $1,211 |
| #29 | 0 | 1 | $1,211 |
| #30 | 0 | 1 | $1,211 |
| #31 | 0 | 1 | $1,211 |
| #32 | 0 | 1 | $1,211 |
| #33 | 0 | 1 | $1,211 |
| #34 | 0 | 1 | $1,211 |
| #35 | 0 | 1 | $1,211 |
| #36 | 0 | 1 | $1,211 |
| #37 | 0 | 1 | $1,211 |
| #38 | 0 | 1 | $1,211 |
| #39 | 0 | 1 | $1,211 |
| #40 | 0 | 1 | $1,211 |
| #41 | 0 | 1 | $1,211 |
| #42 | 0 | 1 | $1,211 |
| #43 | 0 | 1 | $1,211 |
| #44 | 0 | 1 | $1,211 |
| #45 | 0 | 1 | $1,211 |
| #46 | 0 | 1 | $1,211 |
| #47 | 0 | 1 | $1,211 |
| #48 | 0 | 1 | $1,211 |
| #49 | 0 | 1 | $1,211 |
| #50 | 0 | 1 | $1,211 |
| #51 | 0 | 1 | $1,211 |
| #52 | 0 | 1 | $1,211 |
| #53 | 0 | 1 | $1,211 |
| #54 | 0 | 1 | $1,211 |
| #55 | 0 | 1 | $1,211 |
| #56 | 0 | 1 | $1,211 |
| #57 | 0 | 1 | $1,211 |
| #58 | 0 | 1 | $1,211 |
| #59 | 0 | 1 | $1,211 |
| #60 | 0 | 1 | $1,211 |
| #61 | 0 | 1 | $1,211 |
| #62 | 0 | 1 | $1,211 |
| #63 | 0 | 1 | $1,211 |
| #64 | 0 | 1 | $1,211 |
| #65 | 0 | 1 | $1,211 |
| #66 | 0 | 1 | $1,211 |
| #67 | 0 | 1 | $1,211 |
| #68 | 0 | 1 | $1,211 |
| #69 | 0 | 1 | $1,211 |
| #70 | 0 | 1 | $1,211 |
| #71 | 0 | 1 | $1,211 |
| #72 | 0 | 1 | $1,211 |
| #73 | 0 | 1 | $1,211 |
| #74 | 0 | 1 | $1,211 |
| #75 | 0 | 1 | $1,211 |
| #76 | 0 | 1 | $1,211 |
| #77 | 0 | 1 | $1,211 |
| #78 | 0 | 1 | $1,211 |
| #79 | 0 | 1 | $1,211 |
| #80 | 0 | 1 | $1,211 |
| #81 | 0 | 1 | $1,211 |
| #82 | 0 | 1 | $1,211 |
| #83 | 0 | 1 | $1,211 |
| #84 | 0 | 1 | $1,211 |
| #85 | 0 | 1 | $1,211 |
| #86 | 0 | 1 | $1,211 |
| #87 | 0 | 1 | $1,211 |
| #88 | 0 | 1 | $1,211 |
| #89 | 0 | 1 | $1,211 |
| #90 | 0 | 1 | $1,211 |
| #91 | 0 | 1 | $1,211 |
| #92 | 0 | 1 | $1,211 |
| #93 | 0 | 1 | $1,211 |
| #94 | 0 | 1 | $1,211 |
| #95 | 0 | 1 | $1,211 |
| #96 | 0 | 1 | $1,211 |
| #97 | 0 | 1 | $1,211 |
| #98 | 0 | 1 | $1,211 |
| #99 | 0 | 1 | $1,211 |
| #100 | 0 | 1 | $1,211 |
| #101 | 0 | 1 | $1,211 |
| #102 | 0 | 1 | $1,211 |
| #103 | 0 | 1 | $1,211 |
| #104 | 0 | 1 | $1,211 |
| #105 | 0 | 1 | $1,211 |
| #106 | 0 | 1 | $1,211 |
| #107 | 0 | 1 | $1,211 |
| #108 | 0 | 1 | $1,211 |
| #109 | 0 | 1 | $1,211 |
| #110 | 0 | 1 | $1,211 |
| #111 | 0 | 1 | $1,211 |
| #112 | 0 | 1 | $1,211 |
| #113 | 0 | 1 | $1,211 |
| #114 | 0 | 1 | $1,211 |
| #115 | 0 | 1 | $1,211 |
| #116 | 0 | 1 | $1,211 |
| Total (116 units) | $140,434 | ||
UW: 25.0% down · 7.5% · 30yr · 1.5% tax · 5.0% vac · 8.0% maint · 8.0% mgmt
Financing live
Cash to close
- Down payment
- $2,250,000
- Closing costs
- $270,000
- Reserves months
- —
- Total cash needed
- —
Loan-product check · same deal, 3 products live
Conventional
25% down · 7.5% · 30yr
- Down + closing
- —
- Monthly P&I
- —
- Monthly cashflow
- —
- DSCR
- —
- Eligible?
- —
Personal DTI + credit; lowest rate.
DSCR
20% down · 8.5% · 30yr
- Down + closing
- —
- Monthly P&I
- —
- Monthly cashflow
- —
- DSCR
- —
- Eligible?
- —
No personal income docs; deal must DSCR.
Hard money
10% down · 12.0% · 12mo
- Down + closing
- —
- Monthly P&I
- —
- Monthly cashflow
- —
- DSCR
- —
- Eligible?
- —
Short-term bridge; refi at stabilization.
Listing history 18 events
-
2026-06-21days on market $9,000,000 Active 628 DOM
-
2026-06-18days on market $9,000,000 Active 625 DOM
-
2026-06-17days on market $9,000,000 Active 624 DOM
-
2026-06-16days on market $9,000,000 Active 623 DOM
-
2026-06-15days on market $9,000,000 Active 622 DOM
-
2026-06-13days on market $9,000,000 Active 620 DOM
-
2026-06-13days on market $9,000,000 Active 619 DOM
-
2026-06-09days on market $9,000,000 Active 616 DOM
-
2026-06-08days on market $9,000,000 Active 615 DOM
-
2026-06-07days on market $9,000,000 Active 614 DOM
-
2026-06-04days on market $9,000,000 Active 611 DOM
-
2026-06-03days on market $9,000,000 Active 610 DOM
-
2026-06-02days on market $9,000,000 Active 609 DOM
-
2026-06-01days on market $9,000,000 Active 608 DOM
-
2026-05-31days on market $9,000,000 Active 607 DOM
-
2024-10-01$9,000,000 Active 508-char remark
Show marketing remark (508 chars)
This building is 116 unit hotel/apartment complex: building is two-story concrete block/brick: second floor is concrete: each unit is 300 ft. ² MOL efficiency apartments: new roof in 2024: building is being totally remodeled and has land to build on an additional 100 units MOL: you can rent these units by the day, week, month, or year: if you rent by the week at $350 per unit proforma income is $2,111,200 with the expenses at $844,480 and your net income will be $1,266,720. Total Acreage - 5+ acres
-
2023-10-24soldstatus $1,200
-
2010-12-30soldstatus $500,000
ⓘ Source: listings_history table (triggers on properties + properties_extension) + one-shot
backfill from property_details.listing_events for pre-trigger history.
Nearby sold comps map
Loading sold comps map…
Walkable amenities ~0.75 mi
Loading nearby amenities…
Taxation est. · year 1
- Rental income
- $1,685,208
- − Mortgage interest
- −$504,140
- − Property taxes
- −$135,000
- − Insurance
- −$45,000
- − Repairs & maintenance
- −$134,817
- − Management
- −$134,817
- − Depreciation
- −$261,818
- Taxable income
- $469,617
- Est. tax owed @ 24.0%
- −$112,708
- After-tax cash flow
- $472,243/yr
For passive investors: Depreciation is non-cash, so a rental often shows a tax loss while cash-flowing — sheltering income. Rental losses are passive: they offset passive income freely, and up to $25,000/yr can offset ordinary (W-2) income if you actively participate and your MAGI is under $100k (phasing out to $0 by $150k); unused losses carry forward. On sale, claimed depreciation is recaptured at up to 25%, and gains may owe capital-gains tax (a 1031 exchange can defer both). Figures are a year-1 estimate at your 24.0% rate — not tax advice; consult a CPA.
Schools (NCES district)
- District
- Hillsborough
- NCES district ID
- 1200870
- Math proficiency
- 47% ▼ -8.00%
- Reading proficiency
- 50% ▼ -4.00%
- Median HH income
- $50,622
- Composite
- 41.6/100
- National rank
- #3435
- State rank
- #41 of 73 in FL
Livability — Tampa
- Score
- 79/100
- State rank
- #142
- US rank
- #2135
Category grades
Schools grade is shown separately in the Schools card above.
Census & demographics
- Census place
- Tampa, FL
- County
- Hillsborough County · 1,540,968 people
- City population
- 523,346
- Metro
- Tampa-St. Petersburg-Clearwater, FL
- Population (ZIP)
- 16,030
- Household income
- $36,975
- Rent vs Own
- Severe rent burden
- 1374.0
Population outlook (Hillsborough County) Hauer SSP2
- Today (2025)
- 1,607,022 people
- By 2030
- 1,733,968 · +7.9%
- By 2040
- 1,979,565 · +23.2%
- By 2050
- 2,203,427 · +37.1%
- By 2075
- 2,667,893 · +66.0%
- By 2100
- 2,891,558 · +79.9%
Race, ethnicity, and origin ACS 2023
- Neighborhood character
- Diverse neighborhood (Simpson 0.66)
- Race & ethnicity
- Black 48% Hispanic / Latino 28% Two or more races 18% White 17% Asian 1%
- Hispanic origin (detail)
- Mexican 6% Puerto Rican 8% Cuban 6% Dominican 1%
- Common ancestry
- Hispanic 2% Romanian 1% Lithuanian 1%
- Foreign-born
- 17% · Canada, Vietnam, Jamaica
- Languages at home
- 72% English-only · Spanish 24% French/Haitian/Cajun 3% Other Asian/Pacific 1%
Political lean MEDSL · Hillsborough
- 2024 margin
- Toss-up / Even · D 47.8% · R 50.9% · Other 1.3%
- 2008→2024 swing
- -10.2pp toward R · 2008: 7.1pp · 2024: -3.1pp
- All cycles
- 2024: R+3.1 2020: D+6.9 2016: D+6.8 2012: D+6.7 2008: D+7.1
Not yet ingested
- Civics
- —
Market trends
- HPI YoY
- ▲ 17.43%
- Current HPI
- 494.1871
- Rent YoY
- ▲ 0.58%
- Metro
- Tampa-St. Petersburg-Clearwater, FL
- State GDP YoY
- ▲ 3.28%
- F500 in state
- 36
Industry mix (Fortune 500 HQ in FL)
| Industry | F500 HQs | Revenue |
|---|---|---|
| Industrial Technology | 2 | $29B |
|
||
| Insurance | 2 | $17B |
|
||
| Retail | 1 | $60B |
|
||
| Technology Distribution | 1 | $58B |
|
||
| Homebuilding | 1 | $35B |
|
||
| Technology Manufacturing | 1 | $35B |
|
||
Price history
+1700.0% since first listed3 events — show timeline
- 2024-10-01 Listed $9,000,000 Stellar MLS as Distributed by MLS Grid
- 2023-10-24 Sold (Public Records) $1,200 Public Records
- 2010-12-30 Sold (Public Records) $500,000 Public Records
Property tax history
+6.3%/yrLatest (2025): $2,954 · +3.4% YoY. Source: county tax records.
Cash-flow waterfall
monthlySold comps — $/sqft
last 12 mo · ≤1 miLoading sold comps…