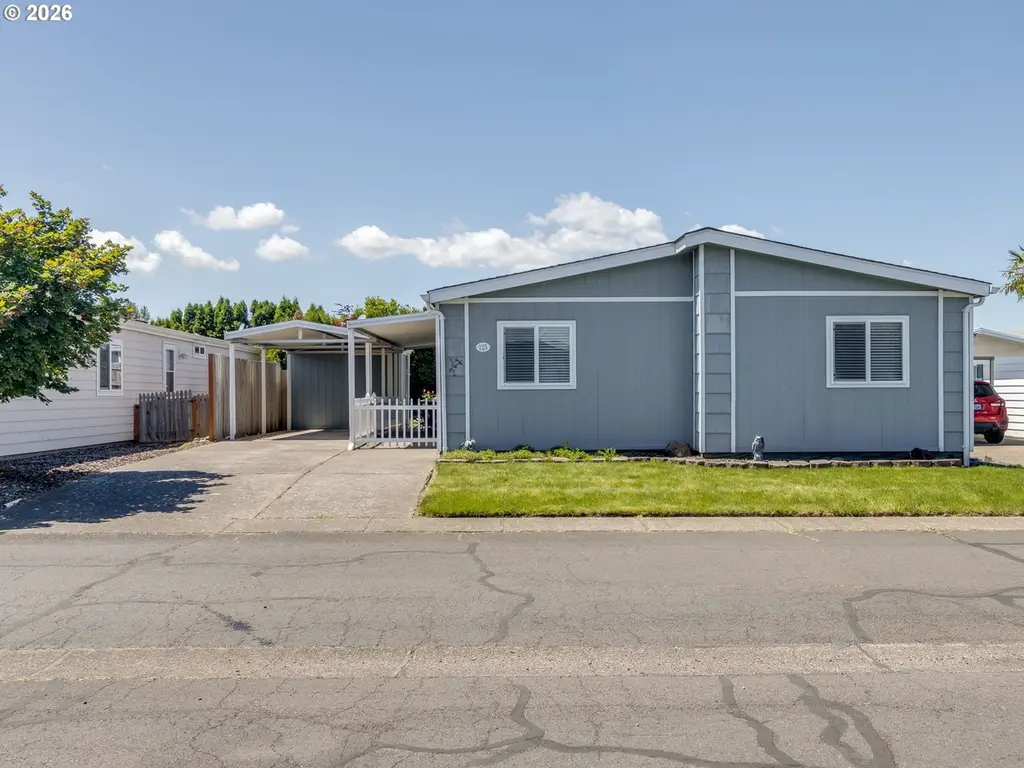
4730 NE Auburn Rd #125 · Four Corners, OR
Flood risk 1/10 · Minimal
- FEMA flood zone
- X (unshaded)
- Chance of flooding over 30 yrs
- 0.0%
- Est. flood insurance / yr
- $507 – $1,088
Fire risk 4/10 · Minor
- Est. fire insurance / yr
- $498 – $926
Heat risk 4/10 · Minor
- Hot days now (above 91°F)
- 7 days/yr
- Hot days in 30 yrs
- 14 days/yr
Wind risk 1/10 · Minimal
- Chance of severe wind over 30 yrs
- —
Air-quality risk 9/10 · Severe
- Unhealthy air days now
- 12 days/yr
- Unhealthy air days in 30 yrs
- 13 days/yr
Risk factors via First Street. Map © Google.
Why this score? — see what drove the C+ grade
The composite is a weighted blend of 9 inputs, each scored 0–100. Each bar is that input's sub-score; the figure is the points it added to the 100-point composite (weight × sub-score).
- Cash flow +30.0/30.0
- 1% rule +10.0/10.0
- DSCR +10.0/10.0
- Livability +3.9/5.0
- Schools +3.7/10.0
- Condition / age +2.5/5.0
- Rent growth +2.3/5.0
- ARV discount +0.5/15.0
- Appreciation +0.0/10.0
$129,900
🖨 Deal sheet 📄 Offer letter ✓ Due diligence
Listing remarks MLS
Well-maintained 3 bedroom, 2 bath manufactured home in a desirable park setting! Major updates within the last 8 years include heat & air, water heater, windows, roof, interior paint, and flooring. Clean, comfortable, and move-in ready with many big-ticket items already completed. Pride of ownership shows throughout, offering affordable, low-maintenance living in great condition!
Key facts
- Water heater
- Interior paint
- Major updates
Tags
Property features AI
Finance
- Other: Property type: Residential (manufactured home in park); Resale property
- HOA & community: Located in Salem Greene Estates (senior community); Land lease: No
Exterior
- Parking: Carport; Driveway
- Utilities: Public water; Public sewer; Electric service
- Home design: Manufactured home in a park; Single-story (main level living); No notable view
- Construction: Built in 1986; Skirting foundation; Composition roof
- Exterior features: T-111 siding; Level lot; Paved road access; Lot rent $800 per month (space in a park)
Interior
- Kitchen: Kitchen (appliances: electric hot water)
- Bedrooms: Primary bedroom on the main level; Second bedroom on the main level; Third bedroom on the main level
- Bathrooms: Two full bathrooms (both on the main level)
- Heating & cooling: Forced air heating; Central air conditioning
- Interior features: Vinyl window frames; Photo slide show virtual tour available
- Laundry & utility: Electric hot water
Neighborhood map
What this means for you Summary
Snapshot
- This is a 3-bed/2.0-bath manufactured listed at $130k.
Deal economics
- At list price, monthly cash flow is $801 ($10k/yr) — positive.
- The deal already cash-flows at list — no discount required.
- Meets the 1% rule at list price ($2k rent vs $130k).
- Recommended offer: $128k (1.5% below list) — sets the bar for market timing.
- Cap rate 13.7% vs local median 3.9% in Four Corners — top-decile yield for the area; either an underpriced asset or a hidden risk that comps aren't pricing in. Stress-test before assuming the spread holds.
Location & tenants
- Location reads 78/100 on livability (#66 in OR, #2,680 nationally) — a middle-class / working-renter tenant base. Strengths: housing A+, health & safety A+, amenities B+; Watch: crime D-.
- Salem-Keizer SD 24J (urban): math 34% / reading 47% proficiency, ranked #103 of 183 in OR (top 56%) — families likely to look elsewhere, expect single-tenant / working-renter base with shorter leases.
- Zoned schools: North Salem High School (2,239 students, 74% FRL) — zoned schools average 74% FRL vs 53% district-wide (21 pts higher); higher-poverty schools than district average — tighter screening recommended.
- Market conditions: Rents soft (-0.7%/yr); 276 active listings in the ZIP; 32 comparable units currently listed for rent nearby; rentals at typical pace (median 23d on market — plan ~3-4 weeks tenant-placement turnaround); 1,591 units permitted in Marion County in 2024 (716 in 5+ unit buildings).
- This rent runs 40% of the median local income ($60k/yr) — at the standard rent-burdened threshold; future hikes will face affordability resistance.
Forward outlook
- Local home prices are declining (-3.0%/yr); year-one equity from $898 of loan paydown is wiped out by about $4k of value loss. Plan a longer hold.
- Marion County population projected at +17% by 2050 — long-run rental-demand tailwind backs the buy-and-hold thesis.
- At projected returns (-3.0% appreciation + 0.0% rent growth), your $36k cash investment doubles in ~6 years — after that, you're playing with house money.
Negotiation context
- It's been on market 28 days — a 2% lower offer ($128k) is reasonable based on typical stale-listing flexibility.
- 3 sale attempts since 9y ago with the ask held roughly flat each time — persistent listings suggest the price (not the market) is what's stuck; bring a comps-based counter.
- Current owner paid $39k; list at $130k implies a 234% gain — meaningful room to come down on a strong offer.
Questions for the listing agent
- Is there a deadline driving the sale (1031 exchange, divorce, estate, relocation)? That informs how much negotiation room exists.
- Schools are D-rated, which usually means shorter tenancies and higher turnover. Who's the typical renter profile here, and what's been the actual vacancy rate?
- Crime grade is D in this area — have there been break-ins, vandalism, or insurance claims at this property in the last 3 years? What carrier currently insures it and at what premium?
- What's the average days-on-market for RENTAL listings here right now (not sales)? A rising rental-DOM trend means longer vacancies and softer asking-rent achievability than the comps imply.
- What's the recent tenant-quality profile in this submarket — average credit score on applications, eviction rate, late-payment / NSF rate, and stable-employment percentage? A property-management company in the area should have these aggregated.
- How much new for-sale + rental construction is in the pipeline within 1–3 miles? Heavy new supply typically softens prices + rents 12–24 months out; constrained supply supports both.
Investment metrics
- 1% rule
- 1.57% ✓
- Cap rate
- 13.70%
- Cash-on-cash
- 26.44%
- DSCR
- 2.18
- GRM
- 5.3
CMA / ARV
- ARV (on-the-fly)
- $112,455
- Comps found
- 12
Show comp detail 12 sales within ~0.75 mi
| Address | Dist | Beds/Ba | Sqft | Sold | Price | $/sf | Match |
|---|---|---|---|---|---|---|---|
| 4730 Auburn Rd NE #43 | 0.00mi | 3/2.0 | 1,336 (+1%) | 1mo | $134,900 | $101 | 98 |
| 4730 Auburn Rd #158 | 0.00mi | 3/2.0 | 1,288 (-3%) | 3mo | $61,500 | $48 | 93 |
| 4730 NE Auburn Rd #148 | 0.00mi | 3/2.0 | 1,344 (+2%) | 7mo | $105,000 | $78 | 91 |
| 283 Broadmore Ave NE | 0.15mi | 3/2.0 | 1,342 (+1%) | 2mo | $60,000 | $45 | 89 |
| 4730 Auburn Rd NE #20 | 0.00mi | 2/2.0 (-1) | 1,440 (+9%) | 4mo | $85,000 | $59 | 77 |
| 4637 Amber St NE | 0.24mi | 2/2.0 (-1) | 1,344 (+2%) | 7mo | $37,000 | $28 | 75 |
| 663 Royalty Cir NE | 0.36mi | 2/2.0 (-1) | 1,404 (+6%) | 4mo | $164,900 | $117 | 65 |
| 857 Hoffman Rd | 0.66mi | 3/2.0 | 1,296 (-2%) | 6mo | $110,000 | $85 | 61 |
| 857 Hoffman Rd NE #11 | 0.66mi | 3/2.0 | 1,296 (-2%) | 6mo | $110,000 | $85 | 61 |
| 382 Chadbourne Ln NE | 0.24mi | 3/2.0 | 1,512 (+14%) | 9mo | $385,000 | $255 | 58 |
| 148 47th Ave NE | 0.29mi | 2/2.0 (-1) | 1,128 (-15%) | 11mo | $77,000 | $68 | 48 |
| 997 Wind Meadows Way #64 | 0.74mi | 4/2.0 (+1) | 1,512 (+14%) | 2mo | $134,999 | $89 | 35 |
Match score weights: distance 35% · size 25% · config 20% · recency 20%. Top-matched comps best support the ARV.
Projected returns pro-forma
-3.0% appreciation · 0.0% rent growth · sell at horizon
- IRR
- 17.0%
- Equity multiple
- 1.66×
- Total profit
- $23,994
- Equity at exit
- $19,369
- IRR
- 23.3%
- Equity multiple
- 2.74×
- Total profit
- $63,447
- Equity at exit
- $11,231
Cash invested: $36,372 (down + closing). Projections, not guarantees.
Landlord ↔ Tenant lean methodology
- Overall (STATE)
- 28 Tenant-Leaning
- State Oregon
- 28 Tenant-Leaning · D+6
- County
- — inherits STATE
- City
- — inherits STATE
ZIP-level market 97301
- Rents YoY
- -0.7%
- Active inventory
- 276
- Price-to-rent
- 5.3×
Monthly cashflow live
- Estimated rent
- $2,036 high interval (Pro) →
- Mortgage (P&I)
- −$681
- Tax from tax record
- −$72 /mo · $863/yr
- Insurance
- −$54
- HOA
- −$0
- Vacancy / Maint / Mgmt
- −$428
- Net cashflow
- $801
Break-even live
UW: 25.0% down · 7.5% · 30yr · 1.5% tax · 5.0% vac · 8.0% maint · 8.0% mgmt
Financing live
Cash to close
- Down payment
- $32,475
- Closing costs
- $3,897
- Reserves months
- —
- Total cash needed
- —
Loan-product check · same deal, 3 products live
Conventional
25% down · 7.5% · 30yr
- Down + closing
- —
- Monthly P&I
- —
- Monthly cashflow
- —
- DSCR
- —
- Eligible?
- —
Personal DTI + credit; lowest rate.
DSCR
20% down · 8.5% · 30yr
- Down + closing
- —
- Monthly P&I
- —
- Monthly cashflow
- —
- DSCR
- —
- Eligible?
- —
No personal income docs; deal must DSCR.
Hard money
10% down · 12.0% · 12mo
- Down + closing
- —
- Monthly P&I
- —
- Monthly cashflow
- —
- DSCR
- —
- Eligible?
- —
Short-term bridge; refi at stabilization.
Rent comps 32 comps
| Address | Beds | Baths | Sqft | Rent | $/sqft | DOM | Units | Dist |
|---|---|---|---|---|---|---|---|---|
| 434 Greencrest St NE Salem, OR | 3.0 | 2.0 | 1637 | $3,900 | $2.38 | 23d | 1 | 0.24mi |
| 4485 Monroe Ave NE Salem, OR | 4.0 | 2.0 | 1200 | $2,195 | $1.83 | 43d | 1 | 0.25mi |
| 412 Lost Lake St NE Salem, OR | 4.0 | 3.0 | 1662 | $2,495 | $1.50 | 23d | 1 | 0.28mi |
| 4833 Thyme Ave NE Salem, OR | 3.0 | 2.5 | 1681 | $2,545 | $1.51 | 13d | 1 | 0.29mi |
| 143 Connecticut Ave SE Unit 145 Salem, OR | 3.0 | 1.0 | 1207 | $1,595 | $1.32 | 13d | 1 | 0.38mi |
| 124 Stafford Ln NE Unit 124-203 Salem, OR | 3.0 | 2.0 | 1052 | $1,595 | $1.52 | 43d | 1 | 0.47mi |
| 102 Greencrest St NE Salem, OR | 3.0 | 1.0–2.0 | 914 | $2,205 | $2.41 | 13d | 25 | 0.47mi |
| 4433 Mahrt Ave SE Unit 4435-201 Salem, OR | 2.0 | 2.0 | 888 | $1,525 | $1.72 | 23d | 1 | 0.51mi |
| 4433 Mahrt Ave SE Unit 4437-206 Salem, OR | 2.0 | 2.0 | 932 | $1,525 | $1.64 | 43d | 1 | 0.51mi |
| 435 Fountain Valley Way NE Salem, OR | 1.0–2.0 | 1.0–2.0 | 939 | $1,559 | $1.66 | 21d | 5 | 0.60mi |
| 4836 Tanglewood Ct SE Salem, OR | 3.0 | 2.0 | 1316 | $2,150 | $1.63 | 23d | 1 | 0.61mi |
| 178 Lancaster Dr SE Salem, OR | 2.0 | 2.0 | 952 | $1,495 | $1.57 | 13d | 1 | 0.82mi |
| 295 Colt Ln NE Salem, OR | 3.0 | 2.0 | 1052 | $1,575 | $1.50 | 13d | 1 | 0.83mi |
| 430 Brittany Way NE Unit 369-421 Salem, OR | 2.0 | 2.0 | 920 | $1,400 | $1.52 | 43d | 1 | 0.86mi |
| 3750-3762 Amber St NE Unit 3758-107 Salem, OR | 2.0 | 2.5 | 1150 | $1,595 | $1.39 | 23d | 1 | 0.88mi |
| 3750-3762 Amber St NE Unit 3762-107 Salem, OR | 2.0 | 2.5 | 1150 | $1,595 | $1.39 | 43d | 1 | 0.88mi |
| 4807 Chinook Ct SE Salem, OR | 3.0 | 1.5 | 1104 | $2,200 | $1.99 | 13d | 1 | 0.97mi |
| 3897 Meadowlawn Loop SE Salem, OR | 1.0–3.0 | 1.0–2.0 | 962 | $1,958 | $2.03 | 13d | 26 | 1.06mi |
| 4776 Buffalo Dr SE Salem, OR | 3.0 | 1.0 | 1369 | $2,150 | $1.57 | 43d | 1 | 1.08mi |
| 3828 Bayonne Dr SE Salem, OR | 2.0 | 1.0 | 980 | $1,299 | $1.33 | 13d | 1 | 1.08mi |
| 3822 Bayonne Dr SE Salem, OR | 2.0 | 1.0 | 980 | $1,299 | $1.33 | 23d | 1 | 1.09mi |
| 1029 Raffon Ct SE Unit AR7171-3 Salem, OR | 2.0 | 1.5 | 927 | $1,700 | $1.83 | 23d | 1 | 1.14mi |
| 3695 D St NE Salem, OR | 1.0–2.0 | 1.0–2.0 | 1037 | $1,650 | $1.59 | 43d | 3 | 1.24mi |
| 5192 Caplinger Rd SE Salem, OR | 1.0–3.0 | 1.0–2.0 | 927 | $1,802 | $1.94 | 13d | 25 | 1.29mi |
| 4098 Market St NE Unit MT21 Salem, OR | 2.0 | 1.0 | 900 | $1,275 | $1.42 | 23d | 1 | 1.31mi |
| 990 Charter Pl NE Salem, OR | 3.0 | 2.5 | 1248 | $1,895 | $1.52 | 43d | 1 | 1.39mi |
| 1973 45th Ave NE Salem, OR | 2.0 | 1.0–2.0 | 1043 | $1,360 | $1.30 | 13d | 2 | 1.41mi |
| 4976 Turquoise Ave SE Salem, OR | 2.0 | 2.0 | 918 | $1,495 | $1.63 | 13d | 5 | 1.41mi |
| 1447 Connecticut St SE Salem, OR | 3.0 | 2.0 | 1258 | $2,675 | $2.13 | 43d | 1 | 1.42mi |
| 4200 Sunnyview Rd NE Salem, OR | 2.0 | 1.0–2.0 | 880 | $1,445 | $1.64 | 23d | 1 | 1.44mi |
| 3301 D St NE Salem, OR | 2.0 | 1.0 | 850 | $1,225 | $1.44 | 23d | 4 | 1.44mi |
| 4154 Sunnyview Rd NE Salem, OR | 1.0–2.0 | 1.0 | 806 | $1,375 | $1.71 | 13d | 6 | 1.50mi |
Listing history 19 events
-
2026-06-18days on market $129,900 Active 28 DOM
-
2026-06-17days on market $129,900 Active 27 DOM
-
2026-06-16days on market $129,900 Active 26 DOM
-
2026-06-15days on market $129,900 Active 25 DOM
-
2026-06-14days on market $129,900 Active 23 DOM
-
2026-06-10days on market $129,900 Active 20 DOM
-
2026-06-09days on market $129,900 Active 19 DOM
-
2026-06-08days on market $129,900 Active 18 DOM
-
2026-06-07days on market $129,900 Active 17 DOM
-
2026-06-03days on market $129,900 Active 13 DOM
-
2026-06-02days on market $129,900 Active 12 DOM
-
2026-06-01days on market $129,900 Active 11 DOM
-
2026-05-31days on market $129,900 Active 10 DOM
-
2026-05-30days on market $129,900 Active 9 DOM
-
2026-05-21$129,900 Active
Show marketing remark (386 chars)
Well-maintained 3 bedroom, 2 bath manufactured home in a desirable park setting! Major updates within the last 8 years include heat & air, water heater, windows, roof, interior paint, and flooring. Clean, comfortable, and move-in ready with many big-ticket items already completed. Pride of ownership shows throughout, offering affordable, low-maintenance living in great condition!
-
2026-05-21$129,900 Active 386-char remark
Show marketing remark (386 chars)
Well-maintained 3 bedroom, 2 bath manufactured home in a desirable park setting! Major updates within the last 8 years include heat & air, water heater, windows, roof, interior paint, and flooring. Clean, comfortable, and move-in ready with many big-ticket items already completed. Pride of ownership shows throughout, offering affordable, low-maintenance living in great condition!
-
2017-09-14soldstatus $38,900 Sold 129-char remark
Show marketing remark (129 chars)
Quality built 3 bdrm 2 ba dbl wide in gated 55+ community. Off set home, front and rear floor plan with tape and textured walls.
-
2017-08-25Active under Contract 129-char remark
Show marketing remark (129 chars)
Quality built 3 bdrm 2 ba dbl wide in gated 55+ community. Off set home, front and rear floor plan with tape and textured walls.
-
1991-05-01soldstatus $43,500
ⓘ Source: listings_history table (triggers on properties + properties_extension) + one-shot
backfill from property_details.listing_events for pre-trigger history.
Tax reassessment forecast OR · Resets to sale price
- Current annual tax
- $863 · $72/mo
- Projected year-2 tax
- $1,260 · $105/mo
- Expected delta
- +$397/yr (+$33/mo · 46.0%)
ⓘ Screening estimate from a state-policy table — verify with the county assessor before closing.
Climate risk First Street
- Flood 1/10 Low FEMA zone X (unshaded) · 0% chance over 30 yrs
- Wildfire 4/10 Moderate
- Heat 4/10 Moderate 7 d/yr ≥91°F today · 14 d/yr by 30 yrs out
- Wind 1/10 Low
- Air quality 9/10 Extreme 12 unhealthy d/yr today · 13 by 30 yrs out
Nearby sold comps map
Loading sold comps map…
Walkable amenities ~0.75 mi
Loading nearby amenities…
Taxation est. · year 1
- Rental income
- $24,434
- − Mortgage interest
- −$7,276
- − Property taxes
- −$863
- − Insurance
- −$650
- − Repairs & maintenance
- −$1,955
- − Management
- −$1,955
- − Depreciation
- −$3,779
- Taxable income
- $7,956
- Est. tax owed @ 24.0%
- −$1,910
- After-tax cash flow
- $7,706/yr
For passive investors: Depreciation is non-cash, so a rental often shows a tax loss while cash-flowing — sheltering income. Rental losses are passive: they offset passive income freely, and up to $25,000/yr can offset ordinary (W-2) income if you actively participate and your MAGI is under $100k (phasing out to $0 by $150k); unused losses carry forward. On sale, claimed depreciation is recaptured at up to 25%, and gains may owe capital-gains tax (a 1031 exchange can defer both). Figures are a year-1 estimate at your 24.0% rate — not tax advice; consult a CPA.
Schools (NCES district)
- District
- Salem-Keizer SD 24J
- NCES district ID
- 4110820
- Math proficiency
- 34% ▼ -1.00%
- Reading proficiency
- 47% ▼ -2.00%
- Median HH income
- $48,632
- Composite
- 37.16/100
- National rank
- #9017
- State rank
- #103 of 183 in OR
Livability — Four Corners
- Score
- 78/100
- State rank
- #66
- US rank
- #2680
Category grades
Schools grade is shown separately in the Schools card above.
Census & demographics
- Census place
- Four Corners, OR
- County
- Marion County · 258,219 people
- Metro
- Salem, OR
- Population (ZIP)
- 57,574
- Household income
- $60,422
- Rent vs Own
- Severe rent burden
- 3089.0
Population outlook (Marion County) Hauer SSP2
- Today (2025)
- 360,940 people
- By 2030
- 375,178 · +3.9%
- By 2040
- 400,914 · +11.1%
- By 2050
- 422,187 · +17.0%
- By 2075
- 460,305 · +27.5%
- By 2100
- 464,025 · +28.6%
Race, ethnicity, and origin ACS 2023
- Neighborhood character
- Diverse neighborhood (Simpson 0.58)
- Race & ethnicity
- White 55% Hispanic / Latino 35% Two or more races 19% Asian 2% Black 2% Native American 1% Pacific Islander 1%
- Hispanic origin (detail)
- Mexican 31%
- Common ancestry
- Italian 4% Portuguese 2% Lithuanian 2%
- Foreign-born
- 17% · Canada, China, Philippines
- Languages at home
- 68% English-only · Spanish 27% Other Asian/Pacific 1% Russian/Polish/Slavic 1%
Political lean MEDSL · Marion
- 2024 margin
- Toss-up / Even · D 47.5% · R 49.5% · Other 3.0%
- 2008→2024 swing
- -4.2pp toward R · 2008: 2.2pp · 2024: -2.0pp
- All cycles
- 2024: R+2.0 2020: D+1.1 2016: R+5.0 2012: R+3.5 2008: D+2.2
Not yet ingested
- Civics
- —
Market trends
- HPI YoY
- ▼ -548.17%
- Current HPI
- 335.8199
- Rent YoY
- ▼ -0.70%
- Metro
- Salem, OR
- State GDP YoY
- ▲ 2.05%
- F500 in state
- 2
Industry mix (Fortune 500 HQ in OR)
| Industry | F500 HQs | Revenue |
|---|---|---|
| Consumer Goods | 1 | $51B |
|
||
Price history
+198.6% since first listed5 events — show timeline
- 2026-05-21 Listed $129,900 WVMLS
- 2026-05-21 Listed $129,900 RMLS
- 2017-09-14 Sold (MLS) $38,900 WVMLS
- 2017-08-25 Listed — WVMLS
- 1991-05-01 Sold (Public Records) $43,500 Public Records
Property tax history
+4.3%/yrLatest (2025): $863 · +3.0% YoY. Source: county tax records.
Cash-flow waterfall
monthlySold comps — $/sqft
last 12 mo · ≤1 miLoading sold comps…