None · Homeland Park, SC
Flood risk 1/10 · Minimal
- FEMA flood zone
- X (unshaded)
- Chance of flooding over 30 yrs
- 0.0%
- Est. flood insurance / yr
- $507 – $1,088
Fire risk 3/10 · Minor
- Est. fire insurance / yr
- $783 – $1,453
Heat risk 6/10 · Moderate
- Hot days now (above 105°F)
- 7 days/yr
- Hot days in 30 yrs
- 17 days/yr
Wind risk 3/10 · Minor
- Chance of severe wind over 30 yrs
- 7.0%
Air-quality risk 3/10 · Minor
- Unhealthy air days now
- 3 days/yr
- Unhealthy air days in 30 yrs
- 3 days/yr
Risk factors via First Street. Map © Google.
Why this score? — see what drove the B- grade
The composite is a weighted blend of 9 inputs, each scored 0–100. Each bar is that input's sub-score; the figure is the points it added to the 100-point composite (weight × sub-score).
- Cash flow +30.0/30.0
- DSCR +10.0/10.0
- 1% rule +9.3/10.0
- ARV discount +7.5/15.0
- Schools +3.9/10.0
- Livability +2.8/5.0
- Rent growth +2.5/5.0
- Condition / age +1.0/5.0
- Appreciation +0.0/10.0
$93,600
🖨 Deal sheet (PDF) 📄 Offer letter ✓ Due diligence
Listing remarks
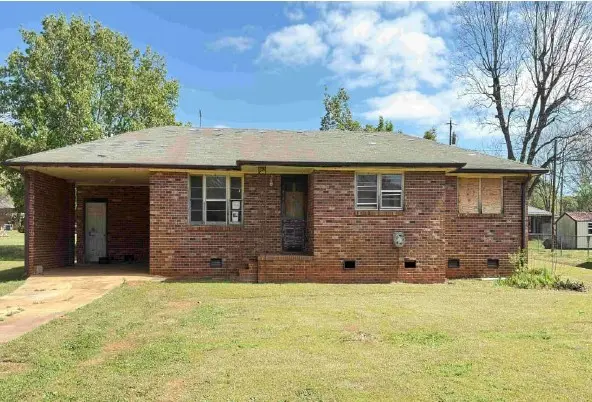
AUCTION. Affordable fixer upper will require your renovation ideas but well worth the effort. This brick ranch offers 3 beds, 2 baths, living room, dining room, kitchen will ample storage, and the home sits on a large lot with an attached carport. The home is in poor condition and will require repairs to include roof, flooring throughout, windows and other cosmetic updates. Property is sold as-is with NO property disclosure or inspection reports. NO ACCESS due to UNSAFE conditions.
Key facts
- Garage
- Built 1978
- Listed 36 days
Property features AI
Exterior
- Parking: Attached carport; 1-car garage
- Utilities: Public sewer
- Home design: Single-story home; Brick construction
- Construction: Brick exterior; Built 31–50 years ago; Crawlspace foundation
- Exterior features: Outside city limits; Subdivision lot
Interior
- Bedrooms: Three bedrooms on the main level (approx. 12x11, 12x11, 12x14)
- Bathrooms: Two full bathrooms on the main level
- Heating & cooling: Central electric heating; Central electric cooling (central air)
- Interior features: Crawlspace basement
Neighborhood map
What this means for you Summary
Snapshot
- This is a 3-bed/2.0-bath single-family listed at $94k. Condition is rated poor.
Deal economics
- At list price, monthly cash flow is $410 ($5k/yr) — positive.
- The deal already cash-flows at list — no discount required.
- Meets the 1% rule at list price ($1k rent vs $94k).
- Recommended offer: $91k (3.0% below list) — sets the bar for market timing.
- Cap rate 11.5% vs local median 4.8% in Homeland Park — top-decile yield for the area; either an underpriced asset or a hidden risk that comps aren't pricing in. Stress-test before assuming the spread holds.
Location & tenants
- Location reads 56/100 on livability (#299 in SC) — a working-class tenant base; expect higher turnover. Strengths: cost of living A+, housing A-; Watch: health & safety C-, schools F, crime F.
- Anderson 05 (suburban): math 44% / reading 49% proficiency, ranked #20 of 80 in SC (top 25%) — families likely to look elsewhere, expect single-tenant / working-renter base with shorter leases.
- Market conditions: 119 active listings in the ZIP; 2 comparable units currently listed for rent nearby; 1,255 units permitted in Anderson County in 2024 (0 in 5+ unit buildings).
Forward outlook
- Local home prices are declining (-3.0%/yr); year-one equity from $647 of loan paydown is wiped out by about $3k of value loss. Plan a longer hold.
- Anderson County population projected at +14% by 2050 — modest demand growth; plan on rents tracking national, not racing it.
- At projected returns (-3.0% appreciation + 3.0% rent growth), your $26k cash investment doubles in ~7 years — after that, you're playing with house money.
Negotiation context
- It's been on market 37 days — a 3% lower offer ($91k) is reasonable based on typical stale-listing flexibility.
Risks & watch-outs
- Climate carrying-cost: extreme-heat days projected 7→17/yr by 2055 (HVAC capex compounding) — expect insurance premiums to compound above CPI over the hold.
Questions for the listing agent
- It's been on market 37 days. Have you received any prior offers? Is the seller open to a 3% concession, seller financing, or rate buy-down credit?
- Have any recent inspections been done? Can we get a copy of the seller's disclosures and any deferred-maintenance estimates?
- Built in 1978 — when were the roof, HVAC, electrical panel, plumbing, and water heater last replaced?
- Is there a deadline driving the sale (1031 exchange, divorce, estate, relocation)? That informs how much negotiation room exists.
- Schools are F-rated, which usually means shorter tenancies and higher turnover. Who's the typical renter profile here, and what's been the actual vacancy rate?
- Crime grade is F in this area — have there been break-ins, vandalism, or insurance claims at this property in the last 3 years? What carrier currently insures it and at what premium?
- What's the average days-on-market for RENTAL listings here right now (not sales)? A rising rental-DOM trend means longer vacancies and softer asking-rent achievability than the comps imply.
- What's the recent tenant-quality profile in this submarket — average credit score on applications, eviction rate, late-payment / NSF rate, and stable-employment percentage? A property-management company in the area should have these aggregated.
- How much new for-sale + rental construction is in the pipeline within 1–3 miles? Heavy new supply typically softens prices + rents 12–24 months out; constrained supply supports both.
Investment metrics
- 1% rule
- 1.43% ✓
- Cap rate
- 11.55%
- Cash-on-cash
- 18.77%
- DSCR
- 1.84
- GRM
- 5.8
CMA / ARV
- ARV (on-the-fly)
- $199,511
- Comps found
- 10
Show comp detail 10 sales within ~0.75 mi
| Address | Dist | Beds/Ba | Sqft | Sold | Price | $/sf | Match |
|---|---|---|---|---|---|---|---|
| 3922 Seminole Ave | 0.20mi | 3/2.0 | 1,340 (+0%) | 7mo | $150,200 | $112 | 85 |
| 3892 Seminole Ave | 0.13mi | 3/2.0 | 1,472 (+10%) | 15mo | $234,900 | $160 | 65 |
| 504 Ottawa Cir | 0.25mi | 3/1.5 | 1,176 (-12%) | 10mo | $130,000 | $111 | 58 |
| 3023 Plainview Rd | 0.59mi | 4/2.5 (+1) | 1,346 (+0%) | 10mo | $199,900 | $149 | 56 |
| 901 W Shockley Ferry Rd | 0.33mi | 3/2.5 | 1,206 (-10%) | 12mo | $260,000 | $216 | 56 |
| 508 Cheyenne St | 0.26mi | 3/1.0 | 1,202 (-10%) | 16mo | $140,000 | $116 | 53 |
| 3015 Burson Rd | 0.71mi | 3/2.0 | 1,293 (-3%) | 16mo | $201,000 | $155 | 48 |
| 3022 Plainview Rd | 0.56mi | 3/2.0 | 1,500 (+12%) | 12mo | $175,000 | $117 | 44 |
| 313 Masters Dr | 0.62mi | 2/1.0 (-1) | 1,350 (+1%) | 21mo | $154,000 | $114 | 43 |
| 3311 New Pond Road Rd | 0.72mi | 3/2.0 | 1,232 (-8%) | 15mo | $195,000 | $158 | 41 |
Match score weights: distance 35% · size 25% · config 20% · recency 20%. Top-matched comps best support the ARV.
Projected returns pro-forma
-3.0% appreciation · 3.0% rent growth · sell at horizon
- IRR
- 10.6%
- Equity multiple
- 1.42×
- Total profit
- $10,958
- Equity at exit
- $13,956
- IRR
- 19.7%
- Equity multiple
- 2.65×
- Total profit
- $43,239
- Equity at exit
- $8,093
Cash invested: $26,208 (down + closing). Projections, not guarantees.
Landlord ↔ Tenant lean methodology
- Overall (STATE)
- 90 Strongly Landlord-Friendly
- State South Carolina
- 90 Strongly Landlord-Friendly · R+6
- County
- — inherits STATE
- City
- — inherits STATE
ZIP-level market 29626
- Home prices YoY
- -19.8%
- Active inventory
- 119
- Price-to-rent
- 5.8×
Monthly cashflow live
- Estimated rent
- $1,338 medium interval (Pro) →
- Mortgage (P&I)
- −$491
- Tax est. 1.5%
- −$117 /mo · $1,404/yr
- Insurance
- −$39
- HOA
- −$0
- Vacancy / Maint / Mgmt
- −$281
- Net cashflow
- $410
Break-even live
Sensitivity live
| Price | -10% $475 | -5% $442 | +0% $410 | +5% $378 | +10% $345 |
|---|---|---|---|---|---|
| Rent | -10% $304 | -5% $357 | +0% $410 | +5% $463 | +10% $516 |
| Rate | -1.0pp $457 | -0.5pp $434 | base $410 | +0.5pp $386 | +1.0pp $361 |
UW: 25.0% down · 7.5% · 30yr · 1.5% tax · 5.0% vac · 8.0% maint · 8.0% mgmt
Financing live
Cash to close
- Down payment
- $23,400
- Closing costs
- $2,808
- Reserves months
- —
- Total cash needed
- —
Loan-product check · same deal, 3 products live
Conventional
25% down · 7.5% · 30yr
- Down + closing
- —
- Monthly P&I
- —
- Monthly cashflow
- —
- DSCR
- —
- Eligible?
- —
Personal DTI + credit; lowest rate.
DSCR
20% down · 8.5% · 30yr
- Down + closing
- —
- Monthly P&I
- —
- Monthly cashflow
- —
- DSCR
- —
- Eligible?
- —
No personal income docs; deal must DSCR.
Hard money
10% down · 12.0% · 12mo
- Down + closing
- —
- Monthly P&I
- —
- Monthly cashflow
- —
- DSCR
- —
- Eligible?
- —
Short-term bridge; refi at stabilization.
Rent comps 2 comps
| Address | Beds | Baths | Sqft | Rent | $/sqft | DOM | Units | Dist |
|---|---|---|---|---|---|---|---|---|
| 109 Corning St Unit A Anderson, SC | 2.0 | 2.0 | 1250 | $1,300 | $1.04 | 11d | 1 | 0.92mi |
| 203B Cromer Rd Anderson, SC | 2.0 | 1.5 | 1000 | $1,395 | $1.40 | 4d | 1 | 1.12mi |
Listing history 16 events
-
2026-06-21days on market $93,600 Active 37 DOM
-
2026-06-18days on market $93,600 Active 34 DOM
-
2026-06-17days on market $93,600 Active 33 DOM
-
2026-06-16days on market $93,600 Active 32 DOM
-
2026-06-15days on market $93,600 Active 31 DOM
-
2026-06-13days on market $93,600 Active 29 DOM
-
2026-06-10days on market $93,600 Active 26 DOM
-
2026-06-09days on market $93,600 Active 25 DOM
-
2026-06-08days on market $93,600 Active 24 DOM
-
2026-06-07days on market $93,600 Active 23 DOM
-
2026-06-05days on market $93,600 Active 20 DOM
-
2026-06-03days on market $93,600 Active 19 DOM
-
2026-06-03days on market $93,600 Active 18 DOM
-
2026-06-01days on market $93,600 Active 17 DOM
-
2026-05-31days on market $93,600 Active 16 DOM
-
2026-05-15$93,600 Active
ⓘ Source: listings_history table (triggers on properties + properties_extension) + one-shot
backfill from property_details.listing_events for pre-trigger history.
Climate risk First Street
- Flood 1/10 Low FEMA zone X (unshaded) · 0% chance over 30 yrs
- Wildfire 3/10 Moderate
- Heat 6/10 Major 7 d/yr ≥105°F today · 17 d/yr by 30 yrs out
- Wind 3/10 Moderate 7% chance of damaging wind over 30 yrs
- Air quality 3/10 Moderate 3 unhealthy d/yr today · 3 by 30 yrs out
Nearby sold comps map
Loading sold comps map…
Walkable amenities ~0.75 mi
Loading nearby amenities…
Taxation est. · year 1
- Rental income
- $16,052
- − Mortgage interest
- −$5,243
- − Property taxes
- −$1,404
- − Insurance
- −$468
- − Repairs & maintenance
- −$1,284
- − Management
- −$1,284
- − Depreciation
- −$2,723
- Taxable income
- $3,645
- Est. tax owed @ 24.0%
- −$875
- After-tax cash flow
- $4,044/yr
For passive investors: Depreciation is non-cash, so a rental often shows a tax loss while cash-flowing — sheltering income. Rental losses are passive: they offset passive income freely, and up to $25,000/yr can offset ordinary (W-2) income if you actively participate and your MAGI is under $100k (phasing out to $0 by $150k); unused losses carry forward. On sale, claimed depreciation is recaptured at up to 25%, and gains may owe capital-gains tax (a 1031 exchange can defer both). Figures are a year-1 estimate at your 24.0% rate — not tax advice; consult a CPA.
Condition & rehab AI · 3 photos
This fixer-upper home requires extensive repairs and updates to its roof, exterior, flooring, windows, interior walls, HVAC system, and landscaping. The home is in poor condition and will require significant investment to bring it up to a livable standard.
Repairs flagged
- Major roof — The roof appears to be in poor condition with visible wear and tear.
- Major exterior siding — The exterior walls are in poor condition with visible damage and missing siding.
- Major flooring — The flooring throughout the home appears to be in poor condition and may need replacement.
- Major windows — The windows appear to be in poor condition with some missing or damaged.
- Major interior walls — The interior walls appear to be in poor condition with visible damage and peeling paint.
- Major HVAC system — The HVAC system appears to be in poor condition and may need replacement.
- Major landscaping — The landscaping and curb appeal are in poor condition with overgrown grass and sparse vegetation.
Value-add opportunities
- Both roof replacement — A new roof will significantly improve the home's appearance and increase its value.
- Both exterior siding repair/replacement — Repairing or replacing the exterior siding will improve the home's curb appeal and increase its value.
- Both flooring replacement — Replacing the flooring throughout the home will improve the home's appearance and increase its value.
- Both window replacement — Replacing the windows will improve the home's energy efficiency and increase its value.
- Both HVAC system replacement — Replacing the HVAC system will improve the home's comfort and increase its value.
- Both landscaping and curb appeal improvements — Improving the landscaping and curb appeal will increase the home's appeal and increase its value.
Renovation cost estimate screening
| Repair item | Severity | Est. cost |
|---|---|---|
| roof · The roof appears to be in poor condition with visible wear and tear. | Major | $15,000–50,000 |
| exterior siding · The exterior walls are in poor condition with visible damage and missing siding. | Major | $15,000–50,000 |
| flooring · The flooring throughout the home appears to be in poor condition and may need replacement. | Major | $15,000–50,000 |
| windows · The windows appear to be in poor condition with some missing or damaged. | Major | $15,000–50,000 |
| interior walls · The interior walls appear to be in poor condition with visible damage and peeling paint. | Major | $15,000–50,000 |
| HVAC system · The HVAC system appears to be in poor condition and may need replacement. | Major | $15,000–50,000 |
| landscaping · The landscaping and curb appeal are in poor condition with overgrown grass and sparse vegetation. | Major | $15,000–50,000 |
| Total estimated repair cost · 7 items | $105,000–350,000 |
Value-add ROI direction
- Both roof replacement — A new roof will significantly improve the home's appearance and increase its value. ↑
- Both exterior siding repair/replacement — Repairing or replacing the exterior siding will improve the home's curb appeal and increase its value. ↑
- Both flooring replacement — Replacing the flooring throughout the home will improve the home's appearance and increase its value. ↑
- Both window replacement — Replacing the windows will improve the home's energy efficiency and increase its value. ↑
- Both HVAC system replacement — Replacing the HVAC system will improve the home's comfort and increase its value. ↑
- Both landscaping and curb appeal improvements — Improving the landscaping and curb appeal will increase the home's appeal and increase its value. ↑
ⓘ Cost ranges are severity-bucket heuristics (US national rule-of-thumb). Get contractor quotes + a written scope before underwriting a rehab budget.
Schools (NCES district)
- District
- Anderson 05
- NCES district ID
- 4500900
- Math proficiency
- 44% ▼ -4.00%
- Reading proficiency
- 49% ▲ 2.00%
- Median HH income
- $39,718
- Composite
- 38.89/100
- National rank
- #4098
- State rank
- #20 of 80 in SC
Livability — Homeland Park
- Score
- 56/100
- State rank
- #299
- US rank
- #23092
Category grades
Schools grade is shown separately in the Schools card above.
Census & demographics
- Census place
- Homeland Park, SC
- Population (ZIP)
- 13,678
Population outlook (Anderson County) Hauer SSP2
- Today (2025)
- 210,546 people
- By 2030
- 217,791 · +3.4%
- By 2040
- 230,643 · +9.5%
- By 2050
- 240,220 · +14.1%
- By 2075
- 259,518 · +23.3%
- By 2100
- 258,696 · +22.9%
Race, ethnicity, and origin ACS 2023
- Neighborhood character
- Predominantly White (70%)
- Race & ethnicity
- White 70% Black 20% Two or more races 4% Hispanic / Latino 4%
- Common ancestry
- Romanian 2% Slovak 2% Danish 1%
- Foreign-born
- 3% · Canada
- Languages at home
- 96% English-only · Spanish 2%
Political lean MEDSL · Anderson
- 2024 margin
- Solid R (+47.4) · D 25.7% · R 73.1% · Other 1.2%
- 2008→2024 swing
- -14.1pp toward R · 2008: -33.3pp · 2024: -47.4pp
- All cycles
- 2024: R+47.4 2020: R+42.0 2016: R+43.7 2012: R+36.4 2008: R+33.3
Not yet ingested
- Civics
- —
Market trends
- HPI YoY
- ▼ -68.00%
- Current HPI
- 274.7245
- Rent YoY
- —
- Metro
- —
- State GDP YoY
- ▲ 4.51%
- F500 in state
- 2
Industry mix (Fortune 500 HQ in SC)
| Industry | F500 HQs | Revenue |
|---|---|---|
| Packaging | 1 | $7B |
|
||
Price history
1 event — show timeline
- 2026-05-15 Listed $93,600 WUMLS
Cash-flow waterfall
monthlySold comps — $/sqft
last 12 mo · ≤1 miLoading sold comps…