4000 Renee Dr · Jonesboro, AR
Flood risk 1/10 · Minimal
- FEMA flood zone
- X
- Chance of flooding over 30 yrs
- 0.0%
- Est. flood insurance / yr
- $507 – $1,088
Fire risk 3/10 · Minor
- Est. fire insurance / yr
- $1,499 – $2,785
Heat risk 5/10 · Moderate
- Hot days now (above 108°F)
- 7 days/yr
- Hot days in 30 yrs
- 20 days/yr
Wind risk 4/10 · Minor
- Chance of severe wind over 30 yrs
- 8.0%
Air-quality risk 1/10 · Minimal
- Unhealthy air days now
- 0 days/yr
- Unhealthy air days in 30 yrs
- 0 days/yr
Risk factors via First Street. Map © Google.
Why this score? — see what drove the B- grade
The composite is a weighted blend of 9 inputs, each scored 0–100. Each bar is that input's sub-score; the figure is the points it added to the 100-point composite (weight × sub-score).
- Cash flow +25.6/30.0
- ARV discount +15.0/15.0
- DSCR +8.5/10.0
- 1% rule +6.2/10.0
- Schools +5.2/10.0
- Livability +3.2/5.0
- Rent growth +2.7/5.0
- Condition / age +2.5/5.0
- Appreciation +0.0/10.0
$167,500
🖨 Deal sheet 📄 Offer letter ✓ Due diligence
Listing remarks MLS
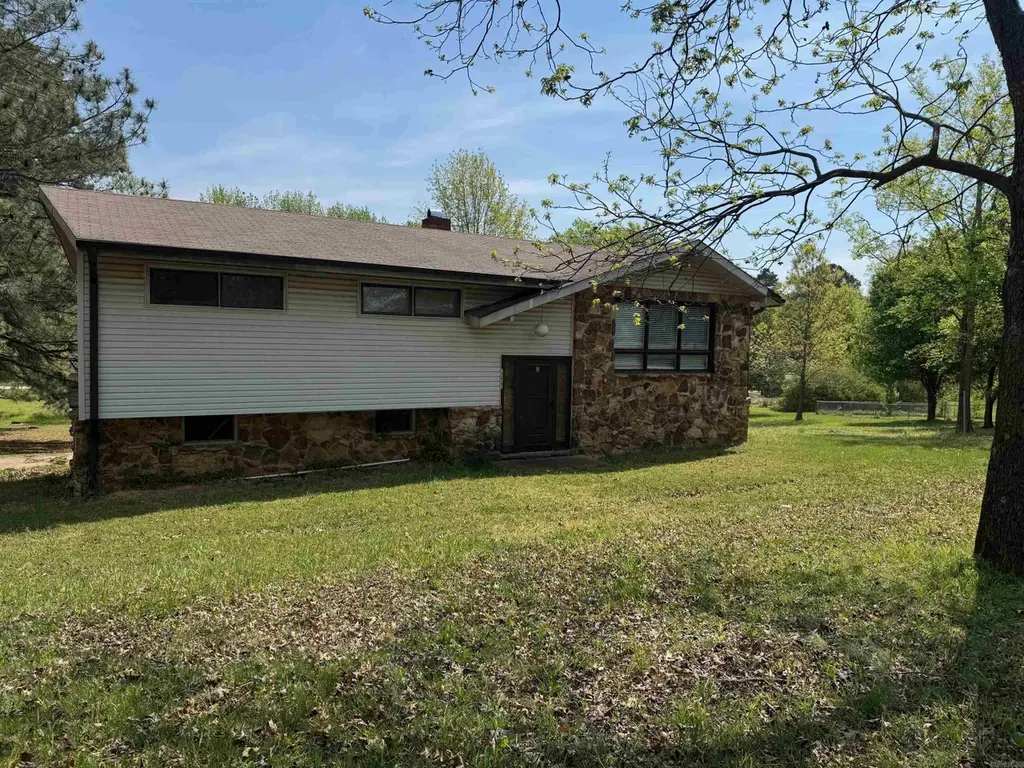
Large home on almost an acre with 5-6 bedrooms and 2.5 baths in Valley View School District on almost an acre. One living area upstairs and one down with a wood burning fireplace. Updated kitchen and hardwood flooring in the upstairs bedrooms are a plus. Hvac is 4-5 years old and the roof is about 10 years old. This one needs some cosmetic updates especially downstairs and is priced to sell. There is an outbuilding in the backyard and several shade trees on this corner lot.
Key facts
- 0.96 acre lot
- 4 parking spots
- Built 1985
Neighborhood map
What this means for you Summary
Snapshot
- This is a 5-bed/2.0-bath single-family listed at $168k.
Deal economics
- At list price, monthly cash flow is $396 ($5k/yr) — positive.
- The deal already cash-flows at list — no discount required.
- Meets the 1% rule at list price ($2k rent vs $168k).
- Recommended offer: $157k (6.0% below list) — sets the bar for market timing.
- Cap rate 9.1% vs local median 4.4% in Jonesboro — top-decile yield for the area; either an underpriced asset or a hidden risk that comps aren't pricing in. Stress-test before assuming the spread holds.
Location & tenants
- Location reads 65/100 on livability (#145 in AR) — a middle-class / working-renter tenant base. Strengths: cost of living A+, housing A+, health & safety A+; Watch: schools D, crime F, amenities F.
- Valley View School District (rural): math 55% / reading 60% proficiency, ranked #4 of 238 in AR (top 2%) — acceptable for families but not a draw, mixed tenant base, ~2y average lease; only 19% free/reduced lunch — higher-income household profile.
- Market conditions: Rents flat; 309 active listings in the ZIP; 926 units permitted in Craighead County in 2024 (69 in 5+ unit buildings).
- This rent runs 32% of the median local income ($70k/yr) — at the standard rent-burdened threshold; future hikes will face affordability resistance.
Forward outlook
- Local home prices are declining (-3.0%/yr); year-one equity from $1k of loan paydown is wiped out by about $5k of value loss. Plan a longer hold.
- Craighead County population projected at +38% by 2050 — long-run rental-demand tailwind backs the buy-and-hold thesis.
Negotiation context
- It's been on market 71 days — a 6% lower offer ($157k) is reasonable based on typical stale-listing flexibility.
- 4 sale attempts with the ask held roughly flat each time — persistent listings suggest the price (not the market) is what's stuck; bring a comps-based counter.
- Current owner paid $91k; list at $168k implies a 84% gain — meaningful room to come down on a strong offer.
Risks & watch-outs
- Climate carrying-cost: extreme-heat days projected 7→20/yr by 2055 (HVAC capex compounding) — expect insurance premiums to compound above CPI over the hold.
Questions for the listing agent
- It's been on market 71 days. Have you received any prior offers? Is the seller open to a 6% concession, seller financing, or rate buy-down credit?
- Why hasn't it sold? Are there any deal-killer items the seller is aware of (foundation, flood, title, zoning, code violations)?
- Is there a deadline driving the sale (1031 exchange, divorce, estate, relocation)? That informs how much negotiation room exists.
- Schools are D-rated, which usually means shorter tenancies and higher turnover. Who's the typical renter profile here, and what's been the actual vacancy rate?
- Crime grade is F in this area — have there been break-ins, vandalism, or insurance claims at this property in the last 3 years? What carrier currently insures it and at what premium?
- What's the average days-on-market for RENTAL listings here right now (not sales)? A rising rental-DOM trend means longer vacancies and softer asking-rent achievability than the comps imply.
- What's the recent tenant-quality profile in this submarket — average credit score on applications, eviction rate, late-payment / NSF rate, and stable-employment percentage? A property-management company in the area should have these aggregated.
- How much new for-sale + rental construction is in the pipeline within 1–3 miles? Heavy new supply typically softens prices + rents 12–24 months out; constrained supply supports both.
Investment metrics
- 1% rule
- 1.12% ✓
- Cap rate
- 9.13%
- Cash-on-cash
- 10.14%
- DSCR
- 1.45
- GRM
- 7.5
CMA / ARV
- ARV (median comp)
- $323,208
- List price
- $167,500
- Delta
- -48.18%
- Verdict
- UNDERPRICED
- Comps
- 20 within 1.0 mi
Show comp detail 1 sale within ~0.75 mi
| Address | Dist | Beds/Ba | Sqft | Sold | Price | $/sf | Match |
|---|---|---|---|---|---|---|---|
| 101 Lincoln Cv | 0.64mi | 4/2.5 (-1) | 2,159 (+8%) | 4mo | $325,000 | $151 | 47 |
Match score weights: distance 35% · size 25% · config 20% · recency 20%. Top-matched comps best support the ARV.
Projected returns pro-forma
-3.0% appreciation · 0.74% rent growth · sell at horizon
- IRR
- -3.5%
- Equity multiple
- 0.87×
- Total profit
- $-6,084
- Equity at exit
- $24,975
- IRR
- 3.5%
- Equity multiple
- 1.23×
- Total profit
- $10,803
- Equity at exit
- $14,482
Cash invested: $46,900 (down + closing). Projections, not guarantees.
Landlord ↔ Tenant lean methodology
- Overall (STATE)
- 92 Strongly Landlord-Friendly
- State Arkansas
- 92 Strongly Landlord-Friendly · R+14
- County
- — inherits STATE
- City
- — inherits STATE
ZIP-level market 72404
- Home prices YoY
- -14.5%
- Rents YoY
- 0.7%
- Active inventory
- 309
- Price-to-rent
- 7.5×
Monthly cashflow live
- Estimated rent
- $1,872 medium interval (Pro) →
- Mortgage (P&I)
- −$878
- Tax from tax record
- −$135 /mo · $1,615/yr
- Insurance
- −$70
- HOA
- −$0
- Vacancy / Maint / Mgmt
- −$393
- Net cashflow
- $396
Break-even live
UW: 25.0% down · 7.5% · 30yr · 1.5% tax · 5.0% vac · 8.0% maint · 8.0% mgmt
Financing live
Cash to close
- Down payment
- $41,875
- Closing costs
- $5,025
- Reserves months
- —
- Total cash needed
- —
Loan-product check · same deal, 3 products live
Conventional
25% down · 7.5% · 30yr
- Down + closing
- —
- Monthly P&I
- —
- Monthly cashflow
- —
- DSCR
- —
- Eligible?
- —
Personal DTI + credit; lowest rate.
DSCR
20% down · 8.5% · 30yr
- Down + closing
- —
- Monthly P&I
- —
- Monthly cashflow
- —
- DSCR
- —
- Eligible?
- —
No personal income docs; deal must DSCR.
Hard money
10% down · 12.0% · 12mo
- Down + closing
- —
- Monthly P&I
- —
- Monthly cashflow
- —
- DSCR
- —
- Eligible?
- —
Short-term bridge; refi at stabilization.
Listing history 23 events
-
2026-06-19days on market $167,500 Active 71 DOM
-
2026-06-18days on market $167,500 Active 70 DOM
-
2026-06-17days on market $167,500 Active 69 DOM
-
2026-06-16days on market $167,500 Active 68 DOM
-
2026-06-15days on market $167,500 Active 67 DOM
-
2026-06-14days on market $167,500 Active 65 DOM
-
2026-06-13days on market $167,500 Active 64 DOM
-
2026-06-10days on market $167,500 Active 62 DOM
-
2026-06-09days on market $167,500 Active 61 DOM
-
2026-06-08days on market $167,500 Active 60 DOM
-
2026-06-07days on market $167,500 Active 59 DOM
-
2026-06-05days on market $167,500 Active 56 DOM
-
2026-06-03days on market $167,500 Active 55 DOM
-
2026-06-02days on market $167,500 Active 54 DOM
-
2026-06-01days on market $167,500 Active 53 DOM
-
2026-05-31statusdays on market $167,500 Active 52 DOM
-
2026-05-30days on market $167,500 Price Change 51 DOM
-
2026-04-09$174,900 Active 478-char remark
Show marketing remark (389 chars)
Large home on almost an acre with 5-6 bedrooms and 2.5 baths in Valley View School District. One living area upstairs and one down with a wood burning fireplace. Updated kitchen and hardwood flooring in the upstairs bedrooms are a plus. Hvac is 4-5 years old and the roof is about 10 years old. This one needs some cosmetic updates especially downstairs and is priced to sell. * AI staging
-
2026-04-09$174,900 New Listing 389-char remark
Show marketing remark (389 chars)
Large home on almost an acre with 5-6 bedrooms and 2.5 baths in Valley View School District. One living area upstairs and one down with a wood burning fireplace. Updated kitchen and hardwood flooring in the upstairs bedrooms are a plus. Hvac is 4-5 years old and the roof is about 10 years old. This one needs some cosmetic updates especially downstairs and is priced to sell. * AI staging
-
2025-10-01status Active
-
2025-10-01price $184,900
-
2025-06-20$199,900 Active
-
2005-10-05soldstatus $91,000
ⓘ Source: listings_history table (triggers on properties + properties_extension) + one-shot
backfill from property_details.listing_events for pre-trigger history.
Tax reassessment forecast AR · Resets to sale price
- Current annual tax
- $1,615 · $135/mo
- Projected year-2 tax
- $1,615 · $135/mo
- Expected delta
- $0/yr ($0/mo · 0.0%)
ⓘ Screening estimate from a state-policy table — verify with the county assessor before closing.
Climate risk First Street
- Flood 1/10 Low FEMA zone X · 0% chance over 30 yrs
- Wildfire 3/10 Moderate
- Heat 5/10 Major 7 d/yr ≥108°F today · 20 d/yr by 30 yrs out
- Wind 4/10 Moderate 8% chance of damaging wind over 30 yrs
- Air quality 1/10 Low 0 unhealthy d/yr today · 0 by 30 yrs out
Nearby sold comps map
Loading sold comps map…
Walkable amenities ~0.75 mi
Loading nearby amenities…
Taxation est. · year 1
- Rental income
- $22,467
- − Mortgage interest
- −$9,383
- − Property taxes
- −$1,615
- − Insurance
- −$838
- − Repairs & maintenance
- −$1,797
- − Management
- −$1,797
- − Depreciation
- −$4,873
- Taxable income
- $2,164
- Est. tax owed @ 24.0%
- −$519
- After-tax cash flow
- $4,236/yr
For passive investors: Depreciation is non-cash, so a rental often shows a tax loss while cash-flowing — sheltering income. Rental losses are passive: they offset passive income freely, and up to $25,000/yr can offset ordinary (W-2) income if you actively participate and your MAGI is under $100k (phasing out to $0 by $150k); unused losses carry forward. On sale, claimed depreciation is recaptured at up to 25%, and gains may owe capital-gains tax (a 1031 exchange can defer both). Figures are a year-1 estimate at your 24.0% rate — not tax advice; consult a CPA.
Schools (NCES district)
- District
- Valley View School District
- NCES district ID
- 0513380
- Math proficiency
- 55% ▼ -11.00%
- Reading proficiency
- 60% ▼ -10.00%
- Median HH income
- $79,148
- Composite
- 51.78/100
- National rank
- #1672
- State rank
- #4 of 238 in AR
Livability — Jonesboro
- Score
- 65/100
- State rank
- #145
- US rank
- #12692
Category grades
Schools grade is shown separately in the Schools card above.
Census & demographics
- Census place
- Jonesboro, AR
- County
- Craighead County · 97,185 people
- City population
- 91,245
- Metro
- Jonesboro, AR
- Population (ZIP)
- 29,968
- Household income
- $70,269
- Rent vs Own
- Severe rent burden
- 869.0
Population outlook (Craighead County) Hauer SSP2
- Today (2025)
- 122,235 people
- By 2030
- 131,338 · +7.4%
- By 2040
- 149,862 · +22.6%
- By 2050
- 168,034 · +37.5%
- By 2075
- 208,094 · +70.2%
- By 2100
- 233,251 · +90.8%
Race, ethnicity, and origin ACS 2023
- Neighborhood character
- Predominantly White (72%)
- Race & ethnicity
- White 72% Black 18% Two or more races 5% Hispanic / Latino 4% Asian 2%
- Common ancestry
- Slovak 3% Lithuanian 1% Italian 1%
- Foreign-born
- 5% · Canada, China, South Korea
- Languages at home
- 95% English-only · Spanish 3% Chinese 1%
Political lean MEDSL · Craighead
- 2024 margin
- Solid R (+37.4) · D 30.1% · R 67.5% · Other 2.4%
- 2008→2024 swing
- -12.9pp toward R · 2008: -24.5pp · 2024: -37.4pp
- All cycles
- 2024: R+37.4 2020: R+35.4 2016: R+35.2 2012: R+31.1 2008: R+24.5
Not yet ingested
- Civics
- —
Market trends
- HPI YoY
- ▼ -35.22%
- Current HPI
- 208.3772
- Rent YoY
- ▲ 0.74%
- Metro
- Jonesboro, AR
- State GDP YoY
- ▲ 3.80%
- F500 in state
- 10
Industry mix (Fortune 500 HQ in AR)
| Industry | F500 HQs | Revenue |
|---|---|---|
| Retail | 1 | $681B |
|
||
| Food / Agriculture | 1 | $53B |
|
||
| Retail / Energy | 1 | $22B |
|
||
| Transportation / Logistics | 1 | $12B |
|
||
| Energy | 1 | $4B |
|
||
Price history
+92.2% since first listed6 events — show timeline
- 2026-04-09 Listed $174,900 NEABOR MLS
- 2026-04-09 Listed $174,900 CARMLS
- 2025-10-01 Relisted — NEABOR MLS
- 2025-10-01 Price Changed $184,900 NEABOR MLS
- 2025-06-20 Listed $199,900 NEABOR MLS
- 2005-10-05 Sold (Public Records) $91,000 Public Records
Property tax history
+5.1%/yrLatest (2025): $1,615 · +0.0% YoY. Source: county tax records.
Cash-flow waterfall
monthlySold comps — $/sqft
last 12 mo · ≤1 miLoading sold comps…