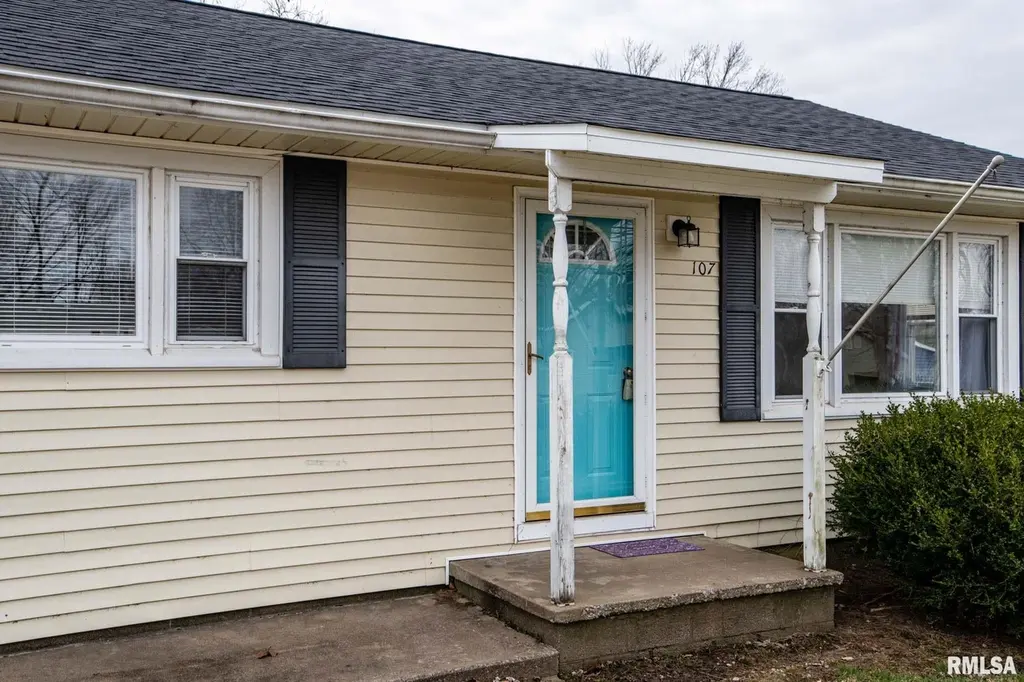
107 E Vermont St · Cambria, IL
Flood risk 1/10 · Minimal
- FEMA flood zone
- X (unshaded)
- Chance of flooding over 30 yrs
- 0.0%
- Est. flood insurance / yr
- $507 – $1,088
Fire risk 3/10 · Minor
- Est. fire insurance / yr
- $804 – $1,492
Heat risk 5/10 · Moderate
- Hot days now (above 107°F)
- 7 days/yr
- Hot days in 30 yrs
- 20 days/yr
Wind risk 2/10 · Minimal
- Chance of severe wind over 30 yrs
- 2.0%
Air-quality risk 2/10 · Minimal
- Unhealthy air days now
- 0 days/yr
- Unhealthy air days in 30 yrs
- 1 days/yr
Risk factors via First Street. Map © Google.
Why this score? — see what drove the D grade
The composite is a weighted blend of 9 inputs, each scored 0–100. Each bar is that input's sub-score; the figure is the points it added to the 100-point composite (weight × sub-score).
- Cash flow +19.3/30.0
- DSCR +6.1/10.0
- 1% rule +4.7/10.0
- Schools +3.1/10.0
- Livability +3.1/5.0
- Rent growth +2.5/5.0
- Condition / age +2.5/5.0
- ARV discount +0.0/15.0
- Appreciation +0.0/10.0
$129,900
🖨 Deal sheet 📄 Offer letter ✓ Due diligence
Listing remarks MLS
Adorable 3 bedroom 1 bath Ranch style home in Cambria. Carterville school district. New roof 2026, brand new carpet 2026, LVP kitchen & bath, 100 Amp. service, Interior paint 2024, kitchen cabinets painted 2024. Appliances stay in home (refrigerator & gas stove) new in 2021. HVAC is gas (2014) Hot water heater (2022). A large laundry room with a utility sink & direct access to the back porch. There is a 8 x 12 storage shed in the yard that stays. Large covered concrete back patio great for cookouts. Previously was an investment property with income of $1225.00 per month.
Key facts
- Lvp kitchen
- Lvp bath
- Interior paint
Tags
Neighborhood map
What this means for you Summary
Snapshot
- This is a 3-bed/1.0-bath other listed at $130k.
Deal economics
- At list price, monthly cash flow is $142 ($2k/yr) — positive.
- The deal already cash-flows at list — no discount required.
- To meet the 1% rule (rent ≥ 1% of price), the offer needs to be $127k (2.5% below list).
- Recommended offer: $118k (9.0% below list) — sets the bar for market timing.
- Cap rate 7.6% vs local median 2.6% in Cambria — top-decile yield for the area; either an underpriced asset or a hidden risk that comps aren't pricing in. Stress-test before assuming the spread holds.
Location & tenants
- Location reads 61/100 on livability (#931 in IL) — a middle-class / working-renter tenant base. Strengths: crime A+, cost of living A+, housing A+; Watch: schools F, amenities F, commute F.
- Carterville CUSD 5 (suburban): math 29% / reading 43% proficiency, ranked #185 of 620 in IL (top 30%) — families likely to look elsewhere, expect single-tenant / working-renter base with shorter leases.
- Market conditions: 110 active listings in the ZIP; 130 units permitted in Williamson County in 2024 (5 in 5+ unit buildings).
Forward outlook
- Local home prices are declining (-3.0%/yr); year-one equity from $898 of loan paydown is wiped out by about $4k of value loss. Plan a longer hold.
Negotiation context
- It's been on market 117 days — a 9% lower offer ($118k) is reasonable based on typical stale-listing flexibility.
- 4 sale attempts since 7y ago; this cycle's ask has dropped $10k (7%) from the opening price — seller is motivated, your offer sets the floor, not the list.
- Current owner paid $40k; list at $130k implies a 226% gain — meaningful room to come down on a strong offer.
Risks & watch-outs
- Watch-outs: built in 1950 — expect roof / HVAC / electrical / plumbing capex.
- Climate carrying-cost: extreme-heat days projected 7→20/yr by 2055 (HVAC capex compounding) — expect insurance premiums to compound above CPI over the hold.
Questions for the listing agent
- It's been on market 117 days. Have you received any prior offers? Is the seller open to a 9% concession, seller financing, or rate buy-down credit?
- Built in 1950 — when were the roof, HVAC, electrical panel, plumbing, and water heater last replaced?
- Why hasn't it sold? Are there any deal-killer items the seller is aware of (foundation, flood, title, zoning, code violations)?
- Is there a deadline driving the sale (1031 exchange, divorce, estate, relocation)? That informs how much negotiation room exists.
- Schools are F-rated, which usually means shorter tenancies and higher turnover. Who's the typical renter profile here, and what's been the actual vacancy rate?
- The area grade is low — what's the realistic commute time and amenity access for the typical tenant pool here? Any planned neighborhood developments (good or bad) we should know about?
- What's the average days-on-market for RENTAL listings here right now (not sales)? A rising rental-DOM trend means longer vacancies and softer asking-rent achievability than the comps imply.
- What's the recent tenant-quality profile in this submarket — average credit score on applications, eviction rate, late-payment / NSF rate, and stable-employment percentage? A property-management company in the area should have these aggregated.
- How much new for-sale + rental construction is in the pipeline within 1–3 miles? Heavy new supply typically softens prices + rents 12–24 months out; constrained supply supports both.
Investment metrics
- 1% rule
- 0.97% ✗
- Cap rate
- 7.60%
- Cash-on-cash
- 4.67%
- DSCR
- 1.21
- GRM
- 8.5
CMA / ARV
- ARV (median comp)
- $91,120
- List price
- $129,900
- Delta
- 42.56%
- Verdict
- OVERPRICED
- Comps
- 20 within 1.0 mi
Projected returns pro-forma
-3.0% appreciation · 3.0% rent growth · sell at horizon
- IRR
- -9.0%
- Equity multiple
- 0.67×
- Total profit
- $-12,040
- Equity at exit
- $19,369
- IRR
- 0.4%
- Equity multiple
- 1.03×
- Total profit
- $1,103
- Equity at exit
- $11,231
Cash invested: $36,372 (down + closing). Projections, not guarantees.
Landlord ↔ Tenant lean methodology
- Overall (STATE)
- 43 Moderately Tenant-Leaning
- State Illinois
- 43 Moderately Tenant-Leaning · D+7
- County
- — inherits STATE
- City
- — inherits STATE
ZIP-level market 62918
- Home prices YoY
- -13.8%
- Active inventory
- 110
- Price-to-rent
- 8.5×
Monthly cashflow live
- Estimated rent
- $1,266 medium interval (Pro) →
- Mortgage (P&I)
- −$681
- Tax from tax record
- −$123 /mo · $1,482/yr
- Insurance
- −$54
- HOA
- −$0
- Vacancy / Maint / Mgmt
- −$266
- Net cashflow
- $142
Break-even live
UW: 25.0% down · 7.5% · 30yr · 1.5% tax · 5.0% vac · 8.0% maint · 8.0% mgmt
Financing live
Cash to close
- Down payment
- $32,475
- Closing costs
- $3,897
- Reserves months
- —
- Total cash needed
- —
Loan-product check · same deal, 3 products live
Conventional
25% down · 7.5% · 30yr
- Down + closing
- —
- Monthly P&I
- —
- Monthly cashflow
- —
- DSCR
- —
- Eligible?
- —
Personal DTI + credit; lowest rate.
DSCR
20% down · 8.5% · 30yr
- Down + closing
- —
- Monthly P&I
- —
- Monthly cashflow
- —
- DSCR
- —
- Eligible?
- —
No personal income docs; deal must DSCR.
Hard money
10% down · 12.0% · 12mo
- Down + closing
- —
- Monthly P&I
- —
- Monthly cashflow
- —
- DSCR
- —
- Eligible?
- —
Short-term bridge; refi at stabilization.
Listing history 26 events
-
2026-06-19days on market $129,900 Active 117 DOM
-
2026-06-18days on market $129,900 Active 116 DOM
-
2026-06-17days on market $129,900 Active 115 DOM
-
2026-06-16days on market $129,900 Active 114 DOM
-
2026-06-15days on market $129,900 Active 113 DOM
-
2026-06-14days on market $129,900 Active 111 DOM
-
2026-06-13statusdays on market $129,900 Active 110 DOM
-
2026-06-10days on market $129,900 Under Contract 108 DOM
-
2026-06-09days on market $129,900 Under Contract 107 DOM
-
2026-06-08days on market $129,900 Under Contract 106 DOM
-
2026-06-07days on market $129,900 Under Contract 105 DOM
-
2026-06-05statusdays on market $129,900 Under Contract 102 DOM
-
2026-06-02days on market $129,900 Active 100 DOM
-
2026-06-01days on market $129,900 Active 99 DOM
-
2026-05-31days on market $129,900 Active 98 DOM
-
2026-05-30days on market $129,900 Active 97 DOM
-
2026-04-03price $129,900 592-char remark
Show marketing remark (592 chars)
Adorable 3 bedroom 1 bath Ranch style home in Cambria. Carterville school district. New roof 2026, brand new carpet 2026, LVP kitchen & bath, 100 Amp. service, Interior paint 2024, kitchen cabinets painted 2024. Appliances stay in home (refrigerator & gas stove) new in 2021. HVAC is gas (2014) Hot water heater (2022). A large laundry room with a utility sink & direct access to the back porch. There is a 8 x 12 storage shed in the yard that stays. Large covered concrete back patio great for cookouts. Previously was an investment property with income of $1225.00 per month.
-
2026-02-18$139,900 Active 592-char remark
Show marketing remark (592 chars)
Adorable 3 bedroom 1 bath Ranch style home in Cambria. Carterville school district. New roof 2026, brand new carpet 2026, LVP kitchen & bath, 100 Amp. service, Interior paint 2024, kitchen cabinets painted 2024. Appliances stay in home (refrigerator & gas stove) new in 2021. HVAC is gas (2014) Hot water heater (2022). A large laundry room with a utility sink & direct access to the back porch. There is a 8 x 12 storage shed in the yard that stays. Large covered concrete back patio great for cookouts. Previously was an investment property with income of $1225.00 per month.
-
2025-12-17historical
-
2025-09-19historical
-
2025-05-20Active
-
2019-09-18soldstatus $39,900
-
2019-09-18soldstatus $39,900
-
2019-03-02$49,900
-
2019-03-02$49,900
-
1999-02-08soldstatus $20,000
ⓘ Source: listings_history table (triggers on properties + properties_extension) + one-shot
backfill from property_details.listing_events for pre-trigger history.
Tax reassessment forecast IL · Partial reset (capped growth)
- Current annual tax
- $1,482 · $123/mo
- Projected year-2 tax
- $2,215 · $185/mo
- Expected delta
- +$734/yr (+$61/mo · 49.5%)
ⓘ Screening estimate from a state-policy table — verify with the county assessor before closing.
Climate risk First Street
- Flood 1/10 Low FEMA zone X (unshaded) · 0% chance over 30 yrs
- Wildfire 3/10 Moderate
- Heat 5/10 Major 7 d/yr ≥107°F today · 20 d/yr by 30 yrs out
- Wind 2/10 Low 2% chance of damaging wind over 30 yrs
- Air quality 2/10 Low 0 unhealthy d/yr today · 1 by 30 yrs out
Nearby sold comps map
Loading sold comps map…
Walkable amenities ~0.75 mi
Loading nearby amenities…
Taxation est. · year 1
- Rental income
- $15,195
- − Mortgage interest
- −$7,276
- − Property taxes
- −$1,482
- − Insurance
- −$650
- − Repairs & maintenance
- −$1,216
- − Management
- −$1,216
- − Depreciation
- −$3,779
- Taxable loss
- −$423
- Est. tax savings @ 24.0%
- +$101
- After-tax cash flow
- $1,800/yr
For passive investors: Depreciation is non-cash, so a rental often shows a tax loss while cash-flowing — sheltering income. Rental losses are passive: they offset passive income freely, and up to $25,000/yr can offset ordinary (W-2) income if you actively participate and your MAGI is under $100k (phasing out to $0 by $150k); unused losses carry forward. On sale, claimed depreciation is recaptured at up to 25%, and gains may owe capital-gains tax (a 1031 exchange can defer both). Figures are a year-1 estimate at your 24.0% rate — not tax advice; consult a CPA.
Schools (NCES district)
- District
- Carterville CUSD 5
- NCES district ID
- 1708640
- Math proficiency
- 29% ▼ -16.00%
- Reading proficiency
- 43% ▼ -18.00%
- Median HH income
- $47,344
- Composite
- 30.87/100
- National rank
- #6122
- State rank
- #185 of 620 in IL
Livability — Cambria
- Score
- 61/100
- State rank
- #931
- US rank
- #18092
Category grades
Schools grade is shown separately in the Schools card above.
Census & demographics
- Census place
- Cambria, IL
- County
- Williamson County · 38,451 people
- City population
- 473
- Metro
- Carbondale-Marion, IL
- Population (ZIP)
- 10,658
- Household income
- $70,920
- Rent vs Own
- Severe rent burden
- 240.0
Population outlook (Williamson County) Hauer SSP2
- Today (2025)
- 69,553 people
- By 2030
- 70,090 · +0.8%
- By 2040
- 70,345 · +1.1%
- By 2050
- 69,394 · -0.2%
- By 2075
- 63,590 · -8.6%
- By 2100
- 51,154 · -26.5%
Race, ethnicity, and origin ACS 2023
- Neighborhood character
- Predominantly White (89%)
- Race & ethnicity
- White 89% Two or more races 4% Hispanic / Latino 3% Asian 3% Black 2%
- Common ancestry
- Slovak 4% Italian 2% Lithuanian 2%
- Foreign-born
- 2% · Canada, Vietnam
- Languages at home
- 96% English-only · Spanish 2% Other Indo-European 1% Vietnamese 1%
Political lean MEDSL · Williamson
- 2024 margin
- Solid R (+38.8) · D 30.0% · R 68.8% · Other 1.3%
- 2008→2024 swing
- -24.0pp toward R · 2008: -14.8pp · 2024: -38.8pp
- All cycles
- 2024: R+38.8 2020: R+37.3 2016: R+41.2 2012: R+25.0 2008: R+14.8
Not yet ingested
- Civics
- —
Market trends
- HPI YoY
- ▼ -25.58%
- Current HPI
- 159.1431
- Rent YoY
- —
- Metro
- Carbondale-Marion, IL
- State GDP YoY
- ▲ 1.59%
- F500 in state
- 60
Industry mix (Fortune 500 HQ in IL)
| Industry | F500 HQs | Revenue |
|---|---|---|
| Insurance | 4 | $201B |
|
||
| Consumer Goods | 4 | $87B |
|
||
| Industrial Machinery | 3 | $64B |
|
||
| Healthcare | 2 | $55B |
|
||
| Retail / Pharmacy | 1 | $148B |
|
||
| Agriculture / Food | 1 | $86B |
|
||
Price history
+549.5% since first listed10 events — show timeline
- 2026-04-03 Price Changed $129,900 RMLSA as Distributed by MLS Grid
- 2026-02-18 Listed $139,900 RMLSA as Distributed by MLS Grid
- 2025-12-17 Listing Removed — MRED as Distributed by MLS Grid
- 2025-09-19 Listing Removed — RMLSA as Distributed by MLS Grid
- 2025-05-20 Listed — RMLSA as Distributed by MLS Grid
- 2019-09-18 Sold (MLS) $39,900 MRED as Distributed by MLS Grid
- 2019-09-18 Sold (MLS) $39,900 RMLSA as Distributed by MLS Grid
- 2019-03-02 Listed $49,900 MRED as Distributed by MLS Grid
- 2019-03-02 Listed $49,900 RMLSA as Distributed by MLS Grid
- 1999-02-08 Sold (Public Records) $20,000 Public Records
Property tax history
+8.3%/yrLatest (2025): $1,482 · +6.2% YoY. Source: county tax records.
Cash-flow waterfall
monthlySold comps — $/sqft
last 12 mo · ≤1 miLoading sold comps…