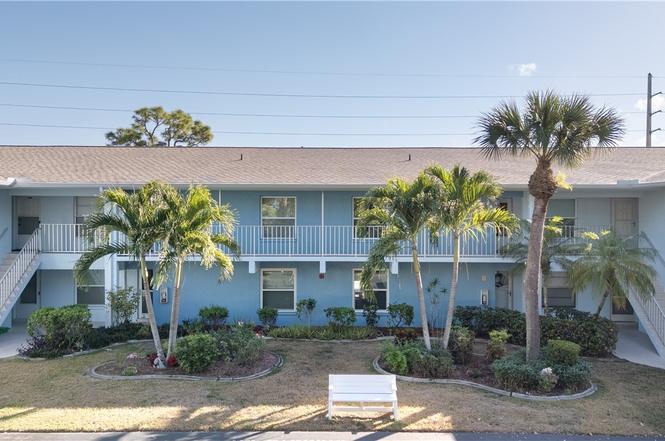
1100 Pondella Rd #916 · Cape Coral, FL
Flood risk 4/10 · Minor
- FEMA flood zone
- X (unshaded)
- Chance of flooding over 30 yrs
- 0.13%
- Est. flood insurance / yr
- $507 – $1,088
Fire risk 1/10 · Minimal
- Est. fire insurance / yr
- $947 – $1,759
Heat risk 10/10 · Severe
- Hot days now (above 106°F)
- 7 days/yr
- Hot days in 30 yrs
- 26 days/yr
Wind risk 10/10 · Severe
- Chance of severe wind over 30 yrs
- 99.0%
Air-quality risk 2/10 · Minimal
- Unhealthy air days now
- 1 days/yr
- Unhealthy air days in 30 yrs
- 1 days/yr
Risk factors via First Street. Map © Google.
Why this score? — see what drove the D grade
The composite is a weighted blend of 9 inputs, each scored 0–100. Each bar is that input's sub-score; the figure is the points it added to the 100-point composite (weight × sub-score).
- Cash flow +11.6/30.0
- 1% rule +7.8/10.0
- ARV discount +7.5/15.0
- Schools +4.1/10.0
- Livability +3.9/5.0
- DSCR +3.4/10.0
- Condition / age +2.5/5.0
- Rent growth +1.1/5.0
- Appreciation +0.0/10.0
$125,000
🖨 Deal sheet (PDF) 📄 Offer letter ✓ Due diligence
Listing remarks MLS
This is a Short Sale subject to existing lender's approval which could result in delays. THIS IS A SHORT SALE SUBJECT TO EXISTING LENDERS APPROVAL, WHICH COULD CAUSE DELAYS. Nice 2/2 condo, community heated pool, tiki huts and bbq area. 2nd floor unit
Key facts
- Pet friendly
- $399 HOA
- Parking
Tags
Property features AI
Finance
- Financial info: Pets may be allowed with conditions (call for details); maximum 2 pets, max weight 20 lbs; aggressive breeds not allowed
- HOA & community: Homeowners association with management; HOA fee approximately $399 monthly; HOA covers management, insurance, legal/accounting, grounds maintenance, pest control, recreation facilities, reserve fund, and road maintenance; Community features include pool, street lights, non-gated community; 126 units in the community
Exterior
- Parking: Assigned covered parking; Detached carport (1 space); Guest parking available
- Security: Smoke detectors
- Utilities: Public water; Public sewer; Cable available
- Home design: 2-story property; Entry level: 2; Resale condition; Faces north
- Construction: Block, concrete and stucco construction; Shingle roof
- Exterior features: Lanai; Porch (screened); Sprinkler/irrigation; Automatic sprinklers; Community pool; Paved road access; South exposures
Interior
- Kitchen: Dishwasher; Microwave; Range; Refrigerator
- Bedrooms: Guest quarters
- Flooring: Carpet; Tile
- Bathrooms: 2 full bathrooms
- Heating & cooling: Central heating (electric); Central air conditioning (electric); Ceiling fan(s)
- Interior features: Furnished; Breakfast bar; Living/dining room combination; Split bedroom layout; Separate shower, shower only configuration; Single hung windows
- Laundry & utility: Washer and dryer (inside laundry)
Neighborhood map
What this means for you Summary
Snapshot
- This is a 2-bed/2.0-bath condo listed at $125k.
Deal economics
- At list price, monthly cash flow is $-40 ($-478/yr) — negative.
- To cash-flow at today's rent, offer at most $118k (5.6% below list).
- Meets the 1% rule at list price ($2k rent vs $125k).
- Recommended offer: $110k (12.0% below list) — sets the bar for market timing.
- Cap rate 5.9% vs local median 3.1% in Cape Coral — top-decile yield for the area; either an underpriced asset or a hidden risk that comps aren't pricing in. Stress-test before assuming the spread holds.
Location & tenants
- Location reads 77/100 on livability (#208 in FL, #3,098 nationally) — a middle-class / working-renter tenant base. Strengths: housing A+, health & safety A+, amenities B+; Watch: commute F.
- Lee (suburban): math 47% / reading 50% proficiency, ranked #42 of 73 in FL (top 58%) — families likely to look elsewhere, expect single-tenant / working-renter base with shorter leases.
- Zoned schools: Gulf Elementary School (math 70% / reading 65%, grade B+, #435 of 2,144 statewide, top 21%, 1,231 students, 38% FRL); Challenger Middle School (math 59% / reading 56%, grade B, #157 of 571 statewide, top 28%, 1,124 students, 50% FRL); Ida S. Baker High School (math 44% / reading 47%, grade D-, #223 of 667 statewide, top 34%, 1,933 students, 39% FRL) — zoned schools average 42% FRL vs 57% district-wide (15 pts lower); this property's tenant base skews higher-income than the district average.
- Market conditions: Rents falling (-5.6%/yr); 1611 active listings in the ZIP; 24 comparable units currently listed for rent nearby; rentals at typical pace (median 24d on market — plan ~3-4 weeks tenant-placement turnaround); 15,411 units permitted in Lee County in 2024 (4,686 in 5+ unit buildings).
Forward outlook
- Local home prices are declining (-3.0%/yr); year-one equity from $864 of loan paydown is wiped out by about $4k of value loss. Plan a longer hold.
- Lee County population projected at +44% by 2050 — long-run rental-demand tailwind backs the buy-and-hold thesis.
Negotiation context
- It's been on market 154 days — a 12% lower offer ($110k) is reasonable based on typical stale-listing flexibility.
- 2 sale attempts; this cycle's ask has dropped $10k (7%) from the opening price — seller is motivated, your offer sets the floor, not the list.
- Current owner paid $30k; list at $125k implies a 317% gain — meaningful room to come down on a strong offer.
Risks & watch-outs
- Watch-outs: HOA is 25% of rent.
- Climate carrying-cost: severe wind risk, 99% chance of damaging wind over 30y; extreme-heat days projected 7→26/yr by 2055 (HVAC capex compounding) — expect insurance premiums to compound above CPI over the hold.
Questions for the listing agent
- What do current leases actually rent for vs. the listed asking? Can we see a recent rent roll and the last 12 months of T-12 income?
- It's been on market 154 days. Have you received any prior offers? Is the seller open to a 12% concession, seller financing, or rate buy-down credit?
- What does the HOA fee cover, when was the last increase, and are there any pending special assessments or reserve-fund shortfalls?
- Any open or pending special assessments — roof, HVAC, plumbing, elevator, façade? What's the per-unit balance and payoff schedule, and is the seller paying it off at close or rolling it to the buyer?
- Why hasn't it sold? Are there any deal-killer items the seller is aware of (foundation, flood, title, zoning, code violations)?
- Is there a deadline driving the sale (1031 exchange, divorce, estate, relocation)? That informs how much negotiation room exists.
- Schools are B-rated — typically a magnet for longer-tenancy family renters. What's the average tenant stay here, and is there a school-zone premium baked into asking?
- The area grade is low — what's the realistic commute time and amenity access for the typical tenant pool here? Any planned neighborhood developments (good or bad) we should know about?
- What's the average days-on-market for RENTAL listings here right now (not sales)? A rising rental-DOM trend means longer vacancies and softer asking-rent achievability than the comps imply.
- What's the recent tenant-quality profile in this submarket — average credit score on applications, eviction rate, late-payment / NSF rate, and stable-employment percentage? A property-management company in the area should have these aggregated.
- How much new apartment / multifamily construction is in the pipeline within 1–3 miles? Heavy new supply (>2% of stock underway) typically softens rents 12–24 months out; light construction supports rent growth.
Investment metrics
- 1% rule
- 1.28% ✓
- Cap rate
- 5.91%
- Cash-on-cash
- -1.37%
- DSCR
- 0.94
- GRM
- 6.5
CMA / ARV
No comps found within radius.
Projected returns pro-forma
-3.0% appreciation · 0.0% rent growth · sell at horizon
- IRR
- -23.6%
- Equity multiple
- 0.22×
- Total profit
- $-27,182
- Equity at exit
- $18,638
- IRR
- -40.8%
- Equity multiple
- -0.25×
- Total profit
- $-43,835
- Equity at exit
- $10,808
Cash invested: $35,000 (down + closing). Projections, not guarantees.
Landlord ↔ Tenant lean methodology
- Overall (STATE)
- 87 Strongly Landlord-Friendly
- State Florida
- 87 Strongly Landlord-Friendly · R+3
- County
- — inherits STATE
- City
- — inherits STATE
ZIP-level market 33909
- Home prices YoY
- -23.1%
- Rents YoY
- -5.6%
- Active inventory
- 1611
- Price-to-rent
- 6.5×
Monthly cashflow live
- Estimated rent
- $1,597 high interval (Pro) →
- Mortgage (P&I)
- −$656
- Tax from tax record
- −$195 /mo · $2,339/yr
- Insurance
- −$52
- HOA
- −$399
- Lot rent
- −$0
- Vacancy / Maint / Mgmt
- −$335
- Net cashflow
- $-40
Break-even live
Sensitivity live
| Price | -10% $31 | -5% $-4 | +0% $-40 | +5% $-75 | +10% $-111 |
|---|---|---|---|---|---|
| Rent | -10% $-166 | -5% $-103 | +0% $-40 | +5% $23 | +10% $86 |
| Rate | -1.0pp $23 | -0.5pp $-8 | base $-40 | +0.5pp $-72 | +1.0pp $-105 |
UW: 25.0% down · 7.5% · 30yr · 1.5% tax · 5.0% vac · 8.0% maint · 8.0% mgmt
Financing live
Cash to close
- Down payment
- $31,250
- Closing costs
- $3,750
- Reserves months
- —
- Total cash needed
- —
Loan-product check · same deal, 3 products live
Conventional
25% down · 7.5% · 30yr
- Down + closing
- —
- Monthly P&I
- —
- Monthly cashflow
- —
- DSCR
- —
- Eligible?
- —
Personal DTI + credit; lowest rate.
DSCR
20% down · 8.5% · 30yr
- Down + closing
- —
- Monthly P&I
- —
- Monthly cashflow
- —
- DSCR
- —
- Eligible?
- —
No personal income docs; deal must DSCR.
Hard money
10% down · 12.0% · 12mo
- Down + closing
- —
- Monthly P&I
- —
- Monthly cashflow
- —
- DSCR
- —
- Eligible?
- —
Short-term bridge; refi at stabilization.
Rent comps 24 comps
| Address | Beds | Baths | Sqft | Rent | $/sqft | DOM | Units | Dist |
|---|---|---|---|---|---|---|---|---|
| 1100 Pondella Rd Cape Coral, FL | 2.0 | 2.0 | 938 | $1,600 | $1.71 | 5d | 1 | 0.01mi |
| 2303 NE 6th St #3 Cape Coral, FL | 2.0 | 1.0 | 861 | $1,400 | $1.63 | 26d | 1 | 0.33mi |
| 2308 NE 6th St Unit 1 Cape Coral, FL | 2.0 | 1.5 | 1009 | $1,450 | $1.44 | 21d | 1 | 0.35mi |
| 2308 NE 6th St Cape Coral, FL | 2.0 | 1.0 | 1009 | $1,450 | $1.44 | 18d | 1 | 0.35mi |
| 521 NE 24th Pl Apt 2 Cape Coral, FL | 2.0 | 2.0 | 1090 | $1,400 | $1.28 | 26d | 1 | 0.38mi |
| 509 NE 24th Pl Unit A Cape Coral, FL | 2.0 | 2.0 | 1113 | $1,445 | $1.30 | 21d | 1 | 0.43mi |
| 509 NE 24th Pl Unit A Cape Coral, FL | 2.0 | 2.0 | 1113 | $1,395 | $1.25 | 5d | 1 | 0.43mi |
| 501 NE 24th Pl Unit 501 Cape Coral, FL | 2.0 | 1.0 | 891 | $1,400 | $1.57 | 26d | 1 | 0.46mi |
| 2500 Ne Pine Island Rd North Fort Myers, FL | 1.0–3.0 | 1.0–2.0 | 962 | $2,018 | $2.10 | 5d | 19 | 0.55mi |
| 325 NE 23rd Ave Cape Coral, FL | 3.0 | 2.0 | 1104 | $1,496 | $1.36 | 5d | 1 | 0.55mi |
| 2505 Liberty Park Dr Cape Coral, FL | 1.0–2.0 | 1.0–2.0 | 1092 | $2,203 | $2.02 | 5d | 14 | 0.67mi |
| 1717 NE 6th Ter Cape Coral, FL | 2.0 | 2.0 | 1111 | $1,700 | $1.53 | 26d | 1 | 0.95mi |
| 750 Pondella Rd North Fort Myers, FL | 2.0–3.0 | 1.0–2.0 | 1200 | $1,099 | $0.92 | 4d | 6 | 0.97mi |
| 4495 Frankie Ct North Fort Myers, FL | 2.0 | 1.5 | 1000 | $1,295 | $1.29 | 26d | 1 | 1.12mi |
| 4789 Orange Grove Blvd #12 North Fort Myers, FL | 2.0 | 1.0 | 741 | $1,300 | $1.75 | 5d | 1 | 1.23mi |
| 4789 Orange Grove Blvd North Fort Myers, FL | 2.0 | 1.0 | 741 | $1,300 | $1.75 | 23d | 1 | 1.23mi |
| 4777 Orange Grove Blvd North Fort Myers, FL | 2.0 | 1.0 | 741 | $1,200 | $1.62 | 26d | 1 | 1.24mi |
| 4773 Orange Grove Blvd #7 North Fort Myers, FL | 2.0 | 1.0 | 741 | $1,500 | $2.02 | 26d | 1 | 1.26mi |
| 4749 # F3 # N Unit Orange Grove Blvd unit North Fort Myers, FL | 2.0 | 1.0 | 741 | $1,095 | $1.48 | 26d | 1 | 1.29mi |
| 129 SE 23rd Pl Unit -Unit 2 Cape Coral, FL | 2.0 | 1.0 | 976 | $1,400 | $1.43 | 26d | 1 | 1.30mi |
| 1288 Waite Dr North Fort Myers, FL | 2.0 | 2.0 | 972 | $2,200 | $2.26 | 26d | 1 | 1.36mi |
| 1260 Joerin Ave North Fort Myers, FL | 1.0 | 1.0 | 936 | $1,105 | $1.18 | 26d | 1 | 1.39mi |
| 3050 Steeple Cir Cape Coral, FL | 1.0–3.0 | 1.0–2.0 | 1003 | $1,668 | $1.66 | 5d | 27 | 1.40mi |
| 2700 Diplomat Pkwy E Cape Coral, FL | 1.0–3.0 | 1.0–2.0 | 1116 | $2,382 | $2.13 | 5d | 41 | 1.47mi |
HOA detail condo
- Monthly dues
- $399 · $4,788/yr
- Likely covers
- pool
- Assessments
- None detected in remarks — confirm with the listing agent.
Listing history 20 events
-
2026-06-22days on market $125,000 Active 154 DOM
-
2026-06-22days on market $125,000 Active 153 DOM
-
2026-06-17days on market $125,000 Active 149 DOM
-
2026-06-16days on market $125,000 Active 148 DOM
-
2026-06-15days on market $125,000 Active 147 DOM
-
2026-06-13days on market $125,000 Active 145 DOM
-
2026-06-10days on market $125,000 Active 142 DOM
-
2026-06-09days on market $125,000 Active 141 DOM
-
2026-06-07days on market $125,000 Active 139 DOM
-
2026-06-02days on market $125,000 Active 134 DOM
-
2026-06-01days on market $125,000 Active 133 DOM
-
2026-06-01days on market $125,000 Active 132 DOM
-
2026-03-08price $125,000
-
2026-01-19$135,000 Active
-
2025-12-18historical
-
2025-09-07price $145,000
-
2025-03-23$150,000 Active
-
2015-03-02price $29,900 252-char remark
Show marketing remark (252 chars)
This is a Short Sale subject to existing lender's approval which could result in delays. THIS IS A SHORT SALE SUBJECT TO EXISTING LENDERS APPROVAL, WHICH COULD CAUSE DELAYS. Nice 2/2 condo, community heated pool, tiki huts and bbq area. 2nd floor unit
-
2010-03-11soldstatus $30,000
-
2010-03-09soldstatus $30,000 252-char remark
Show marketing remark (252 chars)
This is a Short Sale subject to existing lender's approval which could result in delays. THIS IS A SHORT SALE SUBJECT TO EXISTING LENDERS APPROVAL, WHICH COULD CAUSE DELAYS. Nice 2/2 condo, community heated pool, tiki huts and bbq area. 2nd floor unit
ⓘ Source: listings_history table (triggers on properties + properties_extension) + one-shot
backfill from property_details.listing_events for pre-trigger history.
Tax reassessment forecast FL · Resets to sale price
- Current annual tax
- $2,339 · $195/mo
- Projected year-2 tax
- $2,339 · $195/mo
- Expected delta
- $0/yr ($0/mo · 0.0%)
ⓘ Screening estimate from a state-policy table — verify with the county assessor before closing.
Climate risk First Street
- Flood 4/10 Moderate FEMA zone X (unshaded) · 13% chance over 30 yrs
- Wildfire 1/10 Low
- Heat 10/10 Extreme 7 d/yr ≥106°F today · 26 d/yr by 30 yrs out
- Wind 10/10 Extreme 99% chance of damaging wind over 30 yrs
- Air quality 2/10 Low 1 unhealthy d/yr today · 1 by 30 yrs out
Nearby sold comps map
Loading sold comps map…
Walkable amenities ~0.75 mi
Loading nearby amenities…
Taxation est. · year 1
- Rental income
- $19,164
- − Mortgage interest
- −$7,002
- − Property taxes
- −$2,339
- − Insurance
- −$625
- − Repairs & maintenance
- −$1,533
- − Management
- −$1,533
- − HOA
- −$4,788
- − Depreciation
- −$3,636
- Taxable loss
- −$2,292
- Est. tax savings @ 24.0%
- +$550
- After-tax cash flow
- $72/yr
For passive investors: Depreciation is non-cash, so a rental often shows a tax loss while cash-flowing — sheltering income. Rental losses are passive: they offset passive income freely, and up to $25,000/yr can offset ordinary (W-2) income if you actively participate and your MAGI is under $100k (phasing out to $0 by $150k); unused losses carry forward. On sale, claimed depreciation is recaptured at up to 25%, and gains may owe capital-gains tax (a 1031 exchange can defer both). Figures are a year-1 estimate at your 24.0% rate — not tax advice; consult a CPA.
Schools (NCES district)
- District
- Lee
- NCES district ID
- 1201080
- Math proficiency
- 47% ▼ -11.00%
- Reading proficiency
- 50% ▼ -4.00%
- Median HH income
- $49,518
- Composite
- 41.49/100
- National rank
- #3458
- State rank
- #42 of 73 in FL
Livability — Cape Coral
- Score
- 77/100
- State rank
- #208
- US rank
- #3098
Category grades
Schools grade is shown separately in the Schools card above.
Census & demographics
- Census place
- Cape Coral, FL
- County
- Lee County · 788,662 people
- City population
- 217,388
- Metro
- Cape Coral-Fort Myers, FL
- Population (ZIP)
- 40,231
- Household income
- $73,053
- Rent vs Own
- Severe rent burden
- 1657.0
Population outlook (Lee County) Hauer SSP2
- Today (2025)
- 871,946 people
- By 2030
- 955,468 · +9.6%
- By 2040
- 1,113,587 · +27.7%
- By 2050
- 1,256,891 · +44.1%
- By 2075
- 1,560,270 · +78.9%
- By 2100
- 1,726,848 · +98.0%
Race, ethnicity, and origin ACS 2023
- Neighborhood character
- Diverse neighborhood (Simpson 0.55)
- Race & ethnicity
- White 56% Hispanic / Latino 36% Two or more races 24% Black 3% Asian 1%
- Hispanic origin (detail)
- Puerto Rican 7% Cuban 14% Dominican 4%
- Common ancestry
- Romanian 2% Lithuanian 2% Serbian 1%
- Foreign-born
- 20% · Canada, Jamaica
- Languages at home
- 69% English-only · Spanish 27% Other Indo-European 1% German/W. Germanic 1%
Political lean MEDSL · Lee
- 2024 margin
- Strong R (+28.4) · D 35.5% · R 63.9%
- 2008→2024 swing
- -18.0pp toward R · 2008: -10.4pp · 2024: -28.4pp
- All cycles
- 2024: R+28.4 2020: R+19.2 2016: R+20.4 2012: R+16.6 2008: R+10.4
Not yet ingested
- Civics
- —
Market trends
- HPI YoY
- ▼ -94.24%
- Current HPI
- 313.8761
- Rent YoY
- ▼ -5.60%
- Metro
- Cape Coral-Fort Myers, FL
- State GDP YoY
- ▲ 3.28%
- F500 in state
- 36
Industry mix (Fortune 500 HQ in FL)
| Industry | F500 HQs | Revenue |
|---|---|---|
| Industrial Technology | 2 | $29B |
|
||
| Insurance | 2 | $17B |
|
||
| Retail | 1 | $60B |
|
||
| Technology Distribution | 1 | $58B |
|
||
| Homebuilding | 1 | $35B |
|
||
| Technology Manufacturing | 1 | $35B |
|
||
Price history
+316.7% since first listed8 events — show timeline
- 2026-03-08 Price Changed $125,000 FORTMLS
- 2026-01-19 Listed $135,000 FORTMLS
- 2025-12-18 Listing Removed — FORTMLS
- 2025-09-07 Price Changed $145,000 FORTMLS
- 2025-03-23 Listed $150,000 FORTMLS
- 2015-03-02 Price Changed $29,900 FORTMLS
- 2010-03-11 Sold (Public Records) $30,000 Public Records
- 2010-03-09 Sold (MLS) $30,000 FORTMLS
Property tax history
+8.2%/yrLatest (2025): $2,339 · +4.0% YoY. Source: county tax records.
Cash-flow waterfall
monthlySold comps — $/sqft
last 12 mo · ≤1 miLoading sold comps…