 🌊 Lakefront
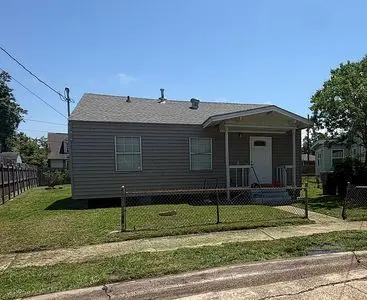
22 Curtis Dr · New Orleans, LA
Flood risk 8/10 · Major
- FEMA flood zone
- X (shaded)
- Chance of flooding over 30 yrs
- 0.6%
- Est. flood insurance / yr
- $507 – $1,088
Fire risk 1/10 · Minimal
- Est. fire insurance / yr
- $1,269 – $2,357
Heat risk 10/10 · Severe
- Hot days now (above 107°F)
- 7 days/yr
- Hot days in 30 yrs
- 21 days/yr
Wind risk 10/10 · Severe
- Chance of severe wind over 30 yrs
- 99.0%
Air-quality risk 3/10 · Minor
- Unhealthy air days now
- 3 days/yr
- Unhealthy air days in 30 yrs
- 3 days/yr
Risk factors via First Street. Map © Google.
Why this score? — see what drove the B- grade
The composite is a weighted blend of 9 inputs, each scored 0–100. Each bar is that input's sub-score; the figure is the points it added to the 100-point composite (weight × sub-score).
- Cash flow +26.8/30.0
- ARV discount +15.0/15.0
- DSCR +9.2/10.0
- 1% rule +6.7/10.0
- Livability +4.0/5.0
- Condition / age +2.5/5.0
- Rent growth +2.4/5.0
- Schools +1.6/10.0
- Appreciation +0.0/10.0
$135,000
🖨 Deal sheet (PDF) 📄 Offer letter ✓ Due diligence
Listing remarks
Raised cottage offers new renovation, low maintenance interior and exterior, large yard plus Offstreet parking in a very convenient location off Haynes Boulevard by Lakefront Airport. New Laminate floors throughout accent a floor plan that offers 2 or 3 Bedrooms, with possibility of an office. Two bedrooms side by side join via a door, Would be an ideal office, sitting room, nursery, exercise or hobby area. 1 Renovated Full Bath. Located by the New Orleans lakefront, schools, parks, and I-10 for easy access to Slidell, Downtown, New Orleans East, Chalmette and Mississippi.
Key facts
- New renovation
- Large yard
- New laminate floors
Tags
Property features AI
Exterior
- Home design: Single-family property built in 1960
- Construction: Built in 1960
- Exterior features: Located in the New Orleans East Area subdivision
Neighborhood map
What this means for you Summary
Snapshot
- This is a 3-bed/1.0-bath single-family listed at $135k.
Deal economics
- At list price, monthly cash flow is $303 ($4k/yr) — positive.
- The deal already cash-flows at list — no discount required.
- Meets the 1% rule at list price ($2k rent vs $135k).
- Recommended offer: $133k (1.5% below list) — sets the bar for market timing.
- Cap rate 9.6% vs local median 4.4% in New Orleans — top-decile yield for the area; either an underpriced asset or a hidden risk that comps aren't pricing in. Stress-test before assuming the spread holds.
Location & tenants
- Location reads 81/100 on livability (#3 in LA, #1,383 nationally) — a professional / high-income tenant draw. Strengths: amenities A+, commute A+, health & safety A+; Watch: crime C-, employment D.
- Orleans Parish (urban): math 11% / reading 27% proficiency, ranked #69 of 98 in LA (top 70%) — low school quality limits family demand, transient renter base, plan for 1-2y turnover; 68% free/reduced lunch — lower-income household profile, screen leases tightly.
- Market conditions: Rents soft (-0.2%/yr); 224 active listings in the ZIP; 31 comparable units currently listed for rent nearby; rentals at typical pace (median 25d on market — plan ~3-4 weeks tenant-placement turnaround); lower-income renter base — watch delinquency; 710 units permitted in Orleans Parish in 2024 (244 in 5+ unit buildings).
- At $1,581/mo this rent would consume 45% of the median local household income ($42k/yr) (locally 1767% of renters already pay >50% of income on rent) — very limited rent-growth headroom before tenants either downsize or default.
Forward outlook
- Local home prices are declining (-3.0%/yr); year-one equity from $933 of loan paydown is wiped out by about $4k of value loss. Plan a longer hold.
- Orleans County population projected at +61% by 2050 — long-run rental-demand tailwind backs the buy-and-hold thesis.
Negotiation context
- It's been on market 27 days — a 2% lower offer ($133k) is reasonable based on typical stale-listing flexibility.
- 5 sale attempts since 3y ago with the ask held roughly flat each time — persistent listings suggest the price (not the market) is what's stuck; bring a comps-based counter.
- Current owner paid $15k; list at $135k implies a 800% gain — meaningful room to come down on a strong offer.
Risks & watch-outs
- Watch-outs: flood insurance adds $66/mo.
- Climate carrying-cost: severe flood risk; severe wind risk, 99% chance of damaging wind over 30y; extreme-heat days projected 7→21/yr by 2055 (HVAC capex compounding) — expect insurance premiums to compound above CPI over the hold.
Questions for the listing agent
- Built in 1960 — when were the roof, HVAC, electrical panel, plumbing, and water heater last replaced?
- What's the actual annual flood-insurance premium (NFIP or private), and is the property in a SFHA with mandatory coverage?
- Is there a deadline driving the sale (1031 exchange, divorce, estate, relocation)? That informs how much negotiation room exists.
- This sits on a lake — are riparian / water-frontage rights deeded with the parcel? Any dock permits, shoreline easements, or HOA water-use restrictions?
- What's the documented flood / surge / shoreline-erosion history here (FEMA AND non-FEMA — e.g., storm surge, creek backup, septic-field saturation)?
- Any water-quality or seasonal algae-bloom issues that affect tenant satisfaction or short-term-rental demand?
- What's the average days-on-market for RENTAL listings here right now (not sales)? A rising rental-DOM trend means longer vacancies and softer asking-rent achievability than the comps imply.
- What's the recent tenant-quality profile in this submarket — average credit score on applications, eviction rate, late-payment / NSF rate, and stable-employment percentage? A property-management company in the area should have these aggregated.
- How much new for-sale + rental construction is in the pipeline within 1–3 miles? Heavy new supply typically softens prices + rents 12–24 months out; constrained supply supports both.
Investment metrics
- 1% rule
- 1.17% ✓
- Cap rate
- 9.58%
- Cash-on-cash
- 11.73%
- DSCR
- 1.52
- GRM
- 7.1
CMA / ARV
- ARV (on-the-fly)
- $163,490
- Comps found
- 4
Show comp detail 4 sales within ~0.75 mi
| Address | Dist | Beds/Ba | Sqft | Sold | Price | $/sf | Match |
|---|---|---|---|---|---|---|---|
| 7922 Flounder St | 0.29mi | 2/1.0 (-1) | 988 (-5%) | 9mo | $115,000 | $116 | 65 |
| 8007 Drum St | 0.36mi | 2/1.0 (-1) | 1,092 (+5%) | 8mo | $126,000 | $115 | 64 |
| 7933 Danube Rd | 0.18mi | 3/2.0 | 1,100 (+5%) | 21mo | $119,900 | $109 | 61 |
| 7938 Edward St | 0.47mi | 3/1.0 | 951 (-9%) | 15mo | $136,000 | $143 | 51 |
Match score weights: distance 35% · size 25% · config 20% · recency 20%. Top-matched comps best support the ARV.
Projected returns pro-forma
-3.0% appreciation · 0.0% rent growth · sell at horizon
- IRR
- -5.3%
- Equity multiple
- 0.81×
- Total profit
- $-7,175
- Equity at exit
- $20,129
- IRR
- 0.4%
- Equity multiple
- 1.02×
- Total profit
- $831
- Equity at exit
- $11,672
Cash invested: $37,800 (down + closing). Projections, not guarantees.
Landlord ↔ Tenant lean methodology
- Overall (STATE)
- 90 Strongly Landlord-Friendly
- State Louisiana
- 90 Strongly Landlord-Friendly · R+12
- County
- — inherits STATE
- City
- — inherits STATE
ZIP-level market 70126
- Home prices YoY
- -17.0%
- Rents YoY
- -0.2%
- Active inventory
- 224
- Price-to-rent
- 7.1×
Monthly cashflow live
- Estimated rent
- $1,581 high interval (Pro) →
- Mortgage (P&I)
- −$708
- Tax from tax record
- −$115 /mo · $1,383/yr
- Insurance
- −$56
- Flood insurance flood zone
- −$66 /mo · $798/yr
- HOA
- −$0
- Vacancy / Maint / Mgmt
- −$332
- Net cashflow
- $303
Break-even live
Sensitivity live
| Price | -10% $379 | -5% $341 | +0% $303 | +5% $265 | +10% $227 |
|---|---|---|---|---|---|
| Rent | -10% $178 | -5% $241 | +0% $303 | +5% $366 | +10% $428 |
| Rate | -1.0pp $371 | -0.5pp $337 | base $303 | +0.5pp $268 | +1.0pp $232 |
UW: 25.0% down · 7.5% · 30yr · 1.5% tax · 5.0% vac · 8.0% maint · 8.0% mgmt
Financing live
Cash to close
- Down payment
- $33,750
- Closing costs
- $4,050
- Reserves months
- —
- Total cash needed
- —
Loan-product check · same deal, 3 products live
Conventional
25% down · 7.5% · 30yr
- Down + closing
- —
- Monthly P&I
- —
- Monthly cashflow
- —
- DSCR
- —
- Eligible?
- —
Personal DTI + credit; lowest rate.
DSCR
20% down · 8.5% · 30yr
- Down + closing
- —
- Monthly P&I
- —
- Monthly cashflow
- —
- DSCR
- —
- Eligible?
- —
No personal income docs; deal must DSCR.
Hard money
10% down · 12.0% · 12mo
- Down + closing
- —
- Monthly P&I
- —
- Monthly cashflow
- —
- DSCR
- —
- Eligible?
- —
Short-term bridge; refi at stabilization.
Rent comps 31 comps
| Address | Beds | Baths | Sqft | Rent | $/sqft | DOM | Units | Dist |
|---|---|---|---|---|---|---|---|---|
| 8025 Pompano St New Orleans, LA | 3.0 | 1.0 | 1131 | $1,595 | $1.41 | 17d | 1 | 0.39mi |
| 7909 Edward St New Orleans, LA | 3.0 | 1.5 | 1073 | $1,850 | $1.72 | 4d | 1 | 0.48mi |
| 7710 Shelly St New Orleans, LA | 2.0 | 1.0 | 800 | $1,400 | $1.75 | 3d | 1 | 0.57mi |
| 6032 Kuebel Dr New Orleans, LA | 3.0 | 2.0 | 1100 | $1,600 | $1.45 | 25d | 1 | 0.65mi |
| 6030 Kuebel Dr New Orleans, LA | 3.0 | 2.0 | 1100 | $1,600 | $1.45 | 25d | 1 | 0.65mi |
| 6027 Wales St New Orleans, LA | 3.0 | 1.0 | 1146 | $1,550 | $1.35 | 25d | 1 | 0.66mi |
| 6025 Wales St New Orleans, LA | 3.0 | 1.0 | 1147 | $1,550 | $1.35 | 25d | 1 | 0.66mi |
| 8003 W Laverne St Unit 8003 New Orleans, LA | 2.0 | 1.5 | 1000 | $1,275 | $1.27 | 25d | 1 | 0.69mi |
| 7918 W Laverne St New Orleans, LA | 3.0 | 2.0 | 1166 | $1,750 | $1.50 | 25d | 1 | 0.72mi |
| 7621 Alabama St New Orleans, LA | 2.0 | 1.0 | 1000 | $1,400 | $1.40 | 25d | 1 | 0.78mi |
| 7611 Mayfair Pl New Orleans, LA | 2.0 | 1.5 | 1440 | $1,450 | $1.01 | 4d | 1 | 0.86mi |
| 7702 Belcrest Pl New Orleans, LA | 3.0 | 1.5 | 1150 | $1,650 | $1.43 | 25d | 1 | 0.89mi |
| 7404 Sussex Pl New Orleans, LA | 2.0 | 1.5 | 1400 | $1,450 | $1.04 | 4d | 1 | 0.95mi |
| 6835 Mayo Blvd Unit C New Orleans, LA | 2.0 | 1.5 | 840 | $1,195 | $1.42 | 25d | 1 | 0.99mi |
| 4908 Ray Ave New Orleans, LA | 2.0 | 1.0 | 796 | $1,200 | $1.51 | 17d | 1 | 1.09mi |
| 4718 Reynes St New Orleans, LA | 2.0 | 1.5 | 890 | $1,475 | $1.66 | 25d | 1 | 1.18mi |
| 7019 Huntington Park Dr Unit 21 New Orleans, LA | 2.0 | 1.5 | 952 | $982 | $1.03 | 25d | 1 | 1.18mi |
| 7019 Huntington Park Dr New Orleans, LA | 2.0 | 1.5 | 952 | $986 | $1.04 | 25d | 1 | 1.18mi |
| 4819 21 Francis Dr New Orleans, LA | 3.0 | 1.0 | 1272 | $1,880 | $1.48 | 4d | 1 | 1.18mi |
| 6881 Parc Brittany Blvd New Orleans, LA | 1.0–2.0 | 1.0–2.0 | 741 | $1,055 | $1.42 | 3d | 31 | 1.21mi |
| 4745 Francis Dr New Orleans, LA | 3.0 | 2.0 | 1311 | $1,550 | $1.18 | 17d | 1 | 1.24mi |
| 4941 Pecan St Unit 1 New Orleans, LA | 2.0 | 1.0 | 1000 | $1,200 | $1.20 | 25d | 1 | 1.25mi |
| 4722 Shalimar Dr New Orleans, LA | 3.0 | 2.0 | 1157 | $1,400 | $1.21 | 25d | 1 | 1.32mi |
| 7019 Crowder Blvd Unit 126 New Orleans, LA | 2.0 | 1.5 | 952 | $982 | $1.03 | 25d | 1 | 1.33mi |
| 8802 Morrison Rd New Orleans, LA | 2.0 | 1.0 | 1071 | $1,275 | $1.19 | 25d | 1 | 1.36mi |
| 4880 Viola St New Orleans, LA | 3.0 | 2.0 | 1150 | $1,595 | $1.39 | 25d | 1 | 1.40mi |
| 4745 Tulip St New Orleans, LA | 3.0 | 1.0 | 1125 | $1,750 | $1.56 | 21d | 1 | 1.45mi |
| 4808 Viola St New Orleans, LA | 3.0 | 2.0 | 1130 | $1,500 | $1.33 | 25d | 1 | 1.46mi |
| 4701 Rosemont Pl New Orleans, LA | 3.0 | 1.0 | 843 | $1,450 | $1.72 | 25d | 1 | 1.48mi |
| 9002 Morrison Rd New Orleans, LA | 2.0 | 1.5 | 1050 | $1,150 | $1.10 | 21d | 1 | 1.49mi |
| 4901 Bonita Dr New Orleans, LA | 2.0 | 1.0 | 900 | $1,100 | $1.22 | 25d | 1 | 1.50mi |
Listing history 23 events
-
2026-06-21days on market $135,000 Active 27 DOM
-
2026-06-18days on market $135,000 Active 24 DOM
-
2026-06-17days on market $135,000 Active 23 DOM
-
2026-06-16days on market $135,000 Active 22 DOM
-
2026-06-15days on market $135,000 Active 21 DOM
-
2026-06-13days on market $135,000 Active 19 DOM
-
2026-06-10days on market $135,000 Active 16 DOM
-
2026-06-09days on market $135,000 Active 15 DOM
-
2026-06-08days on market $135,000 Active 14 DOM
-
2026-06-07days on market $135,000 Active 13 DOM
-
2026-06-05days on market $135,000 Active 10 DOM
-
2026-06-03days on market $135,000 Active 9 DOM
-
2026-06-02days on market $135,000 Active 8 DOM
-
2026-06-01days on market $135,000 Active 7 DOM
-
2026-05-31days on market $135,000 Active 6 DOM
-
2026-05-26$135,000 Active
-
2024-05-30historical $1,450
-
2024-05-01$1,450
-
2024-04-30$169,000
-
2024-01-25historical $1,500
-
2023-12-25$1,500
-
2023-06-13$155,000
-
1996-04-18soldstatus $15,000
ⓘ Source: listings_history table (triggers on properties + properties_extension) + one-shot
backfill from property_details.listing_events for pre-trigger history.
Tax reassessment forecast LA · Resets to sale price
- Current annual tax
- $1,383 · $115/mo
- Projected year-2 tax
- $1,383 · $115/mo
- Expected delta
- $0/yr ($0/mo · 0.0%)
ⓘ Screening estimate from a state-policy table — verify with the county assessor before closing.
Climate risk First Street
- Flood 8/10 Severe FEMA zone X (shaded) · 60% chance over 30 yrs
- Wildfire 1/10 Low
- Heat 10/10 Extreme 7 d/yr ≥107°F today · 21 d/yr by 30 yrs out
- Wind 10/10 Extreme 99% chance of damaging wind over 30 yrs
- Air quality 3/10 Moderate 3 unhealthy d/yr today · 3 by 30 yrs out
Nearby sold comps map
Loading sold comps map…
Walkable amenities ~0.75 mi
Loading nearby amenities…
Taxation est. · year 1
- Rental income
- $18,972
- − Mortgage interest
- −$7,562
- − Property taxes
- −$1,383
- − Insurance
- −$1,472
- − Repairs & maintenance
- −$1,518
- − Management
- −$1,518
- − Depreciation
- −$3,927
- Taxable income
- $1,591
- Est. tax owed @ 24.0%
- −$382
- After-tax cash flow
- $3,255/yr
For passive investors: Depreciation is non-cash, so a rental often shows a tax loss while cash-flowing — sheltering income. Rental losses are passive: they offset passive income freely, and up to $25,000/yr can offset ordinary (W-2) income if you actively participate and your MAGI is under $100k (phasing out to $0 by $150k); unused losses carry forward. On sale, claimed depreciation is recaptured at up to 25%, and gains may owe capital-gains tax (a 1031 exchange can defer both). Figures are a year-1 estimate at your 24.0% rate — not tax advice; consult a CPA.
Schools (NCES district)
- District
- Orleans Parish
- NCES district ID
- 2201170
- Math proficiency
- 11% ▼ -52.00%
- Reading proficiency
- 27% ▼ -46.00%
- Median HH income
- $37,011
- Composite
- 15.78/100
- National rank
- #9271
- State rank
- #69 of 98 in LA
Livability — New Orleans
- Score
- 81/100
- State rank
- #3
- US rank
- #1383
Category grades
Schools grade is shown separately in the Schools card above.
Census & demographics
- Census place
- New Orleans, LA
- County
- Orleans Parish · 338,817 people
- City population
- 338,817
- Metro
- New Orleans-Metairie, LA
- Population (ZIP)
- 27,047
- Household income
- $41,709
- Rent vs Own
- Severe rent burden
- 1767.0
Population outlook (Orleans County) Hauer SSP2
- Today (2025)
- 513,025 people
- By 2030
- 575,781 · +12.2%
- By 2040
- 700,174 · +36.5%
- By 2050
- 826,541 · +61.1%
- By 2075
- 1,123,374 · +119.0%
- By 2100
- 1,355,609 · +164.2%
Race, ethnicity, and origin ACS 2023
- Neighborhood character
- Predominantly Black (85%)
- Race & ethnicity
- Black 85% Hispanic / Latino 6% Two or more races 5% White 5%
- Hispanic origin (detail)
- Common ancestry
- Lithuanian 1% Italian 1%
- Foreign-born
- 4% · Canada, Vietnam
- Languages at home
- 94% English-only · Spanish 5% Other Indo-European 1%
Political lean MEDSL · Orleans
- 2024 margin
- Solid D (+67.0) · D 82.2% · R 15.2% · Other 2.7%
- 2008→2024 swing
- +6.7pp toward D · 2008: 60.3pp · 2024: 67.0pp
- All cycles
- 2024: D+67.0 2020: D+68.2 2016: D+66.2 2012: D+62.5 2008: D+60.3
Not yet ingested
- Civics
- —
Market trends
- HPI YoY
- ▼ -36.35%
- Current HPI
- 177.355
- Rent YoY
- ▼ -0.24%
- Metro
- New Orleans-Metairie, LA
- State GDP YoY
- ▲ 3.29%
- F500 in state
- 10
Industry mix (Fortune 500 HQ in LA)
| Industry | F500 HQs | Revenue |
|---|---|---|
| Telecommunications | 2 | $23B |
|
||
| Utilities | 1 | $12B |
|
||
| Wholesale / Distribution | 1 | $5B |
|
||
| Advertising | 1 | $2B |
|
||
Price history
+800.0% since first listed8 events — show timeline
- 2026-05-26 Listed $135,000 FSBO.com
- 2024-05-30 Rental Removed $1,450 GSREIN
- 2024-05-01 Listed for Rent $1,450 GSREIN
- 2024-04-30 Listed $169,000 AcadianaMLS
- 2024-01-25 Rental Removed $1,500 GSREIN
- 2023-12-25 Listed for Rent $1,500 GSREIN
- 2023-06-13 Listed $155,000 AcadianaMLS
- 1996-04-18 Sold (Public Records) $15,000 Public Records
Property tax history
+2.8%/yrLatest (2026): $1,383 · +1.1% YoY. Source: county tax records.
Cash-flow waterfall
monthlySold comps — $/sqft
last 12 mo · ≤1 miLoading sold comps…