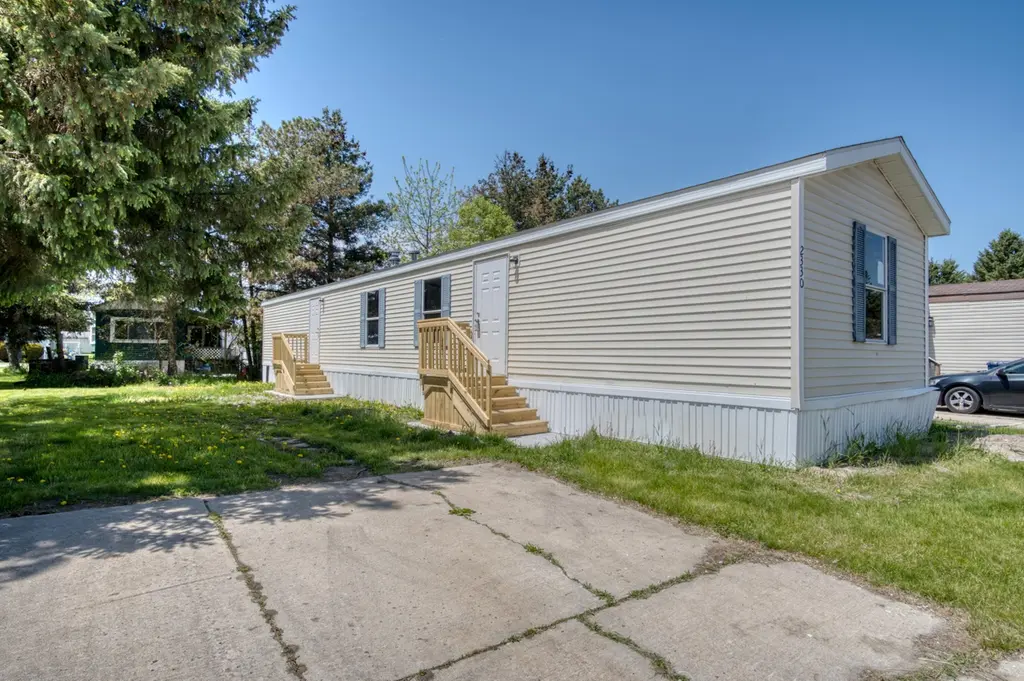
2330 Theatre Trl Lot 53 · Mount Pleasant, MI
Flood risk No data
- FEMA flood zone
- —
- Chance of flooding over 30 yrs
- —
- Est. flood insurance / yr
- —
Fire risk No data
- Est. fire insurance / yr
- —
Heat risk No data
- Hot days now (above threshold)
- —
- Hot days in 30 yrs
- —
Wind risk No data
- Chance of severe wind over 30 yrs
- —
Air-quality risk No data
- Unhealthy air days now
- —
- Unhealthy air days in 30 yrs
- —
Risk factors via First Street. Map © Google.
Why this score? — see what drove the B grade
The composite is a weighted blend of 9 inputs, each scored 0–100. Each bar is that input's sub-score; the figure is the points it added to the 100-point composite (weight × sub-score).
- Cash flow +30.0/30.0
- 1% rule +10.0/10.0
- DSCR +10.0/10.0
- ARV discount +6.7/15.0
- Rent growth +5.0/5.0
- Livability +4.1/5.0
- Condition / age +4.0/5.0
- Schools +3.3/10.0
- Appreciation +0.0/10.0
$42,500
🖨 Deal sheet 📄 Offer letter ✓ Due diligence
Listing remarks MLS
Broadway Acres is now under new ownership and professional management! Looking for an affordable 3-bedroom, 2 full bath home? This welcoming community offers a variety of financing options to fit your needs. Enjoy clean, well-maintained grounds along with newly finished roads. Also super convenient location in Mount Pleasant. Lot rent is approximately $425/month. Please note: this is a mobile home community; no land is included in the sale. Buyer must complete park application and receive approval prior to closing. Buyers must pay a 6% sales tax and a $90.00 title transfer fee that goes to the Secretary of State. Contact the listing agent today for more information or to schedule a tour!
Key facts
- Built 1994
- Listed 24 days
Property features AI
Finance
- Other: Directions: From M20 head south on S Isabella Rd., then turn east on E Kay St. It ends on Theatre Trail; turn south
- HOA & community: Monthly HOA fee of 425.0; Has association
Exterior
- Utilities: Natural gas connected
- Home design: Ranch-style home; Residential property
- Construction: Built in 1994; Vinyl siding; Shingle roof; 720 living area
- Exterior features: Paved road access; Public water
Interior
- Kitchen: Kitchen
- Bedrooms: Primary bedroom; Bedroom 2; Bedroom 3
- Bathrooms: 2 full bathrooms; Primary bathroom
- Heating & cooling: Forced air heating; Has heating
- Interior features: 6 total rooms; Slab basement
Neighborhood map
What this means for you Summary
Snapshot
- This is a 3-bed/2.0-bath manufactured listed at $42k. Condition is rated good.
Deal economics
- At list price, monthly cash flow is $198 ($2k/yr) — positive.
- The deal already cash-flows at list — no discount required.
- Meets the 1% rule at list price ($1k rent vs $42k).
- Recommended offer: $42k (1.5% below list) — sets the bar for market timing.
- Cap rate 11.9% vs local median 3.4% in Mount Pleasant — top-decile yield for the area; either an underpriced asset or a hidden risk that comps aren't pricing in. Stress-test before assuming the spread holds.
Location & tenants
- Location reads 82/100 on livability (#55 in MI, #1,063 nationally) — a professional / high-income tenant draw. Strengths: amenities A+, cost of living A+, health & safety A+; Watch: crime C-, employment F.
- Mt. Pleasant City School District (town): math 33% / reading 48% proficiency, ranked #229 of 540 in MI (top 42%) — families likely to look elsewhere, expect single-tenant / working-renter base with shorter leases.
- Market conditions: Rents rising fast (+16.9%/yr); 249 active listings in the ZIP; 72 units permitted in Isabella County in 2024 (0 in 5+ unit buildings).
Forward outlook
- Local home prices are declining (-3.0%/yr); year-one equity from $294 of loan paydown is wiped out by about $1k of value loss. Plan a longer hold.
- Isabella County population projected at +9% by 2050 — modest demand growth; plan on rents tracking national, not racing it.
- At projected returns (-3.0% appreciation + 8.0% rent growth), your $12k cash investment doubles in ~5 years — after that, you're playing with house money.
Negotiation context
- It's been on market 24 days — a 2% lower offer ($42k) is reasonable based on typical stale-listing flexibility.
- 3 sale attempts with the ask held roughly flat each time — persistent listings suggest the price (not the market) is what's stuck; bring a comps-based counter.
Risks & watch-outs
- Watch-outs: HOA is 37% of rent.
Questions for the listing agent
- What does the HOA fee cover, when was the last increase, and are there any pending special assessments or reserve-fund shortfalls?
- Is there a deadline driving the sale (1031 exchange, divorce, estate, relocation)? That informs how much negotiation room exists.
- Schools are B-rated — typically a magnet for longer-tenancy family renters. What's the average tenant stay here, and is there a school-zone premium baked into asking?
- What's the average days-on-market for RENTAL listings here right now (not sales)? A rising rental-DOM trend means longer vacancies and softer asking-rent achievability than the comps imply.
- What's the recent tenant-quality profile in this submarket — average credit score on applications, eviction rate, late-payment / NSF rate, and stable-employment percentage? A property-management company in the area should have these aggregated.
- How much new for-sale + rental construction is in the pipeline within 1–3 miles? Heavy new supply typically softens prices + rents 12–24 months out; constrained supply supports both.
Investment metrics
- 1% rule
- 2.73% ✓
- Cap rate
- 11.87%
- Cash-on-cash
- 19.93%
- DSCR
- 1.89
- GRM
- 3.1
CMA / ARV
- ARV (on-the-fly)
- $41,760
- Comps found
- 1
Show comp detail 1 sale within ~0.75 mi
| Address | Dist | Beds/Ba | Sqft | Sold | Price | $/sf | Match |
|---|---|---|---|---|---|---|---|
| 2311 Theatre Trl Lot 12 | 0.02mi | 3/2.0 | 720 (0%) | 1mo | $42,000 | $58 | 98 |
Match score weights: distance 35% · size 25% · config 20% · recency 20%. Top-matched comps best support the ARV.
Projected returns pro-forma
-3.0% appreciation · 8.0% rent growth · sell at horizon
- IRR
- 22.2%
- Equity multiple
- 2.02×
- Total profit
- $12,108
- Equity at exit
- $6,337
- IRR
- 35.3%
- Equity multiple
- 5.69×
- Total profit
- $55,783
- Equity at exit
- $3,675
Cash invested: $11,900 (down + closing). Projections, not guarantees.
Landlord ↔ Tenant lean methodology
- Overall (STATE)
- 62 Landlord-Friendly
- State Michigan
- 62 Landlord-Friendly · EVEN
- County
- — inherits STATE
- City
- — inherits STATE
ZIP-level market 48858
- Home prices YoY
- -31.9%
- Rents YoY
- 16.9%
- Active inventory
- 249
- Price-to-rent
- 3.1×
Monthly cashflow live
- Estimated rent
- $1,160 medium interval (Pro) →
- Mortgage (P&I)
- −$223
- Tax est. 1.5%
- −$53 /mo · $638/yr
- Insurance
- −$18
- HOA
- −$425
- Vacancy / Maint / Mgmt
- −$244
- Net cashflow
- $198
Break-even live
UW: 25.0% down · 7.5% · 30yr · 1.5% tax · 5.0% vac · 8.0% maint · 8.0% mgmt
Financing live
Cash to close
- Down payment
- $10,625
- Closing costs
- $1,275
- Reserves months
- —
- Total cash needed
- —
Loan-product check · same deal, 3 products live
Conventional
25% down · 7.5% · 30yr
- Down + closing
- —
- Monthly P&I
- —
- Monthly cashflow
- —
- DSCR
- —
- Eligible?
- —
Personal DTI + credit; lowest rate.
DSCR
20% down · 8.5% · 30yr
- Down + closing
- —
- Monthly P&I
- —
- Monthly cashflow
- —
- DSCR
- —
- Eligible?
- —
No personal income docs; deal must DSCR.
Hard money
10% down · 12.0% · 12mo
- Down + closing
- —
- Monthly P&I
- —
- Monthly cashflow
- —
- DSCR
- —
- Eligible?
- —
Short-term bridge; refi at stabilization.
HOA detail
- Monthly dues
- $425 · $5,100/yr
- Likely covers
- landscaping
Listing history 14 events
-
2026-06-13status $42,500 Pending 24 DOM
-
2026-06-12days on market $42,500 Active 24 DOM
-
2026-06-09days on market $42,500 Active 21 DOM
-
2026-06-08days on market $42,500 Active 20 DOM
-
2026-06-07days on market $42,500 Active 19 DOM
-
2026-06-05days on market $42,500 Active 16 DOM
-
2026-06-03days on market $42,500 Active 15 DOM
-
2026-06-02days on market $42,500 Active 14 DOM
-
2026-06-01days on market $42,500 Active 13 DOM
-
2026-05-31days on market $42,500 Active 12 DOM
-
2026-05-30days on market $42,500 Active 11 DOM
-
2026-05-19$42,500 Active
Show marketing remark (696 chars)
Broadway Acres is now under new ownership and professional management! Looking for an affordable 3-bedroom, 2 full bath home? This welcoming community offers a variety of financing options to fit your needs. Enjoy clean, well-maintained grounds along with newly finished roads. Also super convenient location in Mount Pleasant. Lot rent is approximately $425/month. Please note: this is a mobile home community; no land is included in the sale. Buyer must complete park application and receive approval prior to closing. Buyers must pay a 6% sales tax and a $90.00 title transfer fee that goes to the Secretary of State. Contact the listing agent today for more information or to schedule a tour!
-
2026-05-19$42,500 Active 696-char remark
Show marketing remark (696 chars)
Broadway Acres is now under new ownership and professional management! Looking for an affordable 3-bedroom, 2 full bath home? This welcoming community offers a variety of financing options to fit your needs. Enjoy clean, well-maintained grounds along with newly finished roads. Also super convenient location in Mount Pleasant. Lot rent is approximately $425/month. Please note: this is a mobile home community; no land is included in the sale. Buyer must complete park application and receive approval prior to closing. Buyers must pay a 6% sales tax and a $90.00 title transfer fee that goes to the Secretary of State. Contact the listing agent today for more information or to schedule a tour!
ⓘ Source: listings_history table (triggers on properties + properties_extension) + one-shot
backfill from property_details.listing_events for pre-trigger history.
Nearby sold comps map
Loading sold comps map…
Walkable amenities ~0.75 mi
Loading nearby amenities…
Taxation est. · year 1
- Rental income
- $13,919
- − Mortgage interest
- −$2,381
- − Property taxes
- −$638
- − Insurance
- −$212
- − Repairs & maintenance
- −$1,114
- − Management
- −$1,114
- − HOA
- −$5,100
- − Depreciation
- −$1,236
- Taxable income
- $2,125
- Est. tax owed @ 24.0%
- −$510
- After-tax cash flow
- $1,861/yr
For passive investors: Depreciation is non-cash, so a rental often shows a tax loss while cash-flowing — sheltering income. Rental losses are passive: they offset passive income freely, and up to $25,000/yr can offset ordinary (W-2) income if you actively participate and your MAGI is under $100k (phasing out to $0 by $150k); unused losses carry forward. On sale, claimed depreciation is recaptured at up to 25%, and gains may owe capital-gains tax (a 1031 exchange can defer both). Figures are a year-1 estimate at your 24.0% rate — not tax advice; consult a CPA.
Condition & rehab AI · 14 photos
This mobile home is in good condition with recent updates, making it a solid investment for both resale and rental.
Value-add opportunities
- Both Painting exterior siding — Enhances curb appeal and value
- Both Landscaping improvements — Enhances curb appeal and value
- Both New flooring in living areas — Enhances aesthetics and value
- Both New kitchen appliances — Enhances functionality and value
Renovation cost estimate screening
Value-add ROI direction
- Both Painting exterior siding — Enhances curb appeal and value ↑
- Both Landscaping improvements — Enhances curb appeal and value ↑
- Both New flooring in living areas — Enhances aesthetics and value ↑
- Both New kitchen appliances — Enhances functionality and value ↑
ⓘ Cost ranges are severity-bucket heuristics (US national rule-of-thumb). Get contractor quotes + a written scope before underwriting a rehab budget.
Schools (NCES district)
- District
- Mt. Pleasant City School District
- NCES district ID
- 2624750
- Math proficiency
- 33% ▼ -5.00%
- Reading proficiency
- 48% ▼ -3.00%
- Median HH income
- $32,344
- Composite
- 33.16/100
- National rank
- #5548
- State rank
- #229 of 540 in MI
Livability — Mount Pleasant
- Score
- 82/100
- State rank
- #55
- US rank
- #1063
Category grades
Schools grade is shown separately in the Schools card above.
Census & demographics
- County
- Isabella County · 42,226 people
- City population
- 42,226
- Metro
- Mount Pleasant, MI
- Population (ZIP)
- 42,226
- Household income
- $51,267
- Rent vs Own
- Severe rent burden
- 2381.0
Population outlook (Isabella County) Hauer SSP2
- Today (2025)
- 75,111 people
- By 2030
- 77,600 · +3.3%
- By 2040
- 79,890 · +6.4%
- By 2050
- 81,568 · +8.6%
- By 2075
- 86,602 · +15.3%
- By 2100
- 92,201 · +22.8%
Race, ethnicity, and origin ACS 2023
- Neighborhood character
- Predominantly White (81%)
- Race & ethnicity
- White 81% Two or more races 6% Hispanic / Latino 5% Native American 4% Black 3% Asian 2%
- Hispanic origin (detail)
- Mexican 3%
- Common ancestry
- Romanian 6% Slovak 3% Iranian 3%
- Foreign-born
- 4% · Canada
- Languages at home
- 94% English-only · Spanish 2% Other Indo-European 1% German/W. Germanic 0%
Political lean MEDSL · Isabella
- 2024 margin
- Lean R (+7.5) · D 45.5% · R 53.0% · Other 1.6%
- 2008→2024 swing
- -26.7pp toward R · 2008: 19.2pp · 2024: -7.5pp
- All cycles
- 2024: R+7.5 2020: R+2.5 2016: R+3.7 2012: D+9.3 2008: D+19.2
Not yet ingested
- Civics
- —
Market trends
- HPI YoY
- ▼ -96.75%
- Current HPI
- 206.1153
- Rent YoY
- ▲ 16.89%
- Metro
- Mount Pleasant, MI
- State GDP YoY
- ▲ 1.37%
- F500 in state
- 28
Industry mix (Fortune 500 HQ in MI)
| Industry | F500 HQs | Revenue |
|---|---|---|
| Automotive Parts | 3 | $48B |
|
||
| Automotive | 2 | $372B |
|
||
| Chemicals | 1 | $45B |
|
||
| Automotive Retail | 1 | $29B |
|
||
| Healthcare / Medical Devices | 1 | $23B |
|
||
| Automotive Technology | 1 | $20B |
|
||
Price history
+0.0% since first listed3 events — show timeline
- 2026-05-19 Listed $42,500 MiRealSource-MiMLS
- 2026-05-19 Listed $42,500 REALCOMP
- 2026-05-19 Listed $42,500 SW Michigan MLS
Cash-flow waterfall
monthlySold comps — $/sqft
last 12 mo · ≤1 miLoading sold comps…