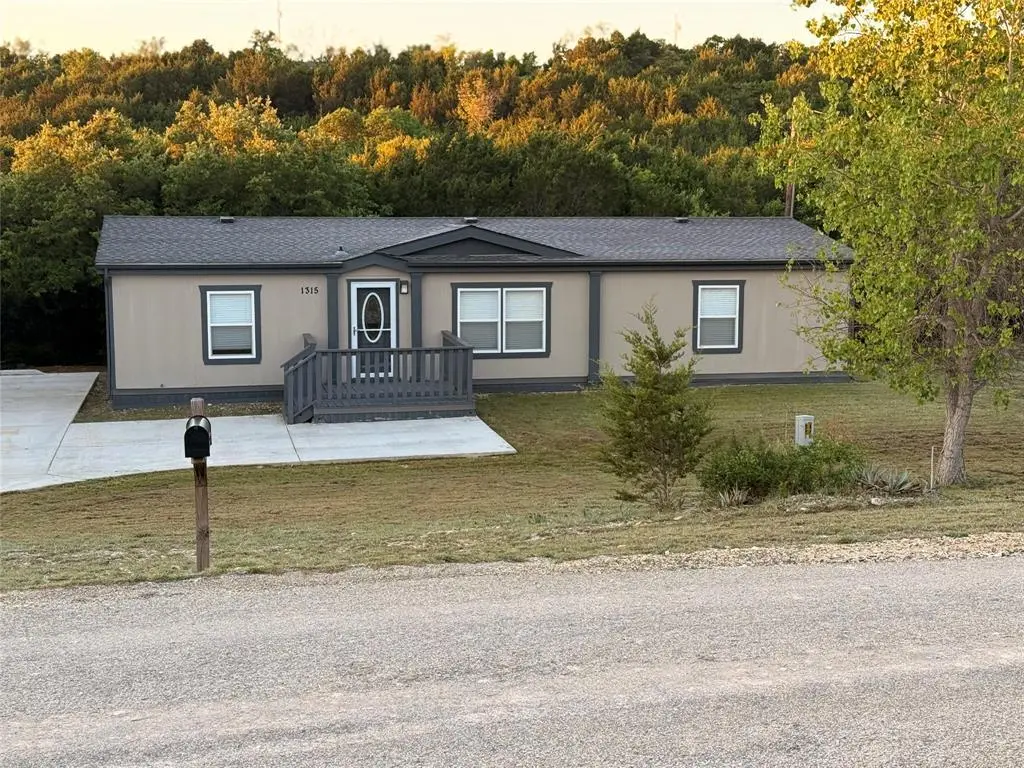
1315 Phoenix Ct · Granbury, TX
Flood risk 1/10 · Minimal
- FEMA flood zone
- X (unshaded)
- Chance of flooding over 30 yrs
- 0.0%
- Est. flood insurance / yr
- $507 – $1,088
Fire risk 6/10 · Moderate
- Est. fire insurance / yr
- $1,222 – $2,270
Heat risk 7/10 · Major
- Hot days now (above 108°F)
- 7 days/yr
- Hot days in 30 yrs
- 23 days/yr
Wind risk 6/10 · Moderate
- Chance of severe wind over 30 yrs
- 27.0%
Air-quality risk 2/10 · Minimal
- Unhealthy air days now
- 1 days/yr
- Unhealthy air days in 30 yrs
- 2 days/yr
Risk factors via First Street. Map © Google.
Why this score? — see what drove the D+ grade
The composite is a weighted blend of 9 inputs, each scored 0–100. Each bar is that input's sub-score; the figure is the points it added to the 100-point composite (weight × sub-score).
- ARV discount +15.0/15.0
- Cash flow +13.6/30.0
- DSCR +4.1/10.0
- Schools +4.0/10.0
- 1% rule +3.9/10.0
- Livability +3.3/5.0
- Rent growth +2.8/5.0
- Condition / age +2.5/5.0
- Appreciation +0.0/10.0
$215,000
🖨 Deal sheet 📄 Offer letter ✓ Due diligence
Listing remarks MLS
Charming 3-bedroom, 2-bath home situated on two spacious lots, offering both comfort and room to grow. Located on a quiet cul-de-sac in a peaceful neighborhood, this property backs up to a greenbelt—providing added privacy and a serene setting. The home is in immaculate condition and features a newly poured concrete driveway, adding durability and a clean, modern touch. Inside, you’ll find a well-maintained space ready for its next owner, with the oversized refrigerator included for added convenience. Additional updates include a newer outdoor HVAC unit, installed just 2 years ago, giving peace of mind for years to come. This is a fantastic opportunity for anyone seeking the perfect balance of privacy, space, and convenience.
Key facts
- 1,742 sq ft lot
- Built 2006
- Listed 72 days
Neighborhood map
What this means for you Summary
Snapshot
- This is a 3-bed/2.0-bath other listed at $215k.
Deal economics
- At list price, monthly cash flow is $13 ($154/yr) — positive.
- The deal already cash-flows at list — no discount required.
- To meet the 1% rule (rent ≥ 1% of price), the offer needs to be $192k (10.8% below list).
- Recommended offer: $192k (10.8% below list) — sets the bar for 1% rule.
- Cap rate 6.4% vs local median 3.8% in Granbury — top-decile yield for the area; either an underpriced asset or a hidden risk that comps aren't pricing in. Stress-test before assuming the spread holds.
Location & tenants
- Location reads 66/100 on livability (#628 in TX) — a middle-class / working-renter tenant base. Strengths: cost of living A+, housing A+, health & safety A+; Watch: employment C-, crime D+, schools D.
- Granbury ISD (town): math 46% / reading 46% proficiency, ranked #237 of 826 in TX (top 29%) — families likely to look elsewhere, expect single-tenant / working-renter base with shorter leases.
- Market conditions: Rents rising (+1.1%/yr); 929 active listings in the ZIP; 9 comparable units currently listed for rent nearby; rentals at typical pace (median 24d on market — plan ~3-4 weeks tenant-placement turnaround); 125 units permitted in Hood County in 2024 (0 in 5+ unit buildings).
- This rent runs 33% of the median local income ($70k/yr) — at the standard rent-burdened threshold; future hikes will face affordability resistance.
Forward outlook
- Local home prices are declining (-3.0%/yr); year-one equity from $1k of loan paydown is wiped out by about $6k of value loss. Plan a longer hold.
- Hood County population projected at +29% by 2050 — long-run rental-demand tailwind backs the buy-and-hold thesis.
Negotiation context
- It's been on market 72 days — a 6% lower offer ($202k) is reasonable based on typical stale-listing flexibility.
- 2 sale attempts since 5y ago with the ask held roughly flat each time — persistent listings suggest the price (not the market) is what's stuck; bring a comps-based counter.
- Current owner paid $94k; list at $215k implies a 128% gain — meaningful room to come down on a strong offer.
Risks & watch-outs
- Climate carrying-cost: major wind risk, 27% chance of damaging wind over 30y; major wildfire risk; extreme-heat days projected 7→23/yr by 2055 (HVAC capex compounding) — expect insurance premiums to compound above CPI over the hold.
Questions for the listing agent
- It's been on market 72 days. Have you received any prior offers? Is the seller open to a 11% concession, seller financing, or rate buy-down credit?
- What does the HOA fee cover, when was the last increase, and are there any pending special assessments or reserve-fund shortfalls?
- Why hasn't it sold? Are there any deal-killer items the seller is aware of (foundation, flood, title, zoning, code violations)?
- Is there a deadline driving the sale (1031 exchange, divorce, estate, relocation)? That informs how much negotiation room exists.
- Schools are D-rated, which usually means shorter tenancies and higher turnover. Who's the typical renter profile here, and what's been the actual vacancy rate?
- Crime grade is D in this area — have there been break-ins, vandalism, or insurance claims at this property in the last 3 years? What carrier currently insures it and at what premium?
- The area grade is low — what's the realistic commute time and amenity access for the typical tenant pool here? Any planned neighborhood developments (good or bad) we should know about?
- What's the average days-on-market for RENTAL listings here right now (not sales)? A rising rental-DOM trend means longer vacancies and softer asking-rent achievability than the comps imply.
- What's the recent tenant-quality profile in this submarket — average credit score on applications, eviction rate, late-payment / NSF rate, and stable-employment percentage? A property-management company in the area should have these aggregated.
- How much new for-sale + rental construction is in the pipeline within 1–3 miles? Heavy new supply typically softens prices + rents 12–24 months out; constrained supply supports both.
Investment metrics
- 1% rule
- 0.89% ✗
- Cap rate
- 6.36%
- Cash-on-cash
- 0.26%
- DSCR
- 1.01
- GRM
- 9.3
CMA / ARV
- ARV (median comp)
- $258,452
- List price
- $215,000
- Delta
- -16.81%
- Verdict
- UNDERPRICED
- Comps
- 20 within 1.0 mi
Projected returns pro-forma
-3.0% appreciation · 1.1% rent growth · sell at horizon
- IRR
- -18.1%
- Equity multiple
- 0.38×
- Total profit
- $-37,584
- Equity at exit
- $32,057
- IRR
- -14.5%
- Equity multiple
- 0.24×
- Total profit
- $-45,736
- Equity at exit
- $18,589
Cash invested: $60,200 (down + closing). Projections, not guarantees.
Landlord ↔ Tenant lean methodology
- Overall (STATE)
- 87 Strongly Landlord-Friendly
- State Texas
- 87 Strongly Landlord-Friendly · R+5
- County
- — inherits STATE
- City
- — inherits STATE
ZIP-level market 76048
- Home prices YoY
- -23.4%
- Rents YoY
- 1.1%
- Active inventory
- 929
- Price-to-rent
- 9.3×
Monthly cashflow live
- Estimated rent
- $1,918 high interval (Pro) →
- Mortgage (P&I)
- −$1,127
- Tax est. 1.5%
- −$269 /mo · $3,225/yr
- Insurance
- −$90
- HOA
- −$17
- Vacancy / Maint / Mgmt
- −$403
- Net cashflow
- $13
Break-even live
UW: 25.0% down · 7.5% · 30yr · 1.5% tax · 5.0% vac · 8.0% maint · 8.0% mgmt
Financing live
Cash to close
- Down payment
- $53,750
- Closing costs
- $6,450
- Reserves months
- —
- Total cash needed
- —
Loan-product check · same deal, 3 products live
Conventional
25% down · 7.5% · 30yr
- Down + closing
- —
- Monthly P&I
- —
- Monthly cashflow
- —
- DSCR
- —
- Eligible?
- —
Personal DTI + credit; lowest rate.
DSCR
20% down · 8.5% · 30yr
- Down + closing
- —
- Monthly P&I
- —
- Monthly cashflow
- —
- DSCR
- —
- Eligible?
- —
No personal income docs; deal must DSCR.
Hard money
10% down · 12.0% · 12mo
- Down + closing
- —
- Monthly P&I
- —
- Monthly cashflow
- —
- DSCR
- —
- Eligible?
- —
Short-term bridge; refi at stabilization.
Rent comps 9 comps
| Address | Beds | Baths | Sqft | Rent | $/sqft | DOM | Units | Dist |
|---|---|---|---|---|---|---|---|---|
| 2314 Creekview Dr Granbury, TX | 3.0 | 2.0 | 1294 | $1,850 | $1.43 | 24d | 1 | 0.22mi |
| 2224 Hercules Dr Granbury, TX | 3.0 | 2.0 | 1703 | $2,000 | $1.17 | 24d | 1 | 0.27mi |
| 2509 Elk Trl Granbury, TX | 3.0 | 2.0 | 1425 | $1,695 | $1.19 | 43d | 1 | 0.34mi |
| 606 Heritage Trl Granbury, TX | 3.0 | 2.0 | 1415 | $1,875 | $1.33 | 43d | 1 | 0.54mi |
| 919 Arkansas River Dr Granbury, TX | 3.0 | 2.0 | 1200 | $1,775 | $1.48 | 12d | 1 | 0.72mi |
| 408 Heritage Trl Granbury, TX | 3.0 | 2.0 | 1635 | $1,890 | $1.16 | 22d | 1 | 0.72mi |
| 3505 Brazos River Dr Granbury, TX | 3.0 | 2.0 | 1337 | $1,900 | $1.42 | 43d | 1 | 0.80mi |
| 1414 Lauren Ln Granbury, TX | 3.0 | 2.0 | 1500 | $2,100 | $1.40 | 24d | 1 | 1.14mi |
| 1113 Gifford Dr Granbury, TX | 3.0 | 2.0 | 1248 | $1,749 | $1.40 | 24d | 1 | 1.37mi |
HOA detail
- Monthly dues
- $17 · $204/yr
Listing history 20 events
-
2026-06-18days on market $215,000 Active 72 DOM
-
2026-06-17days on market $215,000 Active 71 DOM
-
2026-06-16days on market $215,000 Active 70 DOM
-
2026-06-15days on market $215,000 Active 69 DOM
-
2026-06-13days on market $215,000 Active 67 DOM
-
2026-06-09days on market $215,000 Active 63 DOM
-
2026-06-08days on market $215,000 Active 62 DOM
-
2026-06-07days on market $215,000 Active 61 DOM
-
2026-06-04days on market $215,000 Active 58 DOM
-
2026-06-03days on market $215,000 Active 57 DOM
-
2026-06-02days on market $215,000 Active 56 DOM
-
2026-06-02days on market $215,000 Active 55 DOM
-
2026-05-31days on market $215,000 Active 54 DOM
-
2026-04-07$215,000 Active 756-char remark
Show marketing remark (756 chars)
Charming 3-bedroom, 2-bath home situated on two spacious lots, offering both comfort and room to grow. Located on a quiet cul-de-sac in a peaceful neighborhood, this property backs up to a greenbelt—providing added privacy and a serene setting. The home is in immaculate condition and features a newly poured concrete driveway, adding durability and a clean, modern touch. Inside, you’ll find a well-maintained space ready for its next owner, with the oversized refrigerator included for added convenience. Additional updates include a newer outdoor HVAC unit, installed just 2 years ago, giving peace of mind for years to come. This is a fantastic opportunity for anyone seeking the perfect balance of privacy, space, and convenience.
-
2022-09-06soldstatus Closed 431-char remark
Show marketing remark (431 chars)
Great Location in Comanche Cove Subdivision country living at its best in Hood Co. Custom 3 Bedroom, 2 Bath double wide home with 2 large living areas your choice for big family room, plenty of space. Formal dining room, large kitchen area open concept. Updated with new skirting, new paint inside and outside, New stainless steel appliances including refrigerator, new flooring and carpet in bedrooms. Front porch and back deck.
-
2022-08-06status Pending 431-char remark
Show marketing remark (431 chars)
Great Location in Comanche Cove Subdivision country living at its best in Hood Co. Custom 3 Bedroom, 2 Bath double wide home with 2 large living areas your choice for big family room, plenty of space. Formal dining room, large kitchen area open concept. Updated with new skirting, new paint inside and outside, New stainless steel appliances including refrigerator, new flooring and carpet in bedrooms. Front porch and back deck.
-
2022-08-01historical Active Option Contract 431-char remark
Show marketing remark (431 chars)
Great Location in Comanche Cove Subdivision country living at its best in Hood Co. Custom 3 Bedroom, 2 Bath double wide home with 2 large living areas your choice for big family room, plenty of space. Formal dining room, large kitchen area open concept. Updated with new skirting, new paint inside and outside, New stainless steel appliances including refrigerator, new flooring and carpet in bedrooms. Front porch and back deck.
-
2022-05-12price $209,500 431-char remark
Show marketing remark (431 chars)
Great Location in Comanche Cove Subdivision country living at its best in Hood Co. Custom 3 Bedroom, 2 Bath double wide home with 2 large living areas your choice for big family room, plenty of space. Formal dining room, large kitchen area open concept. Updated with new skirting, new paint inside and outside, New stainless steel appliances including refrigerator, new flooring and carpet in bedrooms. Front porch and back deck.
-
2021-11-14$219,500 Active 431-char remark
Show marketing remark (431 chars)
Great Location in Comanche Cove Subdivision country living at its best in Hood Co. Custom 3 Bedroom, 2 Bath double wide home with 2 large living areas your choice for big family room, plenty of space. Formal dining room, large kitchen area open concept. Updated with new skirting, new paint inside and outside, New stainless steel appliances including refrigerator, new flooring and carpet in bedrooms. Front porch and back deck.
-
2021-08-23soldstatus $94,500
ⓘ Source: listings_history table (triggers on properties + properties_extension) + one-shot
backfill from property_details.listing_events for pre-trigger history.
Climate risk First Street
- Flood 1/10 Low FEMA zone X (unshaded) · 0% chance over 30 yrs
- Wildfire 6/10 Major
- Heat 7/10 Severe 7 d/yr ≥108°F today · 23 d/yr by 30 yrs out
- Wind 6/10 Major 27% chance of damaging wind over 30 yrs
- Air quality 2/10 Low 1 unhealthy d/yr today · 2 by 30 yrs out
Nearby sold comps map
Loading sold comps map…
Walkable amenities ~0.75 mi
Loading nearby amenities…
Taxation est. · year 1
- Rental income
- $23,022
- − Mortgage interest
- −$12,043
- − Property taxes
- −$3,225
- − Insurance
- −$1,075
- − Repairs & maintenance
- −$1,842
- − Management
- −$1,842
- − HOA
- −$204
- − Depreciation
- −$6,255
- Taxable loss
- −$3,463
- Est. tax savings @ 24.0%
- +$831
- After-tax cash flow
- $985/yr
For passive investors: Depreciation is non-cash, so a rental often shows a tax loss while cash-flowing — sheltering income. Rental losses are passive: they offset passive income freely, and up to $25,000/yr can offset ordinary (W-2) income if you actively participate and your MAGI is under $100k (phasing out to $0 by $150k); unused losses carry forward. On sale, claimed depreciation is recaptured at up to 25%, and gains may owe capital-gains tax (a 1031 exchange can defer both). Figures are a year-1 estimate at your 24.0% rate — not tax advice; consult a CPA.
Schools (NCES district)
- District
- Granbury ISD
- NCES district ID
- 4821390
- Math proficiency
- 46% ▬ 0.00%
- Reading proficiency
- 46% ▲ 4.00%
- Median HH income
- $55,856
- Composite
- 40.04/100
- National rank
- #3820
- State rank
- #237 of 826 in TX
Livability — Granbury
- Score
- 66/100
- State rank
- #628
- US rank
- #11998
Category grades
Schools grade is shown separately in the Schools card above.
Census & demographics
- County
- Hood County · 58,506 people
- City population
- 58,506
- Metro
- Granbury, TX
- Population (ZIP)
- 27,000
- Household income
- $70,346
- Rent vs Own
- Severe rent burden
- 612.0
Population outlook (Hood County) Hauer SSP2
- Today (2025)
- 63,502 people
- By 2030
- 67,459 · +6.2%
- By 2040
- 74,958 · +18.0%
- By 2050
- 81,922 · +29.0%
- By 2075
- 98,872 · +55.7%
- By 2100
- 107,796 · +69.8%
Race, ethnicity, and origin ACS 2023
- Neighborhood character
- Predominantly White (80%)
- Race & ethnicity
- White 80% Hispanic / Latino 14% Two or more races 11% Black 1%
- Hispanic origin (detail)
- Mexican 13%
- Common ancestry
- Italian 2% Slovak 2% Portuguese 1%
- Foreign-born
- 4% · Canada
- Languages at home
- 89% English-only · Spanish 10%
Political lean MEDSL · Hood
- 2024 margin
- Solid R (+66.0) · D 16.6% · R 82.6%
- 2008→2024 swing
- -11.9pp toward R · 2008: -54.0pp · 2024: -66.0pp
- All cycles
- 2024: R+66.0 2020: R+64.1 2016: R+66.5 2012: R+64.7 2008: R+54.0
Not yet ingested
- Civics
- —
Market trends
- HPI YoY
- ▼ -83.25%
- Current HPI
- 272.2126
- Rent YoY
- ▲ 1.10%
- Metro
- Granbury, TX
- State GDP YoY
- ▲ 3.95%
- F500 in state
- 110
Industry mix (Fortune 500 HQ in TX)
| Industry | F500 HQs | Revenue |
|---|---|---|
| Energy | 16 | $1,198B |
|
||
| Technology | 5 | $198B |
|
||
| Engineering / Construction | 4 | $72B |
|
||
| Energy Services | 3 | $60B |
|
||
| Utilities | 3 | $41B |
|
||
| Healthcare | 2 | $330B |
|
||
Price history
+127.5% since first listed7 events — show timeline
- 2026-04-07 Listed $215,000 NTREIS
- 2022-09-06 Sold (MLS) — NTREIS
- 2022-08-06 Pending — NTREIS
- 2022-08-01 Contingent — NTREIS
- 2022-05-12 Price Changed $209,500 NTREIS
- 2021-11-14 Listed $219,500 NTREIS
- 2021-08-23 Sold (Public Records) $94,500 Public Records
Property tax history
+10.3%/yrLatest (2022): $133 · +151.9% YoY. Source: county tax records.
Cash-flow waterfall
monthlySold comps — $/sqft
last 12 mo · ≤1 miLoading sold comps…