 🏗️ New Construction
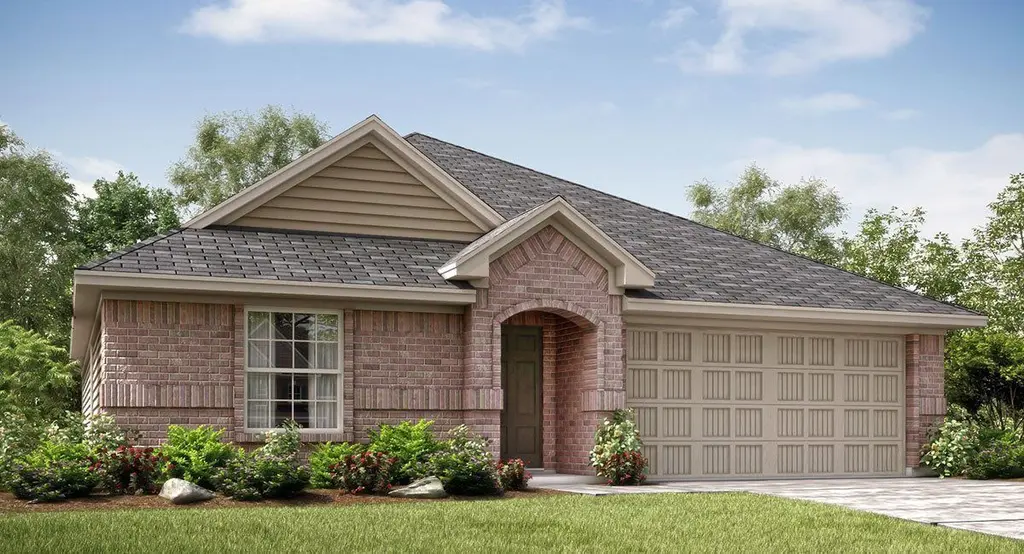
Serenade Plan · Mesquite, TX
Flood risk No data
- FEMA flood zone
- —
- Chance of flooding over 30 yrs
- —
- Est. flood insurance / yr
- —
Fire risk No data
- Est. fire insurance / yr
- —
Heat risk No data
- Hot days now (above threshold)
- —
- Hot days in 30 yrs
- —
Wind risk No data
- Chance of severe wind over 30 yrs
- —
Air-quality risk No data
- Unhealthy air days now
- —
- Unhealthy air days in 30 yrs
- —
Risk factors via First Street. Map © Google.
Why this score? — see what drove the F grade
The composite is a weighted blend of 9 inputs, each scored 0–100. Each bar is that input's sub-score; the figure is the points it added to the 100-point composite (weight × sub-score).
- ARV discount +7.5/15.0
- Cash flow +6.8/30.0
- Livability +3.5/5.0
- Schools +2.9/10.0
- Rent growth +2.5/5.0
- Condition / age +2.5/5.0
- 1% rule +1.8/10.0
- DSCR +1.0/10.0
- Appreciation +0.0/10.0
$349,999
🖨 Deal sheet (PDF) 📄 Offer letter ✓ Due diligence
Listing remarks MLS
This new single-story home features a smart layout that is perfect for growing families. There are four bedrooms, including the owner's suite with a private bathroom and walk-in closet. The open-concept main living area includes a modern kitchen, dining room and family room. A covered patio is the ideal spot for sunrise coffee and starlight suppers.
Key facts
- Covered patio
- Modern kitchen
- 2 garage spots
Tags
Neighborhood map
What this means for you Summary
Snapshot
- This is a 4-bed/2.0-bath single-family listed at $350k.
Deal economics
- At list price, monthly cash flow is $-648 ($-8k/yr) — negative.
- To cash-flow at today's rent, offer at most $324k (7.4% below list).
- To meet the 1% rule (rent ≥ 1% of price), the offer needs to be $283k (19.0% below list).
- Recommended offer: $283k (19.0% below list) — sets the bar for 1% rule.
Location & tenants
- Location reads 70/100 on livability (#358 in TX) — a middle-class / working-renter tenant base. Strengths: cost of living A+, housing A+, health & safety A-; Watch: crime F, commute F.
- Mesquite ISD (suburban): math 35% / reading 32% proficiency, ranked #536 of 826 in TX (top 65%) — families likely to look elsewhere, expect single-tenant / working-renter base with shorter leases; 63% free/reduced lunch — lower-income household profile, screen leases tightly.
- Zoned schools: Gentry El (math 34% / reading 40%, grade F, #1,769 of 4,322 statewide, top 44%, 637 students, 79% FRL); Berry Middle (math 45% / reading 41%, grade D-, #540 of 1,662 statewide, top 33%, 579 students, 76% FRL); Horn H S (math 41% / reading 36%, grade F, #866 of 1,632 statewide, top 54%, 3,029 students, 74% FRL).
- Market conditions: Rents flat; 598 active listings in the ZIP; 32 comparable units currently listed for rent nearby; rentals at typical pace (median 26d on market — plan ~3-4 weeks tenant-placement turnaround); high-income renter base; 12,577 units permitted in Dallas County in 2024 (6,829 in 5+ unit buildings).
- This rent runs 31% of the median local income ($111k/yr) — at the standard rent-burdened threshold; future hikes will face affordability resistance.
Forward outlook
- Local home prices are declining (-3.0%/yr); year-one equity from $3k of loan paydown is wiped out by about $13k of value loss. Plan a longer hold.
- Dallas County population projected at +35% by 2050 — long-run rental-demand tailwind backs the buy-and-hold thesis.
Negotiation context
- It's been on market 198 days — a 12% lower offer ($308k) is reasonable based on typical stale-listing flexibility.
Questions for the listing agent
- What do current leases actually rent for vs. the listed asking? Can we see a recent rent roll and the last 12 months of T-12 income?
- It's been on market 198 days. Have you received any prior offers? Is the seller open to a 19% concession, seller financing, or rate buy-down credit?
- Why hasn't it sold? Are there any deal-killer items the seller is aware of (foundation, flood, title, zoning, code violations)?
- Is there a deadline driving the sale (1031 exchange, divorce, estate, relocation)? That informs how much negotiation room exists.
- Crime grade is F in this area — have there been break-ins, vandalism, or insurance claims at this property in the last 3 years? What carrier currently insures it and at what premium?
- The area grade is low — what's the realistic commute time and amenity access for the typical tenant pool here? Any planned neighborhood developments (good or bad) we should know about?
- What's the average days-on-market for RENTAL listings here right now (not sales)? A rising rental-DOM trend means longer vacancies and softer asking-rent achievability than the comps imply.
- What's the recent tenant-quality profile in this submarket — average credit score on applications, eviction rate, late-payment / NSF rate, and stable-employment percentage? A property-management company in the area should have these aggregated.
- How much new for-sale + rental construction is in the pipeline within 1–3 miles? Heavy new supply typically softens prices + rents 12–24 months out; constrained supply supports both.
Investment metrics
- 1% rule
- 0.68% ✗
- Cap rate
- 4.43%
- Cash-on-cash
- -6.65%
- DSCR
- 0.70
- GRM
- 12.3
CMA / ARV
- ARV (median comp)
- $417,650
- List price
- $349,999
- Delta
- -16.20%
- Verdict
- UNDERPRICED
- Comps
- 20 within 1.0 mi
Show comp detail 12 sales within ~0.75 mi
| Address | Dist | Beds/Ba | Sqft | Sold | Price | $/sf | Match |
|---|---|---|---|---|---|---|---|
| 2105 Jade Forest Ln | 0.40mi | 3/2.0 (-1) | 1,821 (-2%) | 6mo | $409,990 | $225 | 68 |
| 1901 Kit Fox Run | 0.48mi | 4/3.0 | 1,945 (+4%) | 2mo | $360,000 | $185 | 65 |
| 1913 Hazel Lily | 0.35mi | 3/2.0 (-1) | 1,736 (-7%) | 4mo | $397,620 | $229 | 64 |
| 2001 Hazel Lily | 0.36mi | 3/2.0 (-1) | 1,752 (-6%) | 9mo | $432,650 | $247 | 61 |
| 2021 Jade Frst | 0.37mi | 4/3.0 | 2,001 (+8%) | 7mo | $399,999 | $200 | 60 |
| 2105 Hazel Lily Run | 0.39mi | 3/2.0 (-1) | 1,736 (-7%) | 9mo | $389,715 | $224 | 58 |
| 2404 Tarrango Trl | 0.73mi | 3/2.0 (-1) | 1,898 (+2%) | 1mo | $364,990 | $192 | 57 |
| 1821 Osage | 0.74mi | 4/2.0 | 1,915 (+3%) | 7mo | $362,662 | $189 | 55 |
| 2021 Cantura Dr | 0.68mi | 3/3.0 (-1) | 1,815 (-2%) | 3mo | $294,900 | $162 | 53 |
| 2417 Johnson Dr | 0.69mi | 4/2.0 | 1,982 (+6%) | 7mo | $349,900 | $177 | 52 |
| 1833 Cedarbriar Dr | 0.62mi | 3/2.0 (-1) | 2,011 (+8%) | 6mo | $305,000 | $152 | 48 |
| 2017 Paradise Valley Dr | 0.74mi | 3/2.5 (-1) | 1,699 (-9%) | 1mo | $339,834 | $200 | 43 |
Match score weights: distance 35% · size 25% · config 20% · recency 20%. Top-matched comps best support the ARV.
Projected returns pro-forma
-3.0% appreciation · 0.07% rent growth · sell at horizon
- IRR
- -31.1%
- Equity multiple
- -0.00×
- Total profit
- $-116,999
- Equity at exit
- $62,273
- IRR
- -53.9%
- Equity multiple
- -0.59×
- Total profit
- $-186,230
- Equity at exit
- $36,111
Cash invested: $116,942 (down + closing). Projections, not guarantees.
Landlord ↔ Tenant lean methodology
- Overall (STATE)
- 87 Strongly Landlord-Friendly
- State Texas
- 87 Strongly Landlord-Friendly · R+5
- County
- — inherits STATE
- City
- — inherits STATE
ZIP-level market 75181
- Home prices YoY
- -9.4%
- Rents YoY
- 0.1%
- Active inventory
- 598
- Price-to-rent
- 10.3×
Monthly cashflow live
- Estimated rent
- $2,834 high interval (Pro) →
- Mortgage (P&I)
- −$2,190
- Tax est. 1.5%
- −$522 /mo · $6,265/yr
- Insurance
- −$174
- HOA
- −$0
- Vacancy / Maint / Mgmt
- −$595
- Net cashflow
- $-648
Break-even live
Sensitivity live
| Price | -10% $-359 | -5% $-503 | +0% $-648 | +5% $-792 | +10% $-936 |
|---|---|---|---|---|---|
| Rent | -10% $-871 | -5% $-760 | +0% $-648 | +5% $-536 | +10% $-424 |
| Rate | -1.0pp $-437 | -0.5pp $-541 | base $-648 | +0.5pp $-756 | +1.0pp $-866 |
UW: 25.0% down · 7.5% · 30yr · 1.5% tax · 5.0% vac · 8.0% maint · 8.0% mgmt
Financing live
Cash to close
- Down payment
- $104,412
- Closing costs
- $12,529
- Reserves months
- —
- Total cash needed
- —
Loan-product check · same deal, 3 products live
Conventional
25% down · 7.5% · 30yr
- Down + closing
- —
- Monthly P&I
- —
- Monthly cashflow
- —
- DSCR
- —
- Eligible?
- —
Personal DTI + credit; lowest rate.
DSCR
20% down · 8.5% · 30yr
- Down + closing
- —
- Monthly P&I
- —
- Monthly cashflow
- —
- DSCR
- —
- Eligible?
- —
No personal income docs; deal must DSCR.
Hard money
10% down · 12.0% · 12mo
- Down + closing
- —
- Monthly P&I
- —
- Monthly cashflow
- —
- DSCR
- —
- Eligible?
- —
Short-term bridge; refi at stabilization.
Rent comps 32 comps
| Address | Beds | Baths | Sqft | Rent | $/sqft | DOM | Units | Dist |
|---|---|---|---|---|---|---|---|---|
| 2004 Poppy Way Mesquite, TX | 3.0 | 2.0 | 1572 | $2,700 | $1.72 | 45d | 1 | 0.32mi |
| 2201 Cantura Dr Mesquite, TX | 4.0 | 2.0 | 2432 | $2,700 | $1.11 | 0d | 1 | 0.59mi |
| 1817 Cedarbriar Dr Mesquite, TX | 5.0 | 3.5 | 2538 | $3,495 | $1.38 | 45d | 1 | 0.61mi |
| 2439 Whitetail Dr Mesquite, TX | 4.0 | 2.5 | 2484 | $2,800 | $1.13 | 26d | 1 | 0.72mi |
| 1809 Osage Trl Mesquite, TX | 4.0 | 2.0 | 2022 | $2,599 | $1.29 | 19d | 1 | 0.77mi |
| 2600 Waterloo Ln Mesquite, TX | 3.0 | 2.0 | 1460 | $1,900 | $1.30 | 45d | 1 | 0.82mi |
| 1729 Hazer Ln Mesquite, TX | 3.0 | 2.0 | 1498 | $2,400 | $1.60 | 22d | 1 | 0.83mi |
| 732 Creekview Ct Mesquite, TX | 5.0 | 3.0 | 2313 | $3,495 | $1.51 | 45d | 1 | 0.91mi |
| 815 Valleycreek Rd Mesquite, TX | 3.0 | 2.0 | 1788 | $2,500 | $1.40 | 45d | 1 | 1.02mi |
| 1332 Nimitz Way Mesquite, TX | 4.0 | 2.0 | 2109 | $2,280 | $1.08 | 22d | 1 | 1.02mi |
| 1309 Dawson Way Mesquite, TX | 4.0 | 2.0 | 1952 | $2,222 | $1.14 | 9d | 1 | 1.05mi |
| 1308 Dawson Way Mesquite, TX | 4.0 | 2.5 | 2476 | $3,573 | $1.44 | 26d | 1 | 1.08mi |
| 2749 Ingram Cir Mesquite, TX | 3.0 | 2.0 | 1791 | $2,119 | $1.18 | 4d | 1 | 1.24mi |
| 2637 Austin Dr Mesquite, TX | 4.0 | 2.5 | 2291 | $3,350 | $1.46 | 45d | 1 | 1.28mi |
| 2621 Ash Crk Mesquite, TX | 3.0 | 2.0 | 1843 | $2,299 | $1.25 | 45d | 1 | 1.30mi |
| 2302 Highbank Dr Mesquite, TX | 3.0 | 2.0 | 1783 | $2,145 | $1.20 | 45d | 1 | 1.33mi |
| 716 Elm Falls Pl Mesquite, TX | 3.0 | 2.0 | 2444 | $2,300 | $0.94 | 22d | 1 | 1.35mi |
| 1104 Ashland Dr Mesquite, TX | 3.0 | 1.0 | 1250 | $1,625 | $1.30 | 9d | 1 | 1.35mi |
| 1626 Rancho Dr Mesquite, TX | 4.0 | 2.0 | 2562 | $2,419 | $0.94 | 26d | 1 | 1.38mi |
| 2725 Stillwater Dr Mesquite, TX | 5.0 | 2.5 | 2228 | $3,199 | $1.44 | 0d | 1 | 1.41mi |
| 2524 Park Valley Dr Mesquite, TX | 3.0 | 2.0 | 1360 | $2,150 | $1.58 | 0d | 1 | 1.41mi |
| 2829 Kerrville Dr Mesquite, TX | 4.0 | 2.5 | 2349 | $2,700 | $1.15 | 6d | 1 | 1.41mi |
| 2805 Cameron Way Mesquite, TX | 3.0 | 2.0 | 1660 | $2,150 | $1.30 | 14d | 1 | 1.43mi |
| 2724 Windswept Ln Mesquite, TX | 3.0 | 2.0 | 1402 | $2,300 | $1.64 | 26d | 1 | 1.44mi |
| 2213 Creek Royal Dr Mesquite, TX | 3.0 | 2.0 | 1505 | $1,850 | $1.23 | 45d | 1 | 1.45mi |
| 2213 Creek Royal Dr Mesquite, TX | 3.0 | 2.0 | 1505 | $1,850 | $1.23 | 23d | 1 | 1.45mi |
| 1217 Buckeye Dr Mesquite, TX | 3.0 | 2.0 | 1735 | $1,995 | $1.15 | 23d | 1 | 1.46mi |
| 1217 Buckeye Dr Mesquite, TX | 3.0 | 2.0 | 1735 | $1,995 | $1.15 | 45d | 1 | 1.46mi |
| 2812 Clearmeadow Dr Mesquite, TX | 4.0 | 2.0 | 1837 | $2,800 | $1.52 | 0d | 1 | 1.48mi |
| 2314 Stillwater Dr Mesquite, TX | 4.0 | 2.0 | 1995 | $2,600 | $1.30 | 0d | 1 | 1.48mi |
| 2314 Stillwater Dr Mesquite, TX | 4.0 | 2.0 | 1995 | $2,600 | $1.30 | 26d | 1 | 1.48mi |
| 2208 Browning Dr Mesquite, TX | 3.0 | 2.0 | 1406 | $1,955 | $1.39 | 45d | 1 | 1.49mi |
Listing history 16 events
-
2026-06-21days on market $349,999 Active 198 DOM
-
2026-06-18days on market $349,999 Active 195 DOM
-
2026-06-17days on market $349,999 Active 194 DOM
-
2026-06-16days on market $349,999 Active 193 DOM
-
2026-06-15days on market $349,999 Active 192 DOM
-
2026-06-13days on market $349,999 Active 190 DOM
-
2026-06-13days on market $349,999 Active 189 DOM
-
2026-06-09days on market $349,999 Active 186 DOM
-
2026-06-08days on market $349,999 Active 185 DOM
-
2026-06-07days on market $349,999 Active 184 DOM
-
2026-06-04days on market $349,999 Active 181 DOM
-
2026-06-03days on market $349,999 Active 180 DOM
-
2026-06-02days on market $349,999 Active 179 DOM
-
2026-06-01days on market $349,999 Active 178 DOM
-
2026-05-31days on market $349,999 Active 177 DOM
-
2025-12-05$349,999 Active 351-char remark
Show marketing remark (351 chars)
This new single-story home features a smart layout that is perfect for growing families. There are four bedrooms, including the owner's suite with a private bathroom and walk-in closet. The open-concept main living area includes a modern kitchen, dining room and family room. A covered patio is the ideal spot for sunrise coffee and starlight suppers.
ⓘ Source: listings_history table (triggers on properties + properties_extension) + one-shot
backfill from property_details.listing_events for pre-trigger history.
Nearby sold comps map
Loading sold comps map…
Walkable amenities ~0.75 mi
Loading nearby amenities…
Taxation est. · year 1
- Rental income
- $34,005
- − Mortgage interest
- −$23,395
- − Property taxes
- −$6,265
- − Insurance
- −$2,088
- − Repairs & maintenance
- −$2,720
- − Management
- −$2,720
- − Depreciation
- −$12,150
- Taxable loss
- −$15,334
- Est. tax savings @ 24.0%
- +$3,680
- After-tax cash flow
- $-4,091/yr
For passive investors: Depreciation is non-cash, so a rental often shows a tax loss while cash-flowing — sheltering income. Rental losses are passive: they offset passive income freely, and up to $25,000/yr can offset ordinary (W-2) income if you actively participate and your MAGI is under $100k (phasing out to $0 by $150k); unused losses carry forward. On sale, claimed depreciation is recaptured at up to 25%, and gains may owe capital-gains tax (a 1031 exchange can defer both). Figures are a year-1 estimate at your 24.0% rate — not tax advice; consult a CPA.
Schools (NCES district)
- District
- Mesquite ISD
- NCES district ID
- 4830390
- Math proficiency
- 35% ▼ -11.00%
- Reading proficiency
- 32% ▼ -7.00%
- Median HH income
- $49,372
- Composite
- 29.06/100
- National rank
- #6606
- State rank
- #536 of 826 in TX
Livability — Mesquite
- Score
- 70/100
- State rank
- #358
- US rank
- #7743
Category grades
Schools grade is shown separately in the Schools card above.
Census & demographics
- Census place
- Mesquite, TX
- County
- Dallas County · 2,612,404 people
- City population
- 150,788
- Metro
- Dallas-Fort Worth-Arlington, TX
- Population (ZIP)
- 29,788
- Household income
- $111,052
- Rent vs Own
- Severe rent burden
- 857.0
Population outlook (Dallas County) Hauer SSP2
- Today (2025)
- 2,979,839 people
- By 2030
- 3,191,823 · +7.1%
- By 2040
- 3,619,611 · +21.5%
- By 2050
- 4,026,915 · +35.1%
- By 2075
- 4,957,073 · +66.4%
- By 2100
- 5,508,725 · +84.9%
Race, ethnicity, and origin ACS 2023
- Neighborhood character
- Highly diverse neighborhood (Simpson 0.71)
- Race & ethnicity
- Black 39% Hispanic / Latino 32% Two or more races 21% White 16% Asian 5% Native American 1%
- Hispanic origin (detail)
- Mexican 27% Puerto Rican 1%
- Common ancestry
- Slovak 2% Italian 1%
- Foreign-born
- 22% · Canada, Vietnam
- Languages at home
- 64% English-only · Spanish 27% Tagalog/Filipino 3% Other Asian/Pacific 1%
Political lean MEDSL · Dallas
- 2024 margin
- Strong D (+22.2) · D 60.2% · R 38.0% · Other 1.8%
- 2008→2024 swing
- +6.9pp toward D · 2008: 15.3pp · 2024: 22.2pp
- All cycles
- 2024: D+22.2 2020: D+31.6 2016: D+26.2 2012: D+15.4 2008: D+15.3
Not yet ingested
- Civics
- —
Market trends
- HPI YoY
- ▼ -26.63%
- Current HPI
- 257.0959
- Rent YoY
- ▲ 0.07%
- Metro
- Dallas-Fort Worth-Arlington, TX
- State GDP YoY
- ▲ 3.95%
- F500 in state
- 110
Industry mix (Fortune 500 HQ in TX)
| Industry | F500 HQs | Revenue |
|---|---|---|
| Energy | 16 | $1,198B |
|
||
| Technology | 5 | $198B |
|
||
| Engineering / Construction | 4 | $72B |
|
||
| Energy Services | 3 | $60B |
|
||
| Utilities | 3 | $41B |
|
||
| Healthcare | 2 | $330B |
|
||
Price history
1 event — show timeline
- 2025-12-05 Listed $349,999 Zillow
Cash-flow waterfall
monthlySold comps — $/sqft
last 12 mo · ≤1 miLoading sold comps…