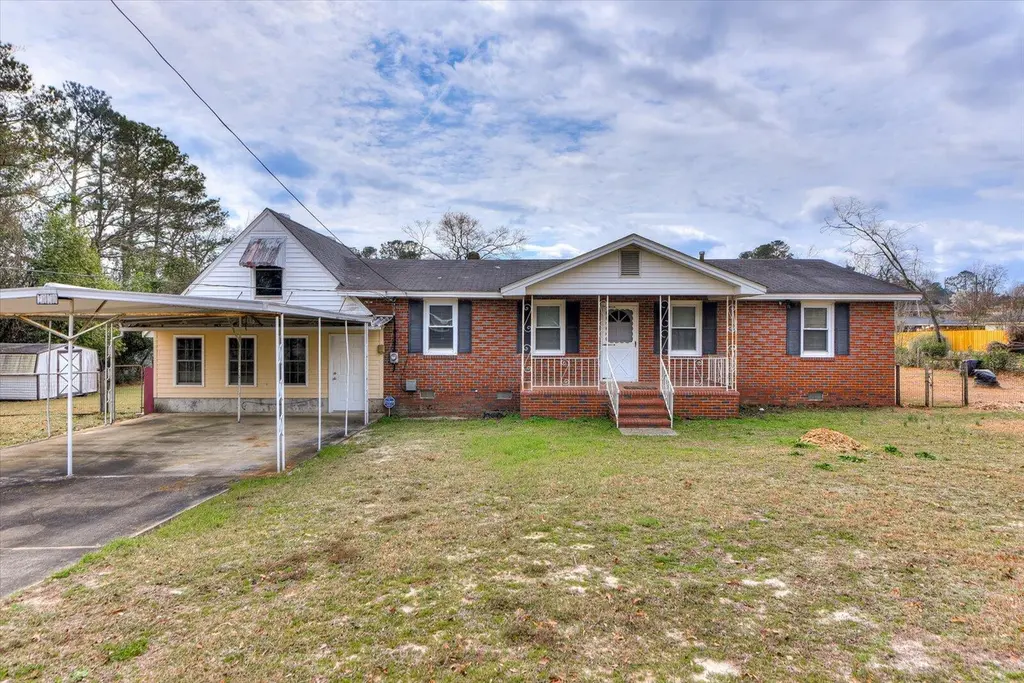
2150 Cadden Rd · Augusta-Richmond County consolidated government (balance), GA
Flood risk 1/10 · Minimal
- FEMA flood zone
- X (unshaded)
- Chance of flooding over 30 yrs
- 0.0%
- Est. flood insurance / yr
- $507 – $1,088
Fire risk 4/10 · Minor
- Est. fire insurance / yr
- $963 – $1,789
Heat risk 8/10 · Major
- Hot days now (above 107°F)
- 7 days/yr
- Hot days in 30 yrs
- 17 days/yr
Wind risk 6/10 · Moderate
- Chance of severe wind over 30 yrs
- 67.0%
Air-quality risk 3/10 · Minor
- Unhealthy air days now
- 3 days/yr
- Unhealthy air days in 30 yrs
- 3 days/yr
Risk factors via First Street. Map © Google.
Why this score? — see what drove the D grade
The composite is a weighted blend of 9 inputs, each scored 0–100. Each bar is that input's sub-score; the figure is the points it added to the 100-point composite (weight × sub-score).
- ARV discount +13.9/15.0
- Cash flow +13.6/30.0
- DSCR +4.1/10.0
- 1% rule +3.6/10.0
- Livability +2.5/5.0
- Condition / age +2.5/5.0
- Rent growth +2.4/5.0
- Schools +1.3/10.0
- Appreciation +0.0/10.0
$175,000
🖨 Deal sheet 📄 Offer letter ✓ Due diligence
Listing remarks
'' Welcome to 2150 Cadden Road in Augusta, GA--a charming 3-bedroom, 3-bathroom all-brick home offering 2,275 sq. ft. of living space on a generous half-acre lot! Step inside to find beautiful hardwood floors, stained wood cabinetry, and a spacious kitchen complete with stainless steel appliances, a kitchen island, and ample storage--perfect for meal prep and entertaining. The main-level owner's suite provides comfort and convenience, while the living and dining areas offer plenty of room to gather. Outside, enjoy the covered porch and a large yard with room to roam. Need storage or workspace? This home delivers with outbuildings, a basement workshop, and even an unfinished attic for exp
Key facts
- Covered porch
- Large yard
- Kitchen island
Tags
Neighborhood map
What this means for you Summary
Snapshot
- This is a 2-bed/2.0-bath single-family listed at $175k.
Deal economics
- At list price, monthly cash flow is $9 ($105/yr) — positive.
- The deal already cash-flows at list — no discount required.
- To meet the 1% rule (rent ≥ 1% of price), the offer needs to be $150k (14.4% below list).
- Recommended offer: $150k (14.4% below list) — sets the bar for 1% rule.
- Cap rate 6.4% vs local median 5.3% in Augusta-Richmond County consolidated government (balance) — meaningfully above typical; check what's discounted (condition, days-on-market, listing class) to confirm the premium yield is real.
Location & tenants
- Location reads: area grade D — affects rentability + tenant quality, not the cash-flow math above.
- Richmond County (urban): math 12% / reading 20% proficiency, ranked #154 of 174 in GA (top 88%) — low school quality limits family demand, transient renter base, plan for 1-2y turnover; 72% free/reduced lunch — lower-income household profile, screen leases tightly.
- Market conditions: Rents soft (-0.2%/yr); 364 active listings in the ZIP; 4 comparable units currently listed for rent nearby; rentals lingering (median 44d on market — plan ~5-8 weeks vacancy on turnover, expect pricing pressure); 50% of comp listings sitting > 30 days — soft ceiling on asking rent; 561 units permitted in Richmond County in 2024 (0 in 5+ unit buildings).
- This rent runs 39% of the median local income ($46k/yr) — at the standard rent-burdened threshold; future hikes will face affordability resistance.
Forward outlook
- Local home prices are declining (-3.0%/yr); year-one equity from $1k of loan paydown is wiped out by about $5k of value loss. Plan a longer hold.
- Richmond County population projected to shrink 5% by 2050 — rents likely to lag national; underwrite the cash flow, not the appreciation.
Negotiation context
- It's been on market 38 days — a 3% lower offer ($170k) is reasonable based on typical stale-listing flexibility.
- 14 sale attempts since 3y ago with the ask held roughly flat each time — persistent listings suggest the price (not the market) is what's stuck; bring a comps-based counter.
Risks & watch-outs
- Watch-outs: built in 1953 — expect roof / HVAC / electrical / plumbing capex.
- Climate carrying-cost: major wind risk, 67% chance of damaging wind over 30y; extreme-heat days projected 7→17/yr by 2055 (HVAC capex compounding) — expect insurance premiums to compound above CPI over the hold.
Questions for the listing agent
- It's been on market 38 days. Have you received any prior offers? Is the seller open to a 14% concession, seller financing, or rate buy-down credit?
- Built in 1953 — when were the roof, HVAC, electrical panel, plumbing, and water heater last replaced?
- Is there a deadline driving the sale (1031 exchange, divorce, estate, relocation)? That informs how much negotiation room exists.
- The area grade is low — what's the realistic commute time and amenity access for the typical tenant pool here? Any planned neighborhood developments (good or bad) we should know about?
- What's the average days-on-market for RENTAL listings here right now (not sales)? A rising rental-DOM trend means longer vacancies and softer asking-rent achievability than the comps imply.
- What's the recent tenant-quality profile in this submarket — average credit score on applications, eviction rate, late-payment / NSF rate, and stable-employment percentage? A property-management company in the area should have these aggregated.
- How much new for-sale + rental construction is in the pipeline within 1–3 miles? Heavy new supply typically softens prices + rents 12–24 months out; constrained supply supports both.
Investment metrics
- 1% rule
- 0.86% ✗
- Cap rate
- 6.35%
- Cash-on-cash
- 0.21%
- DSCR
- 1.01
- GRM
- 9.7
CMA / ARV
- ARV (median comp)
- $204,132
- List price
- $175,000
- Delta
- -14.27%
- Verdict
- UNDERPRICED
- Comps
- 20 within 1.0 mi
Show comp detail 12 sales within ~0.75 mi
| Address | Dist | Beds/Ba | Sqft | Sold | Price | $/sf | Match |
|---|---|---|---|---|---|---|---|
| 2112 Balfour St | 0.39mi | 3/2.0 (+1) | 2,090 (+1%) | 8mo | $105,000 | $50 | 68 |
| 2224 Cadden Rd | 0.28mi | 3/2.0 (+1) | 1,852 (-11%) | 10mo | $210,000 | $113 | 56 |
| 2206 Silverdale Rd | 0.17mi | 3/3.0 (+1) | 1,912 (-8%) | 18mo | $200,000 | $105 | 55 |
| 3437 Mount Vernon Dr | 0.45mi | 3/2.0 (+1) | 1,868 (-10%) | 5mo | $245,000 | $131 | 53 |
| 3033 Richmond Hill Rd | 0.58mi | 3/2.0 (+1) | 2,216 (+7%) | 7mo | $116,500 | $53 | 51 |
| 2310 Mura Dr | 0.56mi | 3/2.0 (+1) | 1,890 (-9%) | 8mo | $210,000 | $111 | 48 |
| 2304 Lebaum Ct | 0.50mi | 3/2.0 (+1) | 1,765 (-15%) | 4mo | $137,000 | $78 | 44 |
| 2208 Buckingham Dr | 0.73mi | 3/2.0 (+1) | 2,240 (+8%) | 7mo | $188,000 | $84 | 42 |
| 3404 Wentworth Pl | 0.64mi | 3/3.0 (+1) | 1,879 (-9%) | 6mo | $261,000 | $139 | 41 |
| 3513 Rushing Rd | 0.59mi | 3/2.0 (+1) | 1,910 (-8%) | 18mo | $234,900 | $123 | 39 |
| 3413 Sutton Pl | 0.68mi | 3/2.0 (+1) | 1,869 (-10%) | 12mo | $262,000 | $140 | 37 |
| 3524 Mount Vernon Drive Dr | 0.64mi | 3/2.0 (+1) | 1,778 (-14%) | 15mo | $212,000 | $119 | 29 |
Match score weights: distance 35% · size 25% · config 20% · recency 20%. Top-matched comps best support the ARV.
Projected returns pro-forma
-3.0% appreciation · 0.0% rent growth · sell at horizon
- IRR
- -19.3%
- Equity multiple
- 0.34×
- Total profit
- $-32,190
- Equity at exit
- $26,093
- IRR
- -19.6%
- Equity multiple
- 0.10×
- Total profit
- $-44,276
- Equity at exit
- $15,131
Cash invested: $49,000 (down + closing). Projections, not guarantees.
Landlord ↔ Tenant lean methodology
- Overall (STATE)
- 90 Strongly Landlord-Friendly
- State Georgia
- 90 Strongly Landlord-Friendly · R+3
- County
- — inherits STATE
- City
- — inherits STATE
ZIP-level market 30906
- Home prices YoY
- -21.6%
- Rents YoY
- -0.2%
- Active inventory
- 364
- Price-to-rent
- 9.7×
Monthly cashflow live
- Estimated rent
- $1,498 medium interval (Pro) →
- Mortgage (P&I)
- −$918
- Tax from tax record
- −$184 /mo · $2,210/yr
- Insurance
- −$73
- HOA
- −$0
- Vacancy / Maint / Mgmt
- −$315
- Net cashflow
- $9
Break-even live
UW: 25.0% down · 7.5% · 30yr · 1.5% tax · 5.0% vac · 8.0% maint · 8.0% mgmt
Financing live
Cash to close
- Down payment
- $43,750
- Closing costs
- $5,250
- Reserves months
- —
- Total cash needed
- —
Loan-product check · same deal, 3 products live
Conventional
25% down · 7.5% · 30yr
- Down + closing
- —
- Monthly P&I
- —
- Monthly cashflow
- —
- DSCR
- —
- Eligible?
- —
Personal DTI + credit; lowest rate.
DSCR
20% down · 8.5% · 30yr
- Down + closing
- —
- Monthly P&I
- —
- Monthly cashflow
- —
- DSCR
- —
- Eligible?
- —
No personal income docs; deal must DSCR.
Hard money
10% down · 12.0% · 12mo
- Down + closing
- —
- Monthly P&I
- —
- Monthly cashflow
- —
- DSCR
- —
- Eligible?
- —
Short-term bridge; refi at stabilization.
Rent comps 4 comps
| Address | Beds | Baths | Sqft | Rent | $/sqft | DOM | Units | Dist |
|---|---|---|---|---|---|---|---|---|
| 2105 Hobson Ct Augusta, GA | 3.0 | 2.0 | 1700 | $1,375 | $0.81 | 14d | 1 | 0.61mi |
| 1017 Caddenwoods Dr Augusta, GA | 3.0 | 2.0 | 1496 | $1,430 | $0.96 | 44d | 1 | 0.85mi |
| 2115 Oak Leaf Way Augusta, GA | 3.0 | 2.0 | 1535 | $1,850 | $1.21 | 44d | 1 | 1.31mi |
| 2115 Oak Leaf Way Augusta, GA | 3.0 | 2.0 | 1535 | $1,850 | $1.21 | 23d | 1 | 1.31mi |
Listing history 50 events
-
2026-06-18days on market $175,000 Active 38 DOM
-
2026-06-17days on market $175,000 Active 37 DOM
-
2026-06-16days on market $175,000 Active 36 DOM
-
2026-06-15days on market $175,000 Active 35 DOM
-
2026-06-14days on market $175,000 Active 33 DOM
-
2026-06-10days on market $175,000 Active 30 DOM
-
2026-06-09days on market $175,000 Active 29 DOM
-
2026-06-09remarks 699-char remark
-
2026-06-09days on market $175,000 Active 28 DOM
-
2026-06-08days on market $175,000 Active 455 DOM
-
2026-06-07days on market $175,000 Active 454 DOM
-
2026-06-03days on market $175,000 Active 450 DOM
-
2026-06-02days on market $175,000 Active 449 DOM
-
2026-06-01days on market $175,000 Active 448 DOM
-
2026-05-31days on market $175,000 Active 447 DOM
-
2026-05-30days on market $175,000 Active 446 DOM
-
2026-05-11historical
-
2026-05-02status Active
-
2026-04-23status Pending
-
2026-04-23historical
-
2026-03-26status Active
-
2026-03-26historical
-
2026-03-11status Active
-
2026-03-11price $175,000
-
2026-03-11status Active
-
2026-03-11price $175,000
-
2026-02-21status Pending
-
2026-02-20historical
-
2026-02-11historical Active Under Contract
-
2026-01-29status Pending
-
2026-01-12price $199,900
-
2026-01-09price $199,900
-
2025-12-09price $205,000
-
2025-12-08status Active
-
2025-12-05historical
-
2025-11-24price $217,700
-
2025-04-04price $222,700
-
2025-03-06$205,000 Active
-
2025-03-06$222,900 Active
-
2025-03-06$175,000 Active
-
2024-10-11historical
-
2024-10-11historical
-
2024-10-07price $204,900
-
2024-06-07$204,000
-
2024-06-07$204,000
-
2023-11-22historical
-
2023-11-22historical
-
2023-11-16$229,500
-
2023-11-16$229,500
-
2023-11-05historical
ⓘ Source: listings_history table (triggers on properties + properties_extension) + one-shot
backfill from property_details.listing_events for pre-trigger history.
Tax reassessment forecast GA · Resets to sale price
- Current annual tax
- $2,210 · $184/mo
- Projected year-2 tax
- $2,210 · $184/mo
- Expected delta
- $0/yr ($0/mo · 0.0%)
ⓘ Screening estimate from a state-policy table — verify with the county assessor before closing.
Climate risk First Street
- Flood 1/10 Low FEMA zone X (unshaded) · 0% chance over 30 yrs
- Wildfire 4/10 Moderate
- Heat 8/10 Severe 7 d/yr ≥107°F today · 17 d/yr by 30 yrs out
- Wind 6/10 Major 67% chance of damaging wind over 30 yrs
- Air quality 3/10 Moderate 3 unhealthy d/yr today · 3 by 30 yrs out
Nearby sold comps map
Loading sold comps map…
Walkable amenities ~0.75 mi
Loading nearby amenities…
Taxation est. · year 1
- Rental income
- $17,977
- − Mortgage interest
- −$9,803
- − Property taxes
- −$2,210
- − Insurance
- −$875
- − Repairs & maintenance
- −$1,438
- − Management
- −$1,438
- − Depreciation
- −$5,091
- Taxable loss
- −$2,877
- Est. tax savings @ 24.0%
- +$691
- After-tax cash flow
- $795/yr
For passive investors: Depreciation is non-cash, so a rental often shows a tax loss while cash-flowing — sheltering income. Rental losses are passive: they offset passive income freely, and up to $25,000/yr can offset ordinary (W-2) income if you actively participate and your MAGI is under $100k (phasing out to $0 by $150k); unused losses carry forward. On sale, claimed depreciation is recaptured at up to 25%, and gains may owe capital-gains tax (a 1031 exchange can defer both). Figures are a year-1 estimate at your 24.0% rate — not tax advice; consult a CPA.
Schools (NCES district)
- District
- Richmond County
- NCES district ID
- 1304380
- Math proficiency
- 12% ▼ -9.00%
- Reading proficiency
- 20% ▼ -6.00%
- Median HH income
- $38,069
- Composite
- 13.43/100
- National rank
- #9524
- State rank
- #154 of 174 in GA
Livability — Augusta-Richmond County consolidated government (balance)
No livability data for this city. (Only ~50 U.S. cities are tracked.)
Census & demographics
- Census place
- Augusta-Richmond County consolidated government (balance), GA
- County
- Richmond County · 190,917 people
- City population
- 154,035
- Metro
- Augusta-Richmond County, GA-SC
- Population (ZIP)
- 60,423
- Household income
- $45,999
- Rent vs Own
- Severe rent burden
- 3363.0
Population outlook (Richmond County) Hauer SSP2
- Today (2025)
- 200,753 people
- By 2030
- 200,232 · -0.3%
- By 2040
- 196,813 · -2.0%
- By 2050
- 190,347 · -5.2%
- By 2075
- 172,496 · -14.1%
- By 2100
- 146,284 · -27.1%
Race, ethnicity, and origin ACS 2023
- Neighborhood character
- Majority Black (64%)
- Race & ethnicity
- Black 64% White 27% Two or more races 5% Hispanic / Latino 5%
- Common ancestry
- Lithuanian 1%
- Foreign-born
- 2% · Canada
- Languages at home
- 95% English-only · Spanish 3% German/W. Germanic 1%
Political lean MEDSL · Richmond
- 2024 margin
- Solid D (+36.1) · D 67.8% · R 31.7%
- 2008→2024 swing
- +4.3pp toward D · 2008: 31.8pp · 2024: 36.1pp
- All cycles
- 2024: D+36.1 2020: D+37.2 2016: D+32.4 2012: D+33.8 2008: D+31.8
Not yet ingested
- Civics
- —
Market trends
- HPI YoY
- ▼ -58.99%
- Current HPI
- 213.5733
- Rent YoY
- ▼ -0.25%
- Metro
- Augusta-Richmond County, GA-SC
- State GDP YoY
- ▲ 2.66%
- F500 in state
- 28
Industry mix (Fortune 500 HQ in GA)
| Industry | F500 HQs | Revenue |
|---|---|---|
| Paper / Packaging | 2 | $29B |
|
||
| Retail | 1 | $160B |
|
||
| Transportation / Logistics | 1 | $91B |
|
||
| Airlines | 1 | $62B |
|
||
| Consumer Goods | 1 | $47B |
|
||
| Utilities | 1 | $25B |
|
||
Price history
-17.6% since first listed36 events — show timeline
- 2026-05-11 Listing Removed — Hive MLS
- 2026-05-02 Relisted — Hive MLS
- 2026-04-23 Pending — Hive MLS
- 2026-04-23 Listing Removed — Hive MLS
- 2026-03-26 Relisted — Hive MLS
- 2026-03-26 Listing Removed — Hive MLS
- 2026-03-11 Relisted — AMLS
- 2026-03-11 Price Changed $175,000 AMLS
- 2026-03-11 Relisted — Hive MLS
- 2026-03-11 Price Changed $175,000 Hive MLS
- 2026-02-21 Pending — Hive MLS
- 2026-02-20 Listing Removed — Hive MLS
- 2026-02-11 Contingent — AMLS
- 2026-01-29 Pending — Hive MLS
- 2026-01-12 Price Changed $199,900 AMLS
- 2026-01-09 Price Changed $199,900 Hive MLS
- 2025-12-09 Price Changed $205,000 AMLS
- 2025-12-08 Relisted — AMLS
- 2025-12-05 Delisted — AMLS
- 2025-11-24 Price Changed $217,700 AMLS
- 2025-04-04 Price Changed $222,700 AMLS
- 2025-03-06 Listed $175,000 Hive MLS
- 2025-03-06 Listed $222,900 AMLS
- 2025-03-06 Listed $205,000 Hive MLS
- 2024-10-11 Listing Removed — Hive MLS
- 2024-10-11 Listing Removed — Hive MLS
- 2024-10-07 Price Changed $204,900 AMLS
- 2024-06-07 Listed $204,000 Hive MLS
- 2024-06-07 Listed $204,000 Hive MLS
- 2023-11-22 Listing Removed — Hive MLS
- 2023-11-22 Listing Removed — Hive MLS
- 2023-11-16 Listed $229,500 Hive MLS
- 2023-11-16 Listed $229,500 Hive MLS
- 2023-11-05 Listing Removed — Hive MLS
- 2023-05-05 Listed $212,500 Hive MLS
- 2023-05-05 Listed $212,500 Hive MLS
Property tax history
+9.1%/yrLatest (2025): $2,210 · -7.1% YoY. Source: county tax records.
Cash-flow waterfall
monthlySold comps — $/sqft
last 12 mo · ≤1 miLoading sold comps…