 🏷️ Likely Rental
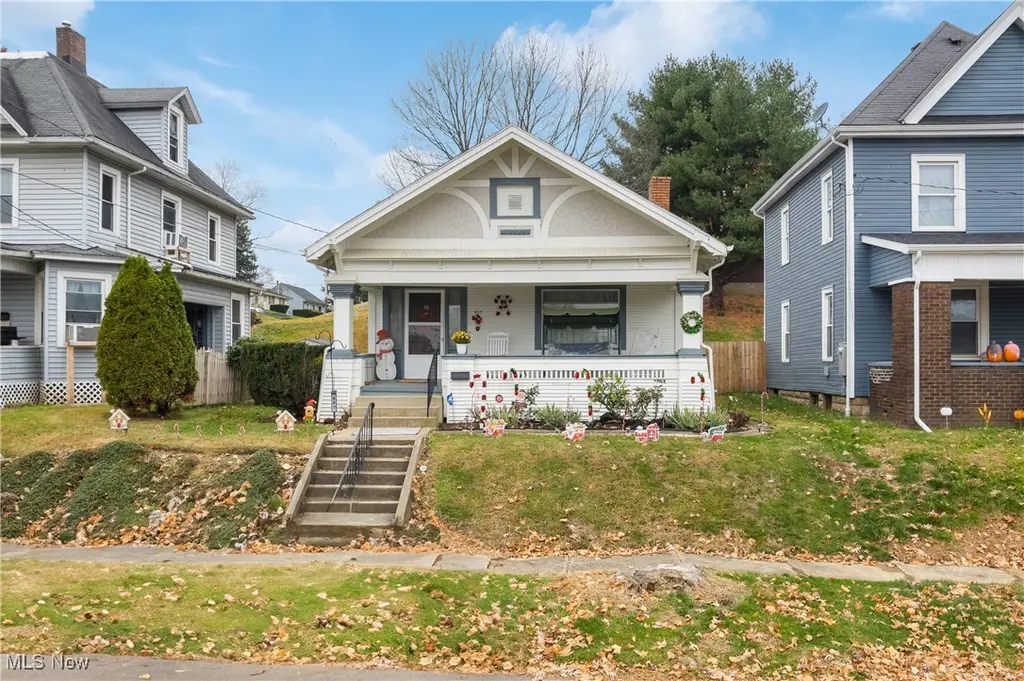
827 9th St SW · Massillon, OH
Flood risk 1/10 · Minimal
- FEMA flood zone
- X (unshaded)
- Chance of flooding over 30 yrs
- 0.0%
- Est. flood insurance / yr
- $473 – $860
Fire risk 1/10 · Minimal
- Est. fire insurance / yr
- $713 – $1,323
Heat risk 3/10 · Minor
- Hot days now (above 97°F)
- 7 days/yr
- Hot days in 30 yrs
- 17 days/yr
Wind risk 1/10 · Minimal
- Chance of severe wind over 30 yrs
- —
Air-quality risk 2/10 · Minimal
- Unhealthy air days now
- 0 days/yr
- Unhealthy air days in 30 yrs
- 1 days/yr
Risk factors via First Street. Map © Google.
Why this score? — see what drove the B- grade
The composite is a weighted blend of 9 inputs, each scored 0–100. Each bar is that input's sub-score; the figure is the points it added to the 100-point composite (weight × sub-score).
- Cash flow +24.0/30.0
- ARV discount +15.0/15.0
- DSCR +7.7/10.0
- 1% rule +6.0/10.0
- Schools +4.0/10.0
- Livability +3.7/5.0
- Rent growth +2.5/5.0
- Condition / age +2.5/5.0
- Appreciation +0.0/10.0
$99,000
🖨 Deal sheet (PDF) 📄 Offer letter ✓ Due diligence
Listing remarks MLS
Maximize your portfolio with this turnkey Craftsman gem in a great Massillon location. This well-maintained property offers immediate cash flow with a reliable tenant already in place on a month-to-month basis at $732.36/month. Beyond the numbers, the home shines with timeless character, featuring stunning original woodwork and classic built-ins throughout. Whether you are looking for a steady rental or a charming primary residence, this home delivers. The layout includes a large basement for ample storage and a fantastic covered front porch. Keep it as a high-performing rental or transition it into your own private residence—the choice is yours!
Key facts
- Covered front porch
- Large basement
- Well-maintained home
Tags
Neighborhood map
What this means for you Summary
Snapshot
- This is a 2-bed/1.0-bath single-family listed at $99k.
Deal economics
- At list price, monthly cash flow is $193 ($2k/yr) — positive.
- The deal already cash-flows at list — no discount required.
- Meets the 1% rule at list price ($1k rent vs $99k).
- Recommended offer: $87k (12.0% below list) — sets the bar for market timing.
- Cap rate 8.6% vs local median 3.9% in Massillon — top-decile yield for the area; either an underpriced asset or a hidden risk that comps aren't pricing in. Stress-test before assuming the spread holds.
Location & tenants
- Location reads 74/100 on livability (#306 in OH, #4,928 nationally) — a middle-class / working-renter tenant base. Strengths: cost of living A+, housing A+, health & safety A-; Watch: employment C-, amenities F, commute F.
- Massillon City (urban): math 43% / reading 52% proficiency, ranked #487 of 656 in OH (top 74%) — families likely to look elsewhere, expect single-tenant / working-renter base with shorter leases; 60% free/reduced lunch — lower-income household profile, screen leases tightly.
- Market conditions: 103 active listings in the ZIP; 7 comparable units currently listed for rent nearby; rentals at typical pace (median 23d on market — plan ~3-4 weeks tenant-placement turnaround); 528 units permitted in Stark County in 2024 (84 in 5+ unit buildings).
Forward outlook
- Local home prices are declining (-3.0%/yr); year-one equity from $684 of loan paydown is wiped out by about $3k of value loss. Plan a longer hold.
- Stark County population projected to shrink 8% by 2050 — rents likely to lag national; underwrite the cash flow, not the appreciation.
Negotiation context
- It's been on market 194 days — a 12% lower offer ($87k) is reasonable based on typical stale-listing flexibility.
- 3 sale attempts since 33y ago with the ask held roughly flat each time — persistent listings suggest the price (not the market) is what's stuck; bring a comps-based counter.
Risks & watch-outs
- Watch-outs: built in 1911 — expect roof / HVAC / electrical / plumbing capex.
Questions for the listing agent
- It's been on market 194 days. Have you received any prior offers? Is the seller open to a 12% concession, seller financing, or rate buy-down credit?
- Built in 1911 — when were the roof, HVAC, electrical panel, plumbing, and water heater last replaced?
- Why hasn't it sold? Are there any deal-killer items the seller is aware of (foundation, flood, title, zoning, code violations)?
- Is there a deadline driving the sale (1031 exchange, divorce, estate, relocation)? That informs how much negotiation room exists.
- Schools are B-rated — typically a magnet for longer-tenancy family renters. What's the average tenant stay here, and is there a school-zone premium baked into asking?
- What's the average days-on-market for RENTAL listings here right now (not sales)? A rising rental-DOM trend means longer vacancies and softer asking-rent achievability than the comps imply.
- What's the recent tenant-quality profile in this submarket — average credit score on applications, eviction rate, late-payment / NSF rate, and stable-employment percentage? A property-management company in the area should have these aggregated.
- How much new for-sale + rental construction is in the pipeline within 1–3 miles? Heavy new supply typically softens prices + rents 12–24 months out; constrained supply supports both.
Investment metrics
- 1% rule
- 1.10% ✓
- Cap rate
- 8.64%
- Cash-on-cash
- 8.37%
- DSCR
- 1.37
- GRM
- 7.6
CMA / ARV
- ARV (median comp)
- $142,082
- List price
- $99,000
- Delta
- -30.32%
- Verdict
- UNDERPRICED
- Comps
- 20 within 1.0 mi
Show comp detail 12 sales within ~0.75 mi
| Address | Dist | Beds/Ba | Sqft | Sold | Price | $/sf | Match |
|---|---|---|---|---|---|---|---|
| 803 12th St SW | 0.21mi | 3/1.0 (+1) | 1,040 (-2%) | 6mo | $162,000 | $156 | 77 |
| 718 Bebb Ave SW | 0.22mi | 3/1.0 (+1) | 1,104 (+4%) | 5mo | $119,500 | $108 | 73 |
| 808 8th St SW | 0.16mi | 2/1.0 | 1,152 (+9%) | 7mo | $65,500 | $57 | 72 |
| 1115 Borden Ave SW | 0.29mi | 2/1.0 | 1,152 (+9%) | 3mo | $120,000 | $104 | 69 |
| 324 Snyder Pl SW | 0.27mi | 2/1.0 | 972 (-8%) | 7mo | $149,000 | $153 | 68 |
| 810 Taylor St SW | 0.05mi | 3/2.5 (+1) | 1,176 (+11%) | 6mo | $185,000 | $157 | 63 |
| 1110 14th St SW | 0.37mi | 3/2.0 (+1) | 1,092 (+3%) | 7mo | $220,000 | $201 | 62 |
| 127 12th St NW | 0.58mi | 2/1.0 | 1,004 (-5%) | 3mo | $69,900 | $70 | 62 |
| 621 Geiger Ave SW | 0.32mi | 3/2.0 (+1) | 1,144 (+8%) | 2mo | $157,000 | $137 | 61 |
| 804 15th St SW | 0.45mi | 3/1.0 (+1) | 1,148 (+8%) | 1mo | $169,680 | $148 | 60 |
| 101 14th St NW | 0.61mi | 2/1.0 | 981 (-7%) | 4mo | $125,000 | $127 | 55 |
| 1002 15th St SW | 0.45mi | 3/2.0 (+1) | 968 (-9%) | 1mo | $182,500 | $189 | 55 |
Match score weights: distance 35% · size 25% · config 20% · recency 20%. Top-matched comps best support the ARV.
Projected returns pro-forma
-3.0% appreciation · 3.0% rent growth · sell at horizon
- IRR
- -3.6%
- Equity multiple
- 0.87×
- Total profit
- $-3,717
- Equity at exit
- $14,761
- IRR
- 6.1%
- Equity multiple
- 1.46×
- Total profit
- $12,646
- Equity at exit
- $8,560
Cash invested: $27,720 (down + closing). Projections, not guarantees.
Landlord ↔ Tenant lean methodology
- Overall (STATE)
- 73 Landlord-Friendly
- State Ohio
- 73 Landlord-Friendly · R+6
- County
- — inherits STATE
- City
- — inherits STATE
ZIP-level market 44647
- Active inventory
- 103
- Price-to-rent
- 7.6×
Monthly cashflow live
- Estimated rent
- $1,086 high interval (Pro) →
- Mortgage (P&I)
- −$519
- Tax from tax record
- −$104 /mo · $1,244/yr
- Insurance
- −$41
- HOA
- −$0
- Vacancy / Maint / Mgmt
- −$228
- Net cashflow
- $193
Break-even live
Sensitivity live
| Price | -10% $250 | -5% $221 | +0% $193 | +5% $165 | +10% $137 |
|---|---|---|---|---|---|
| Rent | -10% $108 | -5% $151 | +0% $193 | +5% $236 | +10% $279 |
| Rate | -1.0pp $243 | -0.5pp $219 | base $193 | +0.5pp $168 | +1.0pp $142 |
UW: 25.0% down · 7.5% · 30yr · 1.5% tax · 5.0% vac · 8.0% maint · 8.0% mgmt
Financing live
Cash to close
- Down payment
- $24,750
- Closing costs
- $2,970
- Reserves months
- —
- Total cash needed
- —
Loan-product check · same deal, 3 products live
Conventional
25% down · 7.5% · 30yr
- Down + closing
- —
- Monthly P&I
- —
- Monthly cashflow
- —
- DSCR
- —
- Eligible?
- —
Personal DTI + credit; lowest rate.
DSCR
20% down · 8.5% · 30yr
- Down + closing
- —
- Monthly P&I
- —
- Monthly cashflow
- —
- DSCR
- —
- Eligible?
- —
No personal income docs; deal must DSCR.
Hard money
10% down · 12.0% · 12mo
- Down + closing
- —
- Monthly P&I
- —
- Monthly cashflow
- —
- DSCR
- —
- Eligible?
- —
Short-term bridge; refi at stabilization.
Rent comps 7 comps
| Address | Beds | Baths | Sqft | Rent | $/sqft | DOM | Units | Dist |
|---|---|---|---|---|---|---|---|---|
| 717 15th St SW Massillon, OH | 3.0 | 1.0 | 936 | $1,250 | $1.34 | 45d | 1 | 0.48mi |
| 308 Erie St S Unit 17 Massillon, OH | 2.0 | 1.0 | 700 | $635 | $0.91 | 15d | 1 | 0.81mi |
| 308 Erie St S Unit 17 Massillon, OH | 2.0 | 1.0 | 700 | $625 | $0.89 | 45d | 1 | 0.81mi |
| 111 Maple Ave SE Massillon, OH | 3.0 | 1.0 | 1300 | $1,050 | $0.81 | 14d | 1 | 0.86mi |
| 450 South Ave SE Massillon, OH | 2.0 | 1.5 | 1270 | $1,236 | $0.97 | 15d | 1 | 1.10mi |
| 610 Wellman Ave SE Unit 610 Wellman 2nd Floor Massillon, OH | 1.0 | 1.0 | 700 | $625 | $0.89 | 22d | 1 | 1.23mi |
| 1704 13th St SE Massillon, OH | 3.0 | 1.0 | 1248 | $1,300 | $1.04 | 22d | 1 | 1.36mi |
Listing history 21 events
-
2026-06-18days on market $99,000 Active 194 DOM
-
2026-06-17days on market $99,000 Active 193 DOM
-
2026-06-16days on market $99,000 Active 192 DOM
-
2026-06-15days on market $99,000 Active 191 DOM
-
2026-06-14days on market $99,000 Active 189 DOM
-
2026-06-13days on market $99,000 Active 188 DOM
-
2026-06-10days on market $99,000 Active 186 DOM
-
2026-06-09days on market $99,000 Active 185 DOM
-
2026-06-08days on market $99,000 Active 184 DOM
-
2026-06-07days on market $99,000 Active 183 DOM
-
2026-06-02days on market $99,000 Active 178 DOM
-
2026-06-01days on market $99,000 Active 177 DOM
-
2026-05-31days on market $99,000 Active 176 DOM
-
2026-05-30days on market $99,000 Active 175 DOM
-
2025-12-06$99,000 Active 660-char remark
Show marketing remark (660 chars)
Maximize your portfolio with this turnkey Craftsman gem in a great Massillon location. This well-maintained property offers immediate cash flow with a reliable tenant already in place on a month-to-month basis at $732.36/month. Beyond the numbers, the home shines with timeless character, featuring stunning original woodwork and classic built-ins throughout. Whether you are looking for a steady rental or a charming primary residence, this home delivers. The layout includes a large basement for ample storage and a fantastic covered front porch. Keep it as a high-performing rental or transition it into your own private residence—the choice is yours!
-
2024-08-07soldstatus $99,000
-
2024-08-05soldstatus $99,000 Closed 632-char remark
Show marketing remark (632 chars)
Here is a nice Craftsman style Ranch with great woodwork on the interior of this home. New carpet through out living room, dinning room, and the bedrooms. Nicely painted walls through out. . Some of the window have newer replacement windows and some original ones as well. House has a nice front porch and a nice size backyard but is on a hill. Will make a great starter home or rental. Has a large dry basement with a shower in the laundry area. Furnace is only a year old and water heater is newer also. The homes wiring has also had updating as well as some of the plumbing. The roof is 10 years old but the down spouting is new.
-
2024-07-22status Pending 632-char remark
Show marketing remark (632 chars)
Here is a nice Craftsman style Ranch with great woodwork on the interior of this home. New carpet through out living room, dinning room, and the bedrooms. Nicely painted walls through out. . Some of the window have newer replacement windows and some original ones as well. House has a nice front porch and a nice size backyard but is on a hill. Will make a great starter home or rental. Has a large dry basement with a shower in the laundry area. Furnace is only a year old and water heater is newer also. The homes wiring has also had updating as well as some of the plumbing. The roof is 10 years old but the down spouting is new.
-
2024-07-19$99,000 Active 632-char remark
Show marketing remark (632 chars)
Here is a nice Craftsman style Ranch with great woodwork on the interior of this home. New carpet through out living room, dinning room, and the bedrooms. Nicely painted walls through out. . Some of the window have newer replacement windows and some original ones as well. House has a nice front porch and a nice size backyard but is on a hill. Will make a great starter home or rental. Has a large dry basement with a shower in the laundry area. Furnace is only a year old and water heater is newer also. The homes wiring has also had updating as well as some of the plumbing. The roof is 10 years old but the down spouting is new.
-
1994-04-19soldstatus $27,000
-
1993-12-17$29,500
ⓘ Source: listings_history table (triggers on properties + properties_extension) + one-shot
backfill from property_details.listing_events for pre-trigger history.
Tax reassessment forecast OH · Partial reset (capped growth)
- Current annual tax
- $1,244 · $104/mo
- Projected year-2 tax
- $1,394 · $116/mo
- Expected delta
- +$150/yr (+$12/mo · 12.1%)
ⓘ Screening estimate from a state-policy table — verify with the county assessor before closing.
Climate risk First Street
- Flood 1/10 Low FEMA zone X (unshaded) · 0% chance over 30 yrs
- Wildfire 1/10 Low
- Heat 3/10 Moderate 7 d/yr ≥97°F today · 17 d/yr by 30 yrs out
- Wind 1/10 Low
- Air quality 2/10 Low 0 unhealthy d/yr today · 1 by 30 yrs out
Nearby sold comps map
Loading sold comps map…
Walkable amenities ~0.75 mi
Loading nearby amenities…
Taxation est. · year 1
- Rental income
- $13,026
- − Mortgage interest
- −$5,546
- − Property taxes
- −$1,244
- − Insurance
- −$495
- − Repairs & maintenance
- −$1,042
- − Management
- −$1,042
- − Depreciation
- −$2,880
- Taxable income
- $777
- Est. tax owed @ 24.0%
- −$187
- After-tax cash flow
- $2,135/yr
For passive investors: Depreciation is non-cash, so a rental often shows a tax loss while cash-flowing — sheltering income. Rental losses are passive: they offset passive income freely, and up to $25,000/yr can offset ordinary (W-2) income if you actively participate and your MAGI is under $100k (phasing out to $0 by $150k); unused losses carry forward. On sale, claimed depreciation is recaptured at up to 25%, and gains may owe capital-gains tax (a 1031 exchange can defer both). Figures are a year-1 estimate at your 24.0% rate — not tax advice; consult a CPA.
Schools (NCES district)
- District
- Massillon City
- NCES district ID
- 3904435
- Math proficiency
- 43% ▼ -14.00%
- Reading proficiency
- 52% ▼ -11.00%
- Median HH income
- $38,094
- Composite
- 39.54/100
- National rank
- #3941
- State rank
- #487 of 656 in OH
Livability — Massillon
- Score
- 74/100
- State rank
- #306
- US rank
- #4928
Category grades
Schools grade is shown separately in the Schools card above.
Census & demographics
- Census place
- Massillon, OH
- County
- Stark County · 272,865 people
- City population
- 65,858
- Metro
- Canton-Massillon, OH
- Population (ZIP)
- 18,117
- Household income
- $67,140
- Rent vs Own
- Severe rent burden
- 231.0
Population outlook (Stark County) Hauer SSP2
- Today (2025)
- 373,708 people
- By 2030
- 371,245 · -0.7%
- By 2040
- 361,331 · -3.3%
- By 2050
- 345,290 · -7.6%
- By 2075
- 302,669 · -19.0%
- By 2100
- 238,870 · -36.1%
Race, ethnicity, and origin ACS 2023
- Neighborhood character
- Predominantly White (93%)
- Race & ethnicity
- White 93% Two or more races 4% Hispanic / Latino 2% Black 1%
- Common ancestry
- Romanian 3% Lithuanian 2% Slovak 2%
- Foreign-born
- 1% · Canada
- Languages at home
- 97% English-only · Spanish 1% Arabic 1%
Political lean MEDSL · Stark
- 2024 margin
- Strong R (+21.9) · D 38.6% · R 60.5%
- 2008→2024 swing
- -27.4pp toward R · 2008: 5.5pp · 2024: -21.9pp
- All cycles
- 2024: R+21.9 2020: R+18.5 2016: R+17.4 2012: R+0.4 2008: D+5.5
Not yet ingested
- Civics
- —
Market trends
- HPI YoY
- ▼ -163.61%
- Current HPI
- 207.6115
- Rent YoY
- —
- Metro
- Canton-Massillon, OH
- State GDP YoY
- ▲ 1.98%
- F500 in state
- 48
Industry mix (Fortune 500 HQ in OH)
| Industry | F500 HQs | Revenue |
|---|---|---|
| Insurance | 3 | $145B |
|
||
| Industrial Machinery | 3 | $49B |
|
||
| Financial Services | 3 | $24B |
|
||
| Consumer Goods | 2 | $93B |
|
||
| Aerospace / Defense | 2 | $47B |
|
||
| Utilities | 2 | $33B |
|
||
Price history
+235.6% since first listed7 events — show timeline
- 2025-12-06 Listed $99,000 MLSNOW
- 2024-08-07 Sold (Public Records) $99,000 Public Records
- 2024-08-05 Sold (MLS) $99,000 MLSNOW
- 2024-07-22 Pending — MLSNOW
- 2024-07-19 Listed $99,000 MLSNOW
- 1994-04-19 Sold (Public Records) $27,000 Public Records
- 1993-12-17 Listed $29,500 MLSNOW
Property tax history
+2.7%/yrLatest (2024): $1,244 · +13.7% YoY. Source: county tax records.
Cash-flow waterfall
monthlySold comps — $/sqft
last 12 mo · ≤1 miLoading sold comps…