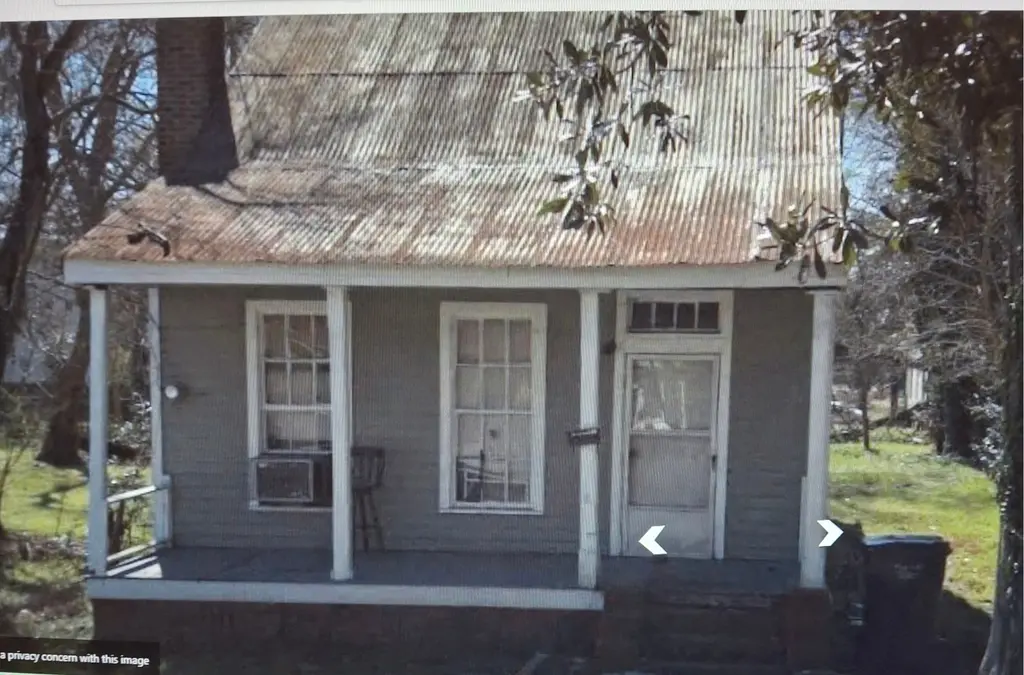
132 Walker St · Augusta-Richmond County consolidated government (balance), GA
Flood risk 1/10 · Minimal
- FEMA flood zone
- X
- Chance of flooding over 30 yrs
- 0.0%
- Est. flood insurance / yr
- $507 – $1,088
Fire risk 1/10 · Minimal
- Est. fire insurance / yr
- $963 – $1,789
Heat risk 8/10 · Major
- Hot days now (above 108°F)
- 7 days/yr
- Hot days in 30 yrs
- 17 days/yr
Wind risk 6/10 · Moderate
- Chance of severe wind over 30 yrs
- 66.0%
Air-quality risk 4/10 · Minor
- Unhealthy air days now
- 4 days/yr
- Unhealthy air days in 30 yrs
- 4 days/yr
Risk factors via First Street. Map © Google.
Why this score? — see what drove the C- grade
The composite is a weighted blend of 9 inputs, each scored 0–100. Each bar is that input's sub-score; the figure is the points it added to the 100-point composite (weight × sub-score).
- Cash flow +15.0/30.0
- Appreciation +9.1/10.0
- ARV discount +7.5/15.0
- 1% rule +5.0/10.0
- DSCR +5.0/10.0
- Livability +2.5/5.0
- Condition / age +2.5/5.0
- Rent growth +2.2/5.0
- Schools +1.3/10.0
$25,000
🖨 Deal sheet (PDF) 📄 Offer letter ✓ Due diligence
Listing remarks
132 Walker St is a 1,413 square foot house on a 5,663 square foot lot with 3 bedrooms and 1 bathroom. The house have been badly burned and badly damaged. It is in historic old town Augusta Ga. It was a beautiful home once and it can be made into a beautiful home again! Contact Elora Bauknight Herrington 980-298-9962 call or text or email [email protected] . 25K or Best Offer. Thanx
Key facts
- Built 1911
Neighborhood map
What this means for you Summary
Snapshot
- This is a 3-bed/1.0-bath single-family listed at $25k.
Deal economics
- At list price, monthly cash flow is $966 ($12k/yr) — positive.
- The deal already cash-flows at list — no discount required.
- Meets the 1% rule at list price ($2k rent vs $25k).
- Cap rate 52.6% vs local median 5.3% in Augusta-Richmond County consolidated government (balance) — top-decile yield for the area; either an underpriced asset or a hidden risk that comps aren't pricing in. Stress-test before assuming the spread holds.
Location & tenants
- Location reads: area grade C — affects rentability + tenant quality, not the cash-flow math above.
- Richmond County (urban): math 12% / reading 20% proficiency, ranked #154 of 174 in GA (top 88%) — low school quality limits family demand, transient renter base, plan for 1-2y turnover; 72% free/reduced lunch — lower-income household profile, screen leases tightly.
- Zoned schools: W.S. Hornsby Middle School (math 2% / reading 5%, grade F, #468 of 470 statewide, top 100%, 399 students, 98% FRL); Laney High School (math 2% / reading 8%, grade F, #394 of 424 statewide, top 97%, 684 students, 98% FRL) — zoned schools average 98% FRL vs 72% district-wide (26 pts higher); higher-poverty schools than district average — tighter screening recommended.
- Market conditions: Rents soft (-1.3%/yr); 131 active listings in the ZIP; 26 comparable units currently listed for rent nearby; rentals at typical pace (median 26d on market — plan ~3-4 weeks tenant-placement turnaround); 46% of comp listings sitting > 30 days — soft ceiling on asking rent; lower-income renter base — watch delinquency; 561 units permitted in Richmond County in 2024 (0 in 5+ unit buildings).
- At $1,531/mo this rent would consume 73% of the median local household income ($25k/yr) (locally 2063% of renters already pay >50% of income on rent) — very limited rent-growth headroom before tenants either downsize or default.
Forward outlook
- In year one you build about $2k of equity ($173 loan paydown + $2k appreciation (8.2% local appreciation)).
- Richmond County population projected to shrink 5% by 2050 — rents likely to lag national; underwrite the cash flow, not the appreciation.
- At projected returns (8.2% appreciation + 0.0% rent growth), your $7k cash investment doubles in ~1 year — after that, you're playing with house money.
Negotiation context
- Only 1 days on market — expect competitive offers; lowballing is unlikely to land.
- 2 sale attempts; this cycle's ask is 25% above the opening price — seller raised mid-cycle; expect resistance to lowballs.
Risks & watch-outs
- Watch-outs: property tax is 4.9% of price; built in 1911 — expect roof / HVAC / electrical / plumbing capex.
- Climate carrying-cost: major wind risk, 66% chance of damaging wind over 30y; extreme-heat days projected 7→17/yr by 2055 (HVAC capex compounding) — expect insurance premiums to compound above CPI over the hold.
Questions for the listing agent
- Built in 1911 — when were the roof, HVAC, electrical panel, plumbing, and water heater last replaced?
- Property tax is high relative to price — has the assessment been appealed recently, and will the sale trigger a re-assessment?
- Is there a deadline driving the sale (1031 exchange, divorce, estate, relocation)? That informs how much negotiation room exists.
- What's the average days-on-market for RENTAL listings here right now (not sales)? A rising rental-DOM trend means longer vacancies and softer asking-rent achievability than the comps imply.
- What's the recent tenant-quality profile in this submarket — average credit score on applications, eviction rate, late-payment / NSF rate, and stable-employment percentage? A property-management company in the area should have these aggregated.
- How much new for-sale + rental construction is in the pipeline within 1–3 miles? Heavy new supply typically softens prices + rents 12–24 months out; constrained supply supports both.
Investment metrics
- 1% rule
- 6.12% ✓
- Cap rate
- 52.64%
- Cash-on-cash
- 165.52%
- DSCR
- 8.36
- GRM
- 1.4
CMA / ARV
- ARV (on-the-fly)
- $149,778
- Comps found
- 9
Show comp detail 9 sales within ~0.75 mi
| Address | Dist | Beds/Ba | Sqft | Sold | Price | $/sf | Match |
|---|---|---|---|---|---|---|---|
| 118 E Hale St | 0.47mi | 3/2.0 | 1,413 (0%) | 10mo | $139,900 | $99 | 66 |
| 716 5th St | 0.53mi | 3/2.0 | 1,496 (+6%) | 1mo | $155,000 | $104 | 61 |
| 522 2nd St | 0.05mi | 4/2.0 (+1) | 1,521 (+8%) | 19mo | $235,000 | $155 | 60 |
| 218 Broad St | 0.32mi | 3/2.0 | 1,586 (+12%) | 5mo | $237,750 | $150 | 57 |
| 512 2nd St | 0.07mi | 4/2.0 (+1) | 1,623 (+15%) | 15mo | $255,000 | $157 | 50 |
| 105 Broad St | 0.36mi | 4/2.0 (+1) | 1,512 (+7%) | 15mo | $160,000 | $106 | 50 |
| 107 E Hall St | 0.46mi | 3/2.0 | 1,548 (+10%) | 15mo | $54,000 | $35 | 46 |
| 415 Aiken St | 0.64mi | 3/1.5 | 1,260 (-11%) | 10mo | $150,400 | $119 | 42 |
| 6 Hall St | 0.48mi | 3/2.0 | 1,570 (+11%) | 21mo | $150,000 | $96 | 38 |
Match score weights: distance 35% · size 25% · config 20% · recency 20%. Top-matched comps best support the ARV.
Projected returns pro-forma
8.18% appreciation · 0.0% rent growth · sell at horizon
- IRR
- —
- Equity multiple
- 10.67×
- Total profit
- $67,665
- Equity at exit
- $19,301
- IRR
- —
- Equity multiple
- 21.37×
- Total profit
- $142,556
- Equity at exit
- $38,608
Cash invested: $7,000 (down + closing). Projections, not guarantees.
Landlord ↔ Tenant lean methodology
- Overall (STATE)
- 90 Strongly Landlord-Friendly
- State Georgia
- 90 Strongly Landlord-Friendly · R+3
- County
- — inherits STATE
- City
- — inherits STATE
ZIP-level market 30901
- Home prices YoY
- 4.1%
- Rents YoY
- -1.3%
- Active inventory
- 131
- Price-to-rent
- 1.4×
Monthly cashflow live
- Estimated rent
- $1,531 high interval (Pro) →
- Mortgage (P&I)
- −$131
- Tax from tax record
- −$102 /mo · $1,227/yr
- Insurance
- −$10
- HOA
- −$0
- Vacancy / Maint / Mgmt
- −$321
- Net cashflow
- $966
Break-even live
Sensitivity live
| Price | -10% $1,054 | -5% $1,045 | +0% $966 | +5% $958 | +10% $951 |
|---|---|---|---|---|---|
| Rent | -10% $845 | -5% $905 | +0% $966 | +5% $1,026 | +10% $1,086 |
| Rate | -1.0pp $978 | -0.5pp $972 | base $966 | +0.5pp $959 | +1.0pp $952 |
UW: 25.0% down · 7.5% · 30yr · 1.5% tax · 5.0% vac · 8.0% maint · 8.0% mgmt
Financing live
Cash to close
- Down payment
- $6,250
- Closing costs
- $750
- Reserves months
- —
- Total cash needed
- —
Loan-product check · same deal, 3 products live
Conventional
25% down · 7.5% · 30yr
- Down + closing
- —
- Monthly P&I
- —
- Monthly cashflow
- —
- DSCR
- —
- Eligible?
- —
Personal DTI + credit; lowest rate.
DSCR
20% down · 8.5% · 30yr
- Down + closing
- —
- Monthly P&I
- —
- Monthly cashflow
- —
- DSCR
- —
- Eligible?
- —
No personal income docs; deal must DSCR.
Hard money
10% down · 12.0% · 12mo
- Down + closing
- —
- Monthly P&I
- —
- Monthly cashflow
- —
- DSCR
- —
- Eligible?
- —
Short-term bridge; refi at stabilization.
Rent comps 26 comps
| Address | Beds | Baths | Sqft | Rent | $/sqft | DOM | Units | Dist |
|---|---|---|---|---|---|---|---|---|
| 112 Telfair St Unit B Augusta, GA | 4.0 | 3.5 | 1400 | $2,000 | $1.43 | 16d | 1 | 0.09mi |
| 112 Telfair St Unit A Augusta, GA | 4.0 | 3.0 | 1400 | $2,300 | $1.64 | 16d | 1 | 0.09mi |
| 305 Walker St Unit A Augusta, GA | 2.0 | 1.0 | 925 | $925 | $1.00 | 46d | 1 | 0.22mi |
| 305 Walker St Unit A Augusta, GA | 2.0 | 1.0 | 925 | $925 | $1.00 | 25d | 1 | 0.22mi |
| 204 Ellis St Augusta, GA | 2.0 | 1.0 | 1029 | $1,350 | $1.31 | 16d | 1 | 0.24mi |
| 320 3rd St Augusta, GA | 2.0 | 1.0 | 1117 | $1,200 | $1.07 | 46d | 1 | 0.27mi |
| 136 Broad St Augusta, GA | 2.0 | 1.0 | 1200 | $1,100 | $0.92 | 46d | 1 | 0.29mi |
| 134 Broad St Augusta, GA | 2.0 | 1.0 | 1100 | $1,150 | $1.05 | 46d | 1 | 0.29mi |
| 420 E Boundary Augusta, GA | 2.0 | 1.0 | 950 | $850 | $0.89 | 46d | 1 | 0.32mi |
| 133 Broad St Unit A Augusta, GA | 2.0 | 2.0 | 1000 | $975 | $0.97 | 46d | 1 | 0.34mi |
| 133 Broad St Unit A Augusta, GA | 2.0 | 2.0 | 1000 | $975 | $0.97 | 25d | 1 | 0.34mi |
| 410 4th St Unit A Augusta, GA | 2.0 | 1.5 | 925 | $985 | $1.06 | 25d | 1 | 0.34mi |
| 211 Broad St Augusta, GA | 3.0 | 2.0 | 1200 | $1,350 | $1.12 | 46d | 1 | 0.34mi |
| 329 E View Dr Augusta, GA | 3.0 | 1.5 | 1260 | $1,300 | $1.03 | 25d | 1 | 1.06mi |
| 913 Walker St Augusta, GA | 2.0 | 2.0 | 1000 | $1,200 | $1.20 | 16d | 1 | 1.07mi |
| 936 Broad St #317 Augusta, GA | 2.0 | 2.0 | 1184 | $1,600 | $1.35 | 25d | 1 | 1.14mi |
| 936 Broad St #306 Augusta, GA | 3.0 | 2.0 | 1510 | $2,075 | $1.37 | 25d | 1 | 1.14mi |
| 1030 Broad St Augusta, GA | 2.0 | 1.0 | 880 | $1,225 | $1.39 | 46d | 1 | 1.25mi |
| 1030 Broad St Unit D Augusta, GA | 2.0 | 1.0 | 880 | $1,015 | $1.15 | 46d | 1 | 1.25mi |
| 1030 Broad St Unit D Augusta, GA | 2.0 | 1.0 | 880 | $1,015 | $1.15 | 25d | 1 | 1.25mi |
| 1030 Broad St Unit C Augusta, GA | 2.0 | 1.0 | 900 | $1,225 | $1.36 | 25d | 1 | 1.25mi |
| 106 Tybee Ct Augusta, GA | 3.0–4.0 | 2.0 | 1336 | $1,071 | $0.80 | 46d | 4 | 1.29mi |
| 1016 Laney Walker Blvd Augusta, GA | 2.0 | 1.0 | 885 | $935 | $1.06 | 46d | 5 | 1.39mi |
| 1016 Laney Walker Blvd Augusta, GA | 1.0–2.0 | 1.0 | 794 | $995 | $1.25 | 25d | 4 | 1.39mi |
| 215 12th St Unit B Augusta, GA | 2.0 | 1.0 | 1365 | $2,100 | $1.54 | 25d | 1 | 1.40mi |
| 215 12th St Unit B Augusta, GA | 2.0 | 1.0 | 1365 | $2,100 | $1.54 | 46d | 1 | 1.40mi |
Listing history 4 events
-
2025-07-25historical
-
2025-07-25historical
-
2025-05-21$20,000
-
2025-05-21$20,000
ⓘ Source: listings_history table (triggers on properties + properties_extension) + one-shot
backfill from property_details.listing_events for pre-trigger history.
Tax reassessment forecast GA · Resets to sale price
- Current annual tax
- $1,227 · $102/mo
- Projected year-2 tax
- $1,227 · $102/mo
- Expected delta
- $0/yr ($0/mo · 0.0%)
ⓘ Screening estimate from a state-policy table — verify with the county assessor before closing.
Climate risk First Street
- Flood 1/10 Low FEMA zone X · 0% chance over 30 yrs
- Wildfire 1/10 Low
- Heat 8/10 Severe 7 d/yr ≥108°F today · 17 d/yr by 30 yrs out
- Wind 6/10 Major 66% chance of damaging wind over 30 yrs
- Air quality 4/10 Moderate 4 unhealthy d/yr today · 4 by 30 yrs out
Nearby sold comps map
Loading sold comps map…
Walkable amenities ~0.75 mi
Loading nearby amenities…
Taxation est. · year 1
- Rental income
- $18,369
- − Mortgage interest
- −$1,400
- − Property taxes
- −$1,227
- − Insurance
- −$125
- − Repairs & maintenance
- −$1,470
- − Management
- −$1,470
- − Depreciation
- −$727
- Taxable income
- $11,951
- Est. tax owed @ 24.0%
- −$2,868
- After-tax cash flow
- $8,719/yr
For passive investors: Depreciation is non-cash, so a rental often shows a tax loss while cash-flowing — sheltering income. Rental losses are passive: they offset passive income freely, and up to $25,000/yr can offset ordinary (W-2) income if you actively participate and your MAGI is under $100k (phasing out to $0 by $150k); unused losses carry forward. On sale, claimed depreciation is recaptured at up to 25%, and gains may owe capital-gains tax (a 1031 exchange can defer both). Figures are a year-1 estimate at your 24.0% rate — not tax advice; consult a CPA.
Schools (NCES district)
- District
- Richmond County
- NCES district ID
- 1304380
- Math proficiency
- 12% ▼ -9.00%
- Reading proficiency
- 20% ▼ -6.00%
- Median HH income
- $38,069
- Composite
- 13.43/100
- National rank
- #9524
- State rank
- #154 of 174 in GA
Livability — Augusta-Richmond County consolidated government (balance)
No livability data for this city. (Only ~50 U.S. cities are tracked.)
Census & demographics
- Census place
- Augusta-Richmond County consolidated government (balance), GA
- County
- Richmond County · 190,917 people
- City population
- 154,035
- Metro
- Augusta-Richmond County, GA-SC
- Population (ZIP)
- 16,484
- Household income
- $25,163
- Rent vs Own
- Severe rent burden
- 2063.0
Population outlook (Richmond County) Hauer SSP2
- Today (2025)
- 200,753 people
- By 2030
- 200,232 · -0.3%
- By 2040
- 196,813 · -2.0%
- By 2050
- 190,347 · -5.2%
- By 2075
- 172,496 · -14.1%
- By 2100
- 146,284 · -27.1%
Race, ethnicity, and origin ACS 2023
- Neighborhood character
- Predominantly Black (78%)
- Race & ethnicity
- Black 78% White 15% Two or more races 4% Hispanic / Latino 2%
- Common ancestry
- Lithuanian 1% Slovak 1%
- Foreign-born
- 1% · Canada
- Languages at home
- 97% English-only · Spanish 1%
Political lean MEDSL · Richmond
- 2024 margin
- Solid D (+36.1) · D 67.8% · R 31.7%
- 2008→2024 swing
- +4.3pp toward D · 2008: 31.8pp · 2024: 36.1pp
- All cycles
- 2024: D+36.1 2020: D+37.2 2016: D+32.4 2012: D+33.8 2008: D+31.8
Not yet ingested
- Civics
- —
Market trends
- HPI YoY
- ▲ 8.18%
- Current HPI
- 206.3145
- Rent YoY
- ▼ -1.31%
- Metro
- Augusta-Richmond County, GA-SC
- State GDP YoY
- ▲ 2.66%
- F500 in state
- 28
Industry mix (Fortune 500 HQ in GA)
| Industry | F500 HQs | Revenue |
|---|---|---|
| Paper / Packaging | 2 | $29B |
|
||
| Retail | 1 | $160B |
|
||
| Transportation / Logistics | 1 | $91B |
|
||
| Airlines | 1 | $62B |
|
||
| Consumer Goods | 1 | $47B |
|
||
| Utilities | 1 | $25B |
|
||
Price history
+0.0% since first listed4 events — show timeline
- 2025-07-25 Listing Removed — Hive MLS
- 2025-07-25 Listing Removed — Hive MLS
- 2025-05-21 Listed $20,000 Hive MLS
- 2025-05-21 Listed $20,000 Hive MLS
Property tax history
+12.2%/yrLatest (2025): $1,227 · +66.9% YoY. Source: county tax records.
Cash-flow waterfall
monthlySold comps — $/sqft
last 12 mo · ≤1 miLoading sold comps…