 Duplex
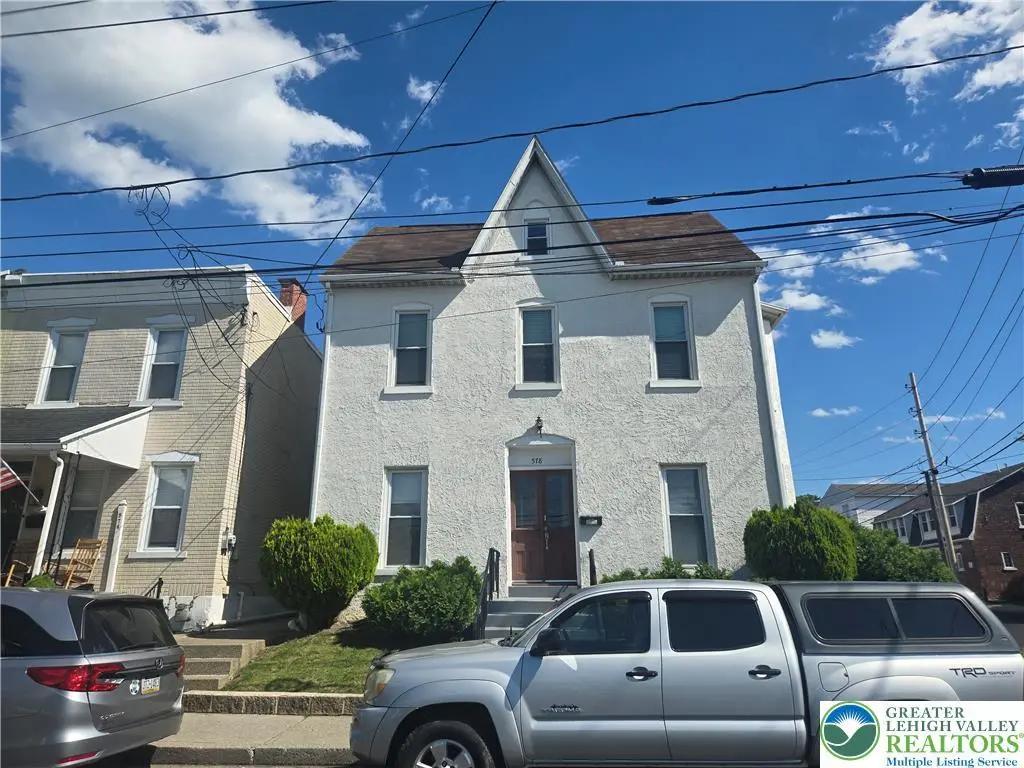
578 Broad St · Emmaus, PA
Flood risk 1/10 · Minimal
- FEMA flood zone
- X (unshaded)
- Chance of flooding over 30 yrs
- 0.0%
- Est. flood insurance / yr
- $473 – $860
Fire risk 4/10 · Minor
- Est. fire insurance / yr
- $511 – $949
Heat risk 5/10 · Moderate
- Hot days now (above 99°F)
- 7 days/yr
- Hot days in 30 yrs
- 15 days/yr
Wind risk 4/10 · Minor
- Chance of severe wind over 30 yrs
- 19.0%
Air-quality risk 2/10 · Minimal
- Unhealthy air days now
- 1 days/yr
- Unhealthy air days in 30 yrs
- 2 days/yr
Risk factors via First Street. Map © Google.
Why this score? — see what drove the C+ grade
The composite is a weighted blend of 9 inputs, each scored 0–100. Each bar is that input's sub-score; the figure is the points it added to the 100-point composite (weight × sub-score).
- Cash flow +22.7/30.0
- ARV discount +10.6/15.0
- DSCR +7.3/10.0
- 1% rule +5.9/10.0
- Schools +4.8/10.0
- Livability +4.3/5.0
- Rent growth +4.0/5.0
- Condition / age +3.8/5.0
- Appreciation +0.0/10.0
$340,000
🖨 Deal sheet (PDF) 📄 Offer letter ✓ Due diligence
Multi-family units
County records classify this as Multi-Family (2-4 Unit). Listing-text estimate: 2 units. confirmed
Listing remarks
SELLER HAS REQUESTED ALL OFFERS BE SUBMITTED BY NOON SUNDAY, JUNE 14TH This 2 unit detached home has been owner ocupied since 2005 and is now vacant. All numbers are estimates Each unit has their own private entrance accessed from the parking lot. Parking lot offers up to 7 parking spaces Heat is economical gas with one unit servicing both apartments.
Key facts
- Economical gas heat
- Parking spaces
- Private entrance
Tags
Property features AI
Finance
- Other: Property listed as a 2-unit multifamily
- Financial info: Financial details not provided
- HOA & community: HOA details not provided
Exterior
- Parking: Off-street parking; Seven parking spaces total
- Security: Security details not provided
- Utilities: Public water; Public sewer; Electric details not provided
- Home design: Two-story building; Stucco exterior
- Construction: Stucco construction; Year built not provided; Foundation details not provided; Roof details not provided
- Exterior features: Public records indicate a 4,117 sq ft lot (0.095 acres); Zoned R-HO
Interior
- Kitchen: Kitchen details not provided
- Bedrooms: Total of 2 units (bedroom counts not provided)
- Flooring: Flooring details not provided
- Bathrooms: Two full bathrooms (total)
- Heating & cooling: Gas heating; Ceiling fans for cooling
- Interior features: Two-unit interior (multifamily)
- Laundry & utility: Laundry/utility details not provided
Neighborhood map
What this means for you Summary
Snapshot
- This is a 2 × 2-bed/1.0-bath units multifamily listed at $340k. Condition is rated good.
Deal economics
- At list price, monthly cash flow is $585 ($7k/yr) — positive. Per door: $293/mo.
- The deal already cash-flows at list — no discount required.
- Meets the 1% rule at list price ($4k rent vs $340k).
- Cap rate 8.4% vs local median 3.2% in Emmaus — top-decile yield for the area; either an underpriced asset or a hidden risk that comps aren't pricing in. Stress-test before assuming the spread holds.
Location & tenants
- Location reads 86/100 on livability (#61 in PA, #424 nationally) — a professional / high-income tenant draw. Strengths: crime A+, amenities A+, cost of living A+; Watch: commute F.
- East Penn SD (suburban): math 43% / reading 65% proficiency, ranked #103 of 539 in PA (top 19%) — acceptable for families but not a draw, mixed tenant base, ~2y average lease; only 17% free/reduced lunch — higher-income household profile.
- Zoned schools: Lincoln El Sch (math 42% / reading 62%, grade C-, #586 of 1,518 statewide, top 42%, 399 students, 38% FRL); Lower Macungie Ms (math 23% / reading 61%, grade D-, #221 of 512 statewide, top 45%, 1,043 students, 36% FRL); Emmaus Hs (math 65% / reading 24%, grade D-, #195 of 437 statewide, top 44%, 2,846 students, 24% FRL) — zoned schools average 33% FRL vs 17% district-wide (16 pts higher); higher-poverty schools than district average — tighter screening recommended.
- Market conditions: Rents rising fast (+6.2%/yr); 98 active listings in the ZIP; solid renter incomes; 765 units permitted in Lehigh County in 2024 (286 in 5+ unit buildings).
- At $3,715/mo this rent would consume 48% of the median local household income ($94k/yr) (locally 645% of renters already pay >50% of income on rent) — very limited rent-growth headroom before tenants either downsize or default.
Forward outlook
- Local home prices are declining (-3.0%/yr); year-one equity from $2k of loan paydown is wiped out by about $10k of value loss. Plan a longer hold.
- Lehigh County population projected at +21% by 2050 — long-run rental-demand tailwind backs the buy-and-hold thesis.
- At projected returns (-3.0% appreciation + 6.2% rent growth), your $95k cash investment doubles in ~10 years — after that, you're playing with house money.
Negotiation context
- Only 6 days on market — expect competitive offers; lowballing is unlikely to land.
Risks & watch-outs
- Watch-outs: built in 1880 — expect roof / HVAC / electrical / plumbing capex.
- Climate carrying-cost: extreme-heat days projected 7→15/yr by 2055 (HVAC capex compounding) — expect insurance premiums to compound above CPI over the hold.
Questions for the listing agent
- Can we see the unit-by-unit rent roll, current vacancy, and any below-market leases? What's the average tenancy length?
- What capital expenditures (roof, boiler, parking lot, exteriors) have been made in the last 5 years, and what's planned in the next 2?
- Built in 1880 — when were the roof, HVAC, electrical panel, plumbing, and water heater last replaced?
- Is there a deadline driving the sale (1031 exchange, divorce, estate, relocation)? That informs how much negotiation room exists.
- Schools are A-rated — typically a magnet for longer-tenancy family renters. What's the average tenant stay here, and is there a school-zone premium baked into asking?
- What's the average days-on-market for RENTAL listings here right now (not sales)? A rising rental-DOM trend means longer vacancies and softer asking-rent achievability than the comps imply.
- What's the recent tenant-quality profile in this submarket — average credit score on applications, eviction rate, late-payment / NSF rate, and stable-employment percentage? A property-management company in the area should have these aggregated.
- How much new apartment / multifamily construction is in the pipeline within 1–3 miles? Heavy new supply (>2% of stock underway) typically softens rents 12–24 months out; light construction supports rent growth.
Investment metrics
- 1% rule
- 1.09% ✓
- Cap rate
- 8.36%
- Cash-on-cash
- 7.38%
- DSCR
- 1.33
- GRM
- 7.6
CMA / ARV
- ARV (on-the-fly)
- $365,184
- Comps found
- 1
Show comp detail 1 sale within ~0.75 mi
| Address | Dist | Beds/Ba | Sqft | Sold | Price | $/sf | Match |
|---|---|---|---|---|---|---|---|
| 569 Chestnut St | 0.18mi | 5/3.0 (+1) | 2,784 (+10%) | 6mo | $400,000 | $144 | 61 |
Match score weights: distance 35% · size 25% · config 20% · recency 20%. Top-matched comps best support the ARV.
Projected returns pro-forma
-3.0% appreciation · 6.18% rent growth · sell at horizon
- IRR
- -1.5%
- Equity multiple
- 0.94×
- Total profit
- $-5,503
- Equity at exit
- $50,695
- IRR
- 11.4%
- Equity multiple
- 2.02×
- Total profit
- $97,158
- Equity at exit
- $29,397
Cash invested: $95,200 (down + closing). Projections, not guarantees.
Landlord ↔ Tenant lean methodology
- Overall (STATE)
- 62 Landlord-Friendly
- State Pennsylvania
- 62 Landlord-Friendly · EVEN
- County
- — inherits STATE
- City
- — inherits STATE
ZIP-level market 18049
- Rents YoY
- 6.2%
- Active inventory
- 98
- Price-to-rent
- 15.3×
Monthly cashflow live
- Estimated rent
- $3,715 high interval (Pro) →
- Mortgage (P&I)
- −$1,783
- Tax est. 1.5%
- −$425 /mo · $5,100/yr
- Insurance
- −$142
- HOA
- −$0
- Vacancy / Maint / Mgmt
- −$780
- Net cashflow
- $585
Break-even live
Sensitivity live
| Price | -10% $820 | -5% $703 | +0% $585 | +5% $468 | +10% $350 |
|---|---|---|---|---|---|
| Rent | -10% $292 | -5% $438 | +0% $585 | +5% $732 | +10% $879 |
| Rate | -1.0pp $756 | -0.5pp $672 | base $585 | +0.5pp $497 | +1.0pp $407 |
2-unit breakdown (identical units grouped — click to expand)
| Units | Beds | Baths | Est. rent |
|---|---|---|---|
| 2× units | 2 | 1 | $3,716 |
| #1 | 2 | 1 | $1,858 |
| #2 | 2 | 1 | $1,858 |
| Total (2 units) | $3,715 | ||
UW: 25.0% down · 7.5% · 30yr · 1.5% tax · 5.0% vac · 8.0% maint · 8.0% mgmt
Financing live
Cash to close
- Down payment
- $85,000
- Closing costs
- $10,200
- Reserves months
- —
- Total cash needed
- —
Loan-product check · same deal, 3 products live
Conventional
25% down · 7.5% · 30yr
- Down + closing
- —
- Monthly P&I
- —
- Monthly cashflow
- —
- DSCR
- —
- Eligible?
- —
Personal DTI + credit; lowest rate.
DSCR
20% down · 8.5% · 30yr
- Down + closing
- —
- Monthly P&I
- —
- Monthly cashflow
- —
- DSCR
- —
- Eligible?
- —
No personal income docs; deal must DSCR.
Hard money
10% down · 12.0% · 12mo
- Down + closing
- —
- Monthly P&I
- —
- Monthly cashflow
- —
- DSCR
- —
- Eligible?
- —
Short-term bridge; refi at stabilization.
Listing history 7 events
-
2026-06-16status $340,000 Pending 6 DOM
-
2026-06-15days on market $340,000 Active 6 DOM
-
2026-06-14remarks 355-char remark
-
2026-06-14days on market $340,000 Active 4 DOM
-
2026-06-13days on market $340,000 Active 3 DOM
-
2026-06-10remarks 283-char remark
-
2026-06-10$340,000 Active 1 DOM
ⓘ Source: listings_history table (triggers on properties + properties_extension) + one-shot
backfill from property_details.listing_events for pre-trigger history.
Climate risk First Street
- Flood 1/10 Low FEMA zone X (unshaded) · 0% chance over 30 yrs
- Wildfire 4/10 Moderate
- Heat 5/10 Major 7 d/yr ≥99°F today · 15 d/yr by 30 yrs out
- Wind 4/10 Moderate 19% chance of damaging wind over 30 yrs
- Air quality 2/10 Low 1 unhealthy d/yr today · 2 by 30 yrs out
Nearby sold comps map
Loading sold comps map…
Walkable amenities ~0.75 mi
Loading nearby amenities…
Taxation est. · year 1
- Rental income
- $44,580
- − Mortgage interest
- −$19,045
- − Property taxes
- −$5,100
- − Insurance
- −$1,700
- − Repairs & maintenance
- −$3,566
- − Management
- −$3,566
- − Depreciation
- −$9,891
- Taxable income
- $1,711
- Est. tax owed @ 24.0%
- −$411
- After-tax cash flow
- $6,612/yr
For passive investors: Depreciation is non-cash, so a rental often shows a tax loss while cash-flowing — sheltering income. Rental losses are passive: they offset passive income freely, and up to $25,000/yr can offset ordinary (W-2) income if you actively participate and your MAGI is under $100k (phasing out to $0 by $150k); unused losses carry forward. On sale, claimed depreciation is recaptured at up to 25%, and gains may owe capital-gains tax (a 1031 exchange can defer both). Figures are a year-1 estimate at your 24.0% rate — not tax advice; consult a CPA.
Condition & rehab AI · 11 photos
This 2-unit detached home is in good condition with modern amenities and a solid structure. It's a good candidate for cosmetic updates to enhance its curb appeal and resale value.
Value-add opportunities
- Both paint exterior — enhances curb appeal and resale value
- Both replace old windows — improves energy efficiency and aesthetics
Renovation cost estimate screening
Value-add ROI direction
- Both paint exterior — enhances curb appeal and resale value ↑
- Both replace old windows — improves energy efficiency and aesthetics ↑
ⓘ Cost ranges are severity-bucket heuristics (US national rule-of-thumb). Get contractor quotes + a written scope before underwriting a rehab budget.
Schools (NCES district)
- District
- East Penn SD
- NCES district ID
- 4208550
- Math proficiency
- 43% ▼ -11.00%
- Reading proficiency
- 65% ▼ -9.00%
- Median HH income
- $70,679
- Composite
- 47.99/100
- National rank
- #2200
- State rank
- #103 of 539 in PA
Livability — Emmaus
- Score
- 86/100
- State rank
- #61
- US rank
- #424
Category grades
Schools grade is shown separately in the Schools card above.
Census & demographics
- Census place
- Emmaus, PA
- County
- Lehigh County · 333,019 people
- City population
- 18,941
- Metro
- Allentown-Bethlehem-Easton, PA-NJ
- Population (ZIP)
- 18,941
- Household income
- $93,694
- Rent vs Own
- Severe rent burden
- 645.0
Population outlook (Lehigh County) Hauer SSP2
- Today (2025)
- 392,957 people
- By 2030
- 408,319 · +3.9%
- By 2040
- 440,007 · +12.0%
- By 2050
- 475,940 · +21.1%
- By 2075
- 590,448 · +50.3%
- By 2100
- 690,314 · +75.7%
Race, ethnicity, and origin ACS 2023
- Neighborhood character
- Predominantly White (86%)
- Race & ethnicity
- White 86% Hispanic / Latino 8% Two or more races 4% Asian 2% Black 1%
- Hispanic origin (detail)
- Puerto Rican 3%
- Common ancestry
- Romanian 4% Polish 3% Lithuanian 3%
- Foreign-born
- 5% · Canada, South Korea
- Languages at home
- 91% English-only · Spanish 4% Arabic 3% Other Indo-European 1%
Political lean MEDSL · Lehigh
- 2024 margin
- Toss-up / Even · D 50.7% · R 48.0% · Other 1.2%
- 2008→2024 swing
- -12.9pp toward R · 2008: 15.6pp · 2024: 2.7pp
- All cycles
- 2024: D+2.7 2020: D+7.6 2016: D+4.4 2012: D+7.5 2008: D+15.6
Not yet ingested
- Civics
- —
Market trends
- HPI YoY
- ▼ -192.33%
- Current HPI
- 263.1517
- Rent YoY
- ▲ 6.18%
- Metro
- Allentown-Bethlehem-Easton, PA-NJ
- State GDP YoY
- ▲ 1.68%
- F500 in state
- 34
Industry mix (Fortune 500 HQ in PA)
| Industry | F500 HQs | Revenue |
|---|---|---|
| Healthcare | 2 | $309B |
|
||
| Insurance | 2 | $27B |
|
||
| Telecommunications / Media | 1 | $124B |
|
||
| Industrial Distribution | 1 | $22B |
|
||
| Financial Services | 1 | $20B |
|
||
| Chemicals / Materials | 1 | $18B |
|
||
Price history
1 event — show timeline
- 2026-06-09 Listed $340,000 GLVRMLS
Cash-flow waterfall
monthlySold comps — $/sqft
last 12 mo · ≤1 miLoading sold comps…