8250 Lankershim Blvd #29 · Los Angeles, CA
Flood risk 1/10 · Minimal
- FEMA flood zone
- X (unshaded)
- Chance of flooding over 30 yrs
- 0.0%
- Est. flood insurance / yr
- $507 – $1,088
Fire risk 1/10 · Minimal
- Est. fire insurance / yr
- $659 – $1,223
Heat risk 7/10 · Major
- Hot days now (above 96°F)
- 7 days/yr
- Hot days in 30 yrs
- 21 days/yr
Wind risk 1/10 · Minimal
- Chance of severe wind over 30 yrs
- —
Air-quality risk 5/10 · Moderate
- Unhealthy air days now
- 7 days/yr
- Unhealthy air days in 30 yrs
- 9 days/yr
Risk factors via First Street. Map © Google.
Why this score? — see what drove the B grade
The composite is a weighted blend of 9 inputs, each scored 0–100. Each bar is that input's sub-score; the figure is the points it added to the 100-point composite (weight × sub-score).
- Cash flow +30.0/30.0
- 1% rule +10.0/10.0
- DSCR +10.0/10.0
- ARV discount +7.5/15.0
- Condition / age +4.0/5.0
- Schools +3.6/10.0
- Livability +3.4/5.0
- Rent growth +1.8/5.0
- Appreciation +0.0/10.0
$114,950
🖨 Deal sheet 📄 Offer letter ✓ Due diligence
Listing remarks
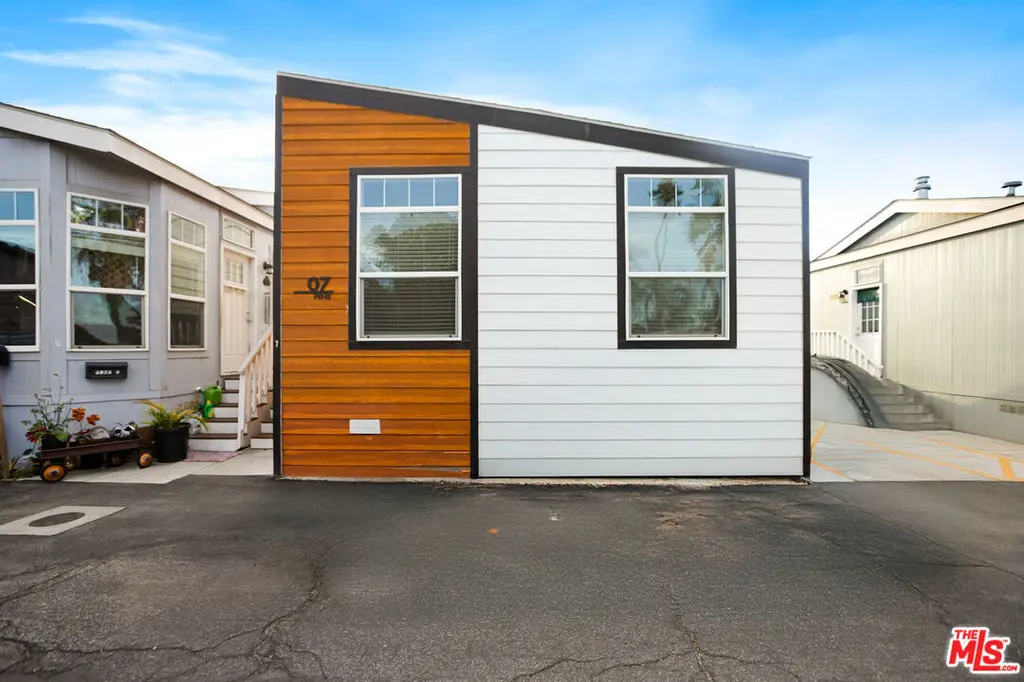
Welcome to this beautiful 2021 Fleetwood 2-bedroom, 1-bathroom home located in North Hollywood, in the highly desirable Hollywood Backlot Bungalows mobile home park. This modern home features a spacious, open layout with contemporary finishes throughout, and comes fully equipped with all appliances, central A/C, and a convenient in-home washer and dryer. Enjoy resort-style amenities including a sparkling pool, relaxing spa, fully equipped gym, clubhouse, outdoor BBQ area, and a dog park. With an affordable monthly space rent of just $1,495, this is an incredible opportunity to own in a prime North Hollywood location. Don t miss out!
Key facts
- Dog park
- Relaxing spa
- Clubhouse
Tags
Property features AI
Finance
- Other: Lot size approximately 9.63 acres; Zoning: LARMP
- Financial info: Monthly site/lot lease amount: $1,495; Annual land lease amount: $17,940; 182 total units in the community
- HOA & community: Gated community; Exercise room; Spa; Pool; Clubhouse; Association allows pets
Exterior
- Parking: Driveway parking; 1 additional open parking space
- Home design: Residential mobile home; Located on Lankershim Boulevard
- Exterior features: Community pool; Has a view
Interior
- Kitchen: Refrigerator; Dishwasher
- Flooring: Laminate floors
- Bathrooms: 1 full bathroom
- Heating & cooling: Central heating; Central cooling
- Interior features: Breakfast area; Living room; Community has a pool and clubhouse (see HOA section for community amenities)
- Laundry & utility: Washer and dryer; Laundry located in closet
Neighborhood map
What this means for you Summary
Snapshot
- This is a 2-bed/1.0-bath manufactured listed at $115k. Condition is rated good.
Deal economics
- At list price, monthly cash flow is $863 ($10k/yr) — positive.
- The deal already cash-flows at list — no discount required.
- Meets the 1% rule at list price ($2k rent vs $115k).
- Recommended offer: $101k (12.0% below list) — sets the bar for market timing.
- Cap rate 15.3% vs local median 2.1% in Los Angeles — top-decile yield for the area; either an underpriced asset or a hidden risk that comps aren't pricing in. Stress-test before assuming the spread holds.
Location & tenants
- Location reads 68/100 on livability (#273 in CA) — a middle-class / working-renter tenant base. Strengths: amenities A+, commute A+, employment B; Watch: health & safety C-, schools D+, crime F.
- Los Angeles Unified (urban): math 29% / reading 54% proficiency, ranked #223 of 517 in CA (top 43%) — families likely to look elsewhere, expect single-tenant / working-renter base with shorter leases; 67% free/reduced lunch — lower-income household profile, screen leases tightly.
- Market conditions: Rents soft (-3.0%/yr); 75 active listings in the ZIP; 21 comparable units currently listed for rent nearby; rentals lingering (median 44d on market — plan ~5-8 weeks vacancy on turnover, expect pricing pressure); 57% of comp listings sitting > 30 days — soft ceiling on asking rent; 19,697 units permitted in Los Angeles County in 2024 (9,426 in 5+ unit buildings).
- This rent runs 38% of the median local income ($65k/yr) — at the standard rent-burdened threshold; future hikes will face affordability resistance.
Forward outlook
- Local home prices are declining (-3.0%/yr); year-one equity from $794 of loan paydown is wiped out by about $3k of value loss. Plan a longer hold.
- Los Angeles County population projected at +9% by 2050 — modest demand growth; plan on rents tracking national, not racing it.
- At projected returns (-3.0% appreciation + 0.0% rent growth), your $32k cash investment doubles in ~5 years — after that, you're playing with house money.
Negotiation context
- It's been on market 286 days — a 12% lower offer ($101k) is reasonable based on typical stale-listing flexibility.
- 3 sale attempts with the ask held roughly flat each time — persistent listings suggest the price (not the market) is what's stuck; bring a comps-based counter.
Risks & watch-outs
- Climate carrying-cost: extreme-heat days projected 7→21/yr by 2055 (HVAC capex compounding) — expect insurance premiums to compound above CPI over the hold.
Questions for the listing agent
- It's been on market 286 days. Have you received any prior offers? Is the seller open to a 12% concession, seller financing, or rate buy-down credit?
- Why hasn't it sold? Are there any deal-killer items the seller is aware of (foundation, flood, title, zoning, code violations)?
- Is there a deadline driving the sale (1031 exchange, divorce, estate, relocation)? That informs how much negotiation room exists.
- Schools are D-rated, which usually means shorter tenancies and higher turnover. Who's the typical renter profile here, and what's been the actual vacancy rate?
- Crime grade is F in this area — have there been break-ins, vandalism, or insurance claims at this property in the last 3 years? What carrier currently insures it and at what premium?
- What's the average days-on-market for RENTAL listings here right now (not sales)? A rising rental-DOM trend means longer vacancies and softer asking-rent achievability than the comps imply.
- What's the recent tenant-quality profile in this submarket — average credit score on applications, eviction rate, late-payment / NSF rate, and stable-employment percentage? A property-management company in the area should have these aggregated.
- How much new for-sale + rental construction is in the pipeline within 1–3 miles? Heavy new supply typically softens prices + rents 12–24 months out; constrained supply supports both.
Investment metrics
- 1% rule
- 1.82% ✓
- Cap rate
- 15.30%
- Cash-on-cash
- 32.16%
- DSCR
- 2.43
- GRM
- 4.6
CMA / ARV
No comps found within radius.
Projected returns pro-forma
-3.0% appreciation · 0.0% rent growth · sell at horizon
- IRR
- 23.7%
- Equity multiple
- 1.94×
- Total profit
- $30,195
- Equity at exit
- $17,139
- IRR
- 29.6%
- Equity multiple
- 3.28×
- Total profit
- $73,406
- Equity at exit
- $9,939
Cash invested: $32,186 (down + closing). Projections, not guarantees.
Landlord ↔ Tenant lean methodology
- Overall (CITY)
- 0 Strongly Tenant-Friendly
- State California
- 18 Strongly Tenant-Friendly · D+13
- County
- — inherits STATE
- City Los Angeles
- 0 Strongly Tenant-Friendly · D+22
ZIP-level market 91605
- Rents YoY
- -3.0%
- Active inventory
- 75
- Price-to-rent
- 4.6×
Monthly cashflow live
- Estimated rent
- $2,097 high interval (Pro) →
- Mortgage (P&I)
- −$603
- Tax est. 1.5%
- −$144 /mo · $1,724/yr
- Insurance
- −$48
- HOA
- −$0
- Vacancy / Maint / Mgmt
- −$440
- Net cashflow
- $863
Break-even live
UW: 25.0% down · 7.5% · 30yr · 1.5% tax · 5.0% vac · 8.0% maint · 8.0% mgmt
Financing live
Cash to close
- Down payment
- $28,738
- Closing costs
- $3,448
- Reserves months
- —
- Total cash needed
- —
Loan-product check · same deal, 3 products live
Conventional
25% down · 7.5% · 30yr
- Down + closing
- —
- Monthly P&I
- —
- Monthly cashflow
- —
- DSCR
- —
- Eligible?
- —
Personal DTI + credit; lowest rate.
DSCR
20% down · 8.5% · 30yr
- Down + closing
- —
- Monthly P&I
- —
- Monthly cashflow
- —
- DSCR
- —
- Eligible?
- —
No personal income docs; deal must DSCR.
Hard money
10% down · 12.0% · 12mo
- Down + closing
- —
- Monthly P&I
- —
- Monthly cashflow
- —
- DSCR
- —
- Eligible?
- —
Short-term bridge; refi at stabilization.
Rent comps 21 comps
| Address | Beds | Baths | Sqft | Rent | $/sqft | DOM | Units | Dist |
|---|---|---|---|---|---|---|---|---|
| 8139 Radford Ave North Hollywood, CA | 1.0 | 1.0 | 350 | $1,000 | $2.86 | 24d | 1 | 0.40mi |
| 7847 Beck Ave North Hollywood, CA | 2.0 | 1.0 | 675 | $2,500 | $3.70 | 22d | 1 | 0.54mi |
| 7847 Beck Ave North Hollywood, CA | 2.0 | 1.0 | 675 | $2,500 | $3.70 | 44d | 1 | 0.54mi |
| 7729 Gentry Ave North Hollywood, CA | 1.0 | 2.0 | 600 | $2,400 | $4.00 | 44d | 1 | 0.80mi |
| 7755 Laurel Canyon Blvd Unit 24 North Hollywood, CA | 1.0 | 1.0 | 700 | $2,000 | $2.86 | 44d | 1 | 0.89mi |
| 11752 Saticoy St North Hollywood, CA | 1.0 | 1.0 | 750 | $1,695 | $2.26 | 44d | 1 | 0.90mi |
| 8747 Lehigh Ave Sun Valley, CA | 1.0 | 1.0 | 650 | $2,200 | $3.38 | 44d | 1 | 0.92mi |
| 7701 Laurel Canyon Blvd North Hollywood, CA | 1.0 | 1.0 | 623 | $1,975 | $3.17 | 44d | 2 | 0.96mi |
| 11038 Arminta St Sun Valley, CA | 2.0–3.0 | 1.0–2.0 | 975 | $2,350 | $2.41 | 2d | 3 | 0.98mi |
| 11721 Runnymede St North Hollywood, CA | 1.0–3.0 | 1.0–2.0 | 954 | $2,725 | $2.86 | 15d | 2 | 1.04mi |
| 10817 White St Sun Valley, CA | 2.0 | 1.0 | 750 | $1,895 | $2.53 | 44d | 1 | 1.08mi |
| 11669 Valerio St North Hollywood, CA | 1.0 | 1.0 | 650 | $1,895 | $2.92 | 3d | 5 | 1.09mi |
| 7401 Lankershim Blvd North Hollywood, CA | 1.0–2.0 | 1.0–2.0 | 862 | $2,850 | $3.31 | 24d | 4 | 1.12mi |
| 7350 Lankershim Blvd North Hollywood, CA | 1.0 | 1.0 | 700 | $1,845 | $2.64 | 44d | 1 | 1.15mi |
| 10888 Dora St Sun Valley, CA | 2.0 | 1.0 | 500 | $2,600 | $5.20 | 44d | 1 | 1.20mi |
| 7308 Farmdale Ave North Hollywood, CA | 1.0 | 1.0 | 600 | $2,500 | $4.17 | 22d | 1 | 1.25mi |
| 12050 Sheldon St Sun Valley, CA | 1.0–2.0 | 1.0 | 560 | $1,859 | $3.32 | 17d | 3 | 1.28mi |
| 7245 Bakman Ave Unit 3 Sun Valley, CA | 2.0 | 1.0 | 750 | $2,500 | $3.33 | 8d | 1 | 1.35mi |
| 7425 Vineland Ave Unit 7425-07 Sun Valley, CA | 1.0 | 1.0 | 650 | $1,500 | $2.31 | 44d | 1 | 1.38mi |
| 8206 Wheatland Ave Sun Valley, CA | 1.0 | 1.0 | 550 | $1,800 | $3.27 | 44d | 1 | 1.40mi |
| 7436 Cleon Ave Sun Valley, CA | 2.0 | 1.0 | 620 | $2,350 | $3.79 | 44d | 1 | 1.47mi |
Listing history 18 events
-
2026-06-18days on market $114,950 Active 286 DOM
-
2026-06-17days on market $114,950 Active 285 DOM
-
2026-06-16days on market $114,950 Active 284 DOM
-
2026-06-15days on market $114,950 Active 283 DOM
-
2026-06-13days on market $114,950 Active 281 DOM
-
2026-06-09days on market $114,950 Active 277 DOM
-
2026-06-08days on market $114,950 Active 276 DOM
-
2026-06-07days on market $114,950 Active 275 DOM
-
2026-06-04days on market $114,950 Active 272 DOM
-
2026-06-03days on market $114,950 Active 271 DOM
-
2026-06-02days on market $114,950 Active 270 DOM
-
2026-06-01days on market $114,950 Active 269 DOM
-
2026-05-31days on market $114,950 Active 268 DOM
-
2026-05-22status Active
-
2026-02-12historical Backup Offers Accepted
-
2025-09-02$114,950 Active
-
2025-09-02historical
-
2025-05-13$114,950 Active
ⓘ Source: listings_history table (triggers on properties + properties_extension) + one-shot
backfill from property_details.listing_events for pre-trigger history.
Climate risk First Street
- Flood 1/10 Low FEMA zone X (unshaded) · 0% chance over 30 yrs
- Wildfire 1/10 Low
- Heat 7/10 Severe 7 d/yr ≥96°F today · 21 d/yr by 30 yrs out
- Wind 1/10 Low
- Air quality 5/10 Major 7 unhealthy d/yr today · 9 by 30 yrs out
Nearby sold comps map
Loading sold comps map…
Walkable amenities ~0.75 mi
Loading nearby amenities…
Taxation est. · year 1
- Rental income
- $25,169
- − Mortgage interest
- −$6,439
- − Property taxes
- −$1,724
- − Insurance
- −$575
- − Repairs & maintenance
- −$2,014
- − Management
- −$2,014
- − Depreciation
- −$3,344
- Taxable income
- $9,060
- Est. tax owed @ 24.0%
- −$2,174
- After-tax cash flow
- $8,176/yr
For passive investors: Depreciation is non-cash, so a rental often shows a tax loss while cash-flowing — sheltering income. Rental losses are passive: they offset passive income freely, and up to $25,000/yr can offset ordinary (W-2) income if you actively participate and your MAGI is under $100k (phasing out to $0 by $150k); unused losses carry forward. On sale, claimed depreciation is recaptured at up to 25%, and gains may owe capital-gains tax (a 1031 exchange can defer both). Figures are a year-1 estimate at your 24.0% rate — not tax advice; consult a CPA.
Condition & rehab AI · 12 photos
This 2021 Fleetwood home in Hollywood Backlot Bungalows is in excellent condition with modern finishes and amenities. It's move-in ready and offers a great opportunity for both resale and rental.
Value-add opportunities
- Both Painting exterior and interior walls — Fresh paint enhances curb appeal and interior aesthetics
- Both Landscaping and curb appeal improvements — Enhances curb appeal and can attract more renters
- Both Add smart home features — Improves convenience and can increase both resale and rental value
Renovation cost estimate screening
Value-add ROI direction
- Both Painting exterior and interior walls — Fresh paint enhances curb appeal and interior aesthetics ↑
- Both Landscaping and curb appeal improvements — Enhances curb appeal and can attract more renters ↑
- Both Add smart home features — Improves convenience and can increase both resale and rental value ↑
ⓘ Cost ranges are severity-bucket heuristics (US national rule-of-thumb). Get contractor quotes + a written scope before underwriting a rehab budget.
Schools (NCES district)
- District
- Los Angeles Unified
- NCES district ID
- 0622710
- Math proficiency
- 29% ▼ -4.00%
- Reading proficiency
- 54% ▲ 10.00%
- Median HH income
- $50,403
- Composite
- 35.67/100
- National rank
- #4875
- State rank
- #223 of 517 in CA
Livability — Los Angeles
- Score
- 68/100
- State rank
- #273
- US rank
- #9237
Category grades
Schools grade is shown separately in the Schools card above.
Census & demographics
- Census place
- Los Angeles, CA
- County
- Los Angeles County · 9,444,647 people
- City population
- 3,838,149
- Metro
- Los Angeles-Long Beach-Anaheim, CA
- Population (ZIP)
- 49,868
- Household income
- $65,481
- Rent vs Own
- Severe rent burden
- 3600.0
Population outlook (Los Angeles County) Hauer SSP2
- Today (2025)
- 10,940,515 people
- By 2030
- 11,256,481 · +2.9%
- By 2040
- 11,729,929 · +7.2%
- By 2050
- 11,948,407 · +9.2%
- By 2075
- 11,818,114 · +8.0%
- By 2100
- 10,842,928 · -0.9%
Race, ethnicity, and origin ACS 2023
- Neighborhood character
- Majority Hispanic (62%)
- Race & ethnicity
- Hispanic / Latino 62% White 26% Two or more races 22% Asian 8% Black 2% Native American 1%
- Hispanic origin (detail)
- Mexican 35%
- Common ancestry
- Lithuanian 1% Romanian 1%
- Foreign-born
- 47% · Canada, South Korea, Vietnam
- Languages at home
- 23% English-only · Spanish 55% Other Indo-European 15% Tagalog/Filipino 3%
Political lean MEDSL · Los Angeles
- 2024 margin
- Solid D (+32.9) · D 64.8% · R 31.9% · Other 3.3%
- 2008→2024 swing
- -7.4pp toward R · 2008: 40.4pp · 2024: 32.9pp
- All cycles
- 2024: D+32.9 2020: D+44.2 2016: D+48.0 2012: D+40.0 2008: D+40.4
Not yet ingested
- Civics
- —
Market trends
- HPI YoY
- ▼ -991.52%
- Current HPI
- 504.7685
- Rent YoY
- ▼ -2.95%
- Metro
- Los Angeles-Long Beach-Anaheim, CA
- State GDP YoY
- ▲ 3.21%
- F500 in state
- 116
Industry mix (Fortune 500 HQ in CA)
| Industry | F500 HQs | Revenue |
|---|---|---|
| Technology | 27 | $1,492B |
|
||
| Financial Services | 3 | $174B |
|
||
| Retail | 3 | $44B |
|
||
| Insurance | 3 | $26B |
|
||
| Media / Entertainment | 2 | $115B |
|
||
| Pharmaceuticals / Biotech | 2 | $62B |
|
||
Price history
+0.0% since first listed5 events — show timeline
- 2026-05-22 Relisted — TheMLS
- 2026-02-12 Contingent — TheMLS
- 2025-09-02 Listing Removed — CRMLS
- 2025-09-02 Listed $114,950 TheMLS
- 2025-05-13 Listed $114,950 CRMLS
Cash-flow waterfall
monthlySold comps — $/sqft
last 12 mo · ≤1 miLoading sold comps…