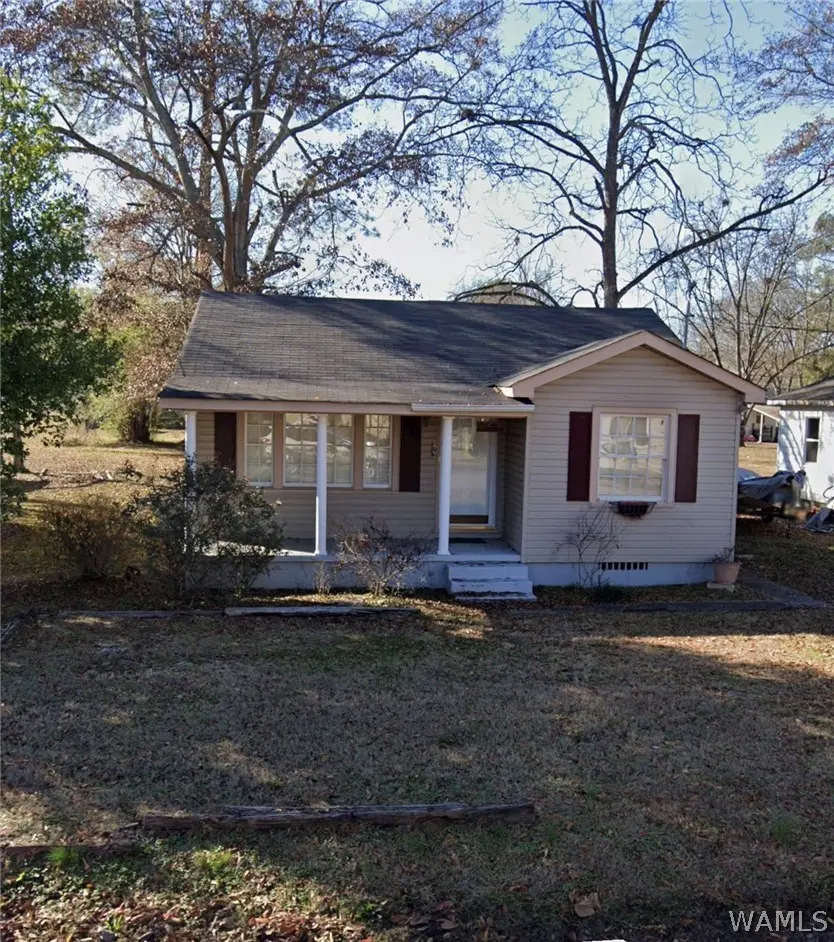
919 3rd Ave Ave NE · Fayette, AL
Flood risk 1/10 · Minimal
- FEMA flood zone
- X (unshaded)
- Chance of flooding over 30 yrs
- 0.0%
- Est. flood insurance / yr
- $507 – $1,088
Fire risk 3/10 · Minor
- Est. fire insurance / yr
- $916 – $1,700
Heat risk 6/10 · Moderate
- Hot days now (above 108°F)
- 7 days/yr
- Hot days in 30 yrs
- 20 days/yr
Wind risk 6/10 · Moderate
- Chance of severe wind over 30 yrs
- 27.0%
Air-quality risk 2/10 · Minimal
- Unhealthy air days now
- 1 days/yr
- Unhealthy air days in 30 yrs
- 2 days/yr
Risk factors via First Street. Map © Google.
Why this score? — see what drove the C+ grade
The composite is a weighted blend of 9 inputs, each scored 0–100. Each bar is that input's sub-score; the figure is the points it added to the 100-point composite (weight × sub-score).
- Cash flow +30.0/30.0
- DSCR +10.0/10.0
- 1% rule +8.1/10.0
- ARV discount +4.9/15.0
- Livability +3.2/5.0
- Rent growth +2.5/5.0
- Schools +2.5/10.0
- Condition / age +2.5/5.0
- Appreciation +0.0/10.0
$87,500
🖨 Deal sheet 📄 Offer letter ✓ Due diligence
Listing remarks
Looking for an affordable move in ready house? Look no further, this 3 bedroom 1 bath house would make a wonderful starter home for someone or the perfect house to downsize into. Call today for a showing! One of the sellers is a licensed real estate agent in the State of Alabama.
Key facts
- 6,970 sq ft lot
- Built 1945
- Listed 10 days
Property features AI
Exterior
- Parking: Gravel driveway
- Utilities: Sewer connected
- Home design: Single-family residence; One level
- Construction: Vinyl siding; Composition/shingle roof
- Exterior features: Paved road access
Interior
- Bedrooms: Laundry located on the main level
- Bathrooms: 1 full bathroom
- Heating & cooling: Heating present; Cooling present
- Interior features: Gas water heater; No fireplace
- Laundry & utility: Main-level laundry
Neighborhood map
What this means for you Summary
Snapshot
- This is a 3-bed/1.0-bath single-family listed at $88k.
Deal economics
- At list price, monthly cash flow is $376 ($5k/yr) — positive.
- The deal already cash-flows at list — no discount required.
- Meets the 1% rule at list price ($1k rent vs $88k).
- Cap rate 11.4% vs local median 6.0% in Fayette — top-decile yield for the area; either an underpriced asset or a hidden risk that comps aren't pricing in. Stress-test before assuming the spread holds.
Location & tenants
- Location reads 64/100 on livability (#158 in AL) — a middle-class / working-renter tenant base. Strengths: cost of living A+, housing A+, crime A-; Watch: health & safety D, amenities F, commute F.
- Fayette County (rural): math 17% / reading 44% proficiency, ranked #71 of 129 in AL (top 55%) — families likely to look elsewhere, expect single-tenant / working-renter base with shorter leases.
- Zoned schools: Fayette Elementary School (math 17% / reading 47%, grade F, #331 of 627 statewide, top 57%, 466 students, 75% FRL); Fayette Middle School (math 14% / reading 41%, grade F, #144 of 257 statewide, top 57%, 341 students, 76% FRL); Fayette County High School (math 27% / reading 27%, grade F, #90 of 305 statewide, top 35%, 387 students, 64% FRL) — zoned schools average 72% FRL vs 50% district-wide (22 pts higher); higher-poverty schools than district average — tighter screening recommended.
- Market conditions: 61 active listings in the ZIP.
Forward outlook
- Local home prices are declining (-3.0%/yr); year-one equity from $605 of loan paydown is wiped out by about $3k of value loss. Plan a longer hold.
- Fayette County population projected at -21% by 2050 — secular population decline; favor cash flow + early exit over multi-decade hold.
- At projected returns (-3.0% appreciation + 3.0% rent growth), your $24k cash investment doubles in ~7 years — after that, you're playing with house money.
Negotiation context
- Only 11 days on market — expect competitive offers; lowballing is unlikely to land.
Risks & watch-outs
- Watch-outs: built in 1945 — expect roof / HVAC / electrical / plumbing capex.
- Climate carrying-cost: major wind risk, 27% chance of damaging wind over 30y; extreme-heat days projected 7→20/yr by 2055 (HVAC capex compounding) — expect insurance premiums to compound above CPI over the hold.
Questions for the listing agent
- Built in 1945 — when were the roof, HVAC, electrical panel, plumbing, and water heater last replaced?
- Is there a deadline driving the sale (1031 exchange, divorce, estate, relocation)? That informs how much negotiation room exists.
- Schools are D-rated, which usually means shorter tenancies and higher turnover. Who's the typical renter profile here, and what's been the actual vacancy rate?
- What's the average days-on-market for RENTAL listings here right now (not sales)? A rising rental-DOM trend means longer vacancies and softer asking-rent achievability than the comps imply.
- What's the recent tenant-quality profile in this submarket — average credit score on applications, eviction rate, late-payment / NSF rate, and stable-employment percentage? A property-management company in the area should have these aggregated.
- How much new for-sale + rental construction is in the pipeline within 1–3 miles? Heavy new supply typically softens prices + rents 12–24 months out; constrained supply supports both.
Investment metrics
- 1% rule
- 1.31% ✓
- Cap rate
- 11.44%
- Cash-on-cash
- 18.40%
- DSCR
- 1.82
- GRM
- 6.4
CMA / ARV
- ARV (on-the-fly)
- $82,800
- Comps found
- 9
Show comp detail 9 sales within ~0.75 mi
| Address | Dist | Beds/Ba | Sqft | Sold | Price | $/sf | Match |
|---|---|---|---|---|---|---|---|
| 110 NW 9 Th St | 0.13mi | 3/1.0 | 1,084 (+5%) | 6mo | $125,000 | $115 | 81 |
| 622 2nd Ave NE | 0.27mi | 2/1.0 (-1) | 1,004 (-3%) | 6mo | $80,000 | $80 | 72 |
| 824 NE 2nd Ave | 0.08mi | 2/1.0 (-1) | 1,082 (+4%) | 16mo | $75,000 | $69 | 70 |
| 932 3rd Ave NE | 0.03mi | 2/2.0 (-1) | 1,128 (+9%) | 18mo | $10,000 | $9 | 60 |
| 342 NE 5th St | 0.34mi | 3/1.0 | 1,092 (+6%) | 21mo | $138,900 | $127 | 57 |
| 1429 NW 2nd Ave | 0.60mi | 2/1.5 (-1) | 984 (-5%) | 1mo | $60,000 | $61 | 56 |
| 109 NW 14 Th St | 0.60mi | 2/1.0 (-1) | 960 (-7%) | 9mo | $47,500 | $49 | 47 |
| 329 NW 14th St | 0.72mi | 3/1.0 | 1,125 (+9%) | 17mo | $122,900 | $109 | 38 |
| 315 NW 14 Th St | 0.71mi | 2/1.0 (-1) | 912 (-12%) | 10mo | $99,000 | $109 | 34 |
Match score weights: distance 35% · size 25% · config 20% · recency 20%. Top-matched comps best support the ARV.
Projected returns pro-forma
-3.0% appreciation · 3.0% rent growth · sell at horizon
- IRR
- 10.1%
- Equity multiple
- 1.40×
- Total profit
- $9,718
- Equity at exit
- $13,047
- IRR
- 19.1%
- Equity multiple
- 2.60×
- Total profit
- $39,149
- Equity at exit
- $7,565
Cash invested: $24,500 (down + closing). Projections, not guarantees.
Landlord ↔ Tenant lean methodology
- Overall (STATE)
- 90 Strongly Landlord-Friendly
- State Alabama
- 90 Strongly Landlord-Friendly · R+15
- County
- — inherits STATE
- City
- — inherits STATE
ZIP-level market 35555
- Home prices YoY
- -18.1%
- Active inventory
- 61
- Price-to-rent
- 6.4×
Monthly cashflow live
- Estimated rent
- $1,144 medium interval (Pro) →
- Mortgage (P&I)
- −$459
- Tax from tax record
- −$33 /mo · $391/yr
- Insurance
- −$36
- HOA
- −$0
- Vacancy / Maint / Mgmt
- −$240
- Net cashflow
- $376
Break-even live
UW: 25.0% down · 7.5% · 30yr · 1.5% tax · 5.0% vac · 8.0% maint · 8.0% mgmt
Financing live
Cash to close
- Down payment
- $21,875
- Closing costs
- $2,625
- Reserves months
- —
- Total cash needed
- —
Loan-product check · same deal, 3 products live
Conventional
25% down · 7.5% · 30yr
- Down + closing
- —
- Monthly P&I
- —
- Monthly cashflow
- —
- DSCR
- —
- Eligible?
- —
Personal DTI + credit; lowest rate.
DSCR
20% down · 8.5% · 30yr
- Down + closing
- —
- Monthly P&I
- —
- Monthly cashflow
- —
- DSCR
- —
- Eligible?
- —
No personal income docs; deal must DSCR.
Hard money
10% down · 12.0% · 12mo
- Down + closing
- —
- Monthly P&I
- —
- Monthly cashflow
- —
- DSCR
- —
- Eligible?
- —
Short-term bridge; refi at stabilization.
Listing history 11 events
-
2026-06-19days on market $87,500 Active 11 DOM
-
2026-06-18days on market $87,500 Active 10 DOM
-
2026-06-17days on market $87,500 Active 9 DOM
-
2026-06-17price $87,500 Active 8 DOM
-
2026-06-16days on market $89,900 Active 8 DOM
-
2026-06-15days on market $89,900 Active 7 DOM
-
2026-06-14days on market $89,900 Active 5 DOM
-
2026-06-12days on market $89,900 Active 4 DOM
-
2026-06-09remarks 283-char remark
-
2026-06-09remarks 204-char remark
-
2026-06-09$89,900 Active 1 DOM
ⓘ Source: listings_history table (triggers on properties + properties_extension) + one-shot
backfill from property_details.listing_events for pre-trigger history.
Tax reassessment forecast AL · Resets to sale price
- Current annual tax
- $391 · $33/mo
- Projected year-2 tax
- $391 · $33/mo
- Expected delta
- $0/yr ($0/mo · 0.0%)
ⓘ Screening estimate from a state-policy table — verify with the county assessor before closing.
Climate risk First Street
- Flood 1/10 Low FEMA zone X (unshaded) · 0% chance over 30 yrs
- Wildfire 3/10 Moderate
- Heat 6/10 Major 7 d/yr ≥108°F today · 20 d/yr by 30 yrs out
- Wind 6/10 Major 27% chance of damaging wind over 30 yrs
- Air quality 2/10 Low 1 unhealthy d/yr today · 2 by 30 yrs out
Nearby sold comps map
Loading sold comps map…
Walkable amenities ~0.75 mi
Loading nearby amenities…
Taxation est. · year 1
- Rental income
- $13,725
- − Mortgage interest
- −$4,901
- − Property taxes
- −$391
- − Insurance
- −$438
- − Repairs & maintenance
- −$1,098
- − Management
- −$1,098
- − Depreciation
- −$2,545
- Taxable income
- $3,254
- Est. tax owed @ 24.0%
- −$781
- After-tax cash flow
- $3,727/yr
For passive investors: Depreciation is non-cash, so a rental often shows a tax loss while cash-flowing — sheltering income. Rental losses are passive: they offset passive income freely, and up to $25,000/yr can offset ordinary (W-2) income if you actively participate and your MAGI is under $100k (phasing out to $0 by $150k); unused losses carry forward. On sale, claimed depreciation is recaptured at up to 25%, and gains may owe capital-gains tax (a 1031 exchange can defer both). Figures are a year-1 estimate at your 24.0% rate — not tax advice; consult a CPA.
Schools (NCES district)
- District
- Fayette County
- NCES district ID
- 0101470
- Math proficiency
- 17% ▼ -25.00%
- Reading proficiency
- 44% ▼ -1.00%
- Median HH income
- $34,767
- Composite
- 25.06/100
- National rank
- #7540
- State rank
- #71 of 129 in AL
Livability — Fayette
- Score
- 64/100
- State rank
- #158
- US rank
- #14298
Category grades
Schools grade is shown separately in the Schools card above.
Census & demographics
- Census place
- Fayette, AL
- Population (ZIP)
- 9,689
Population outlook (Fayette County) Hauer SSP2
- Today (2025)
- 15,631 people
- By 2030
- 14,975 · -4.2%
- By 2040
- 13,604 · -13.0%
- By 2050
- 12,302 · -21.3%
- By 2075
- 9,599 · -38.6%
- By 2100
- 7,282 · -53.4%
Race, ethnicity, and origin ACS 2023
- Neighborhood character
- Predominantly White (78%)
- Race & ethnicity
- White 78% Black 19% Two or more races 3%
- Common ancestry
- Slovak 1% Italian 1% Lithuanian 1%
- Foreign-born
- 1% · Canada
Political lean MEDSL · Fayette
- 2024 margin
- Solid R (+72.0) · D 13.7% · R 85.7%
- 2008→2024 swing
- -23.1pp toward R · 2008: -48.9pp · 2024: -72.0pp
- All cycles
- 2024: R+72.0 2020: R+67.4 2016: R+65.2 2012: R+53.5 2008: R+48.9
Not yet ingested
- Civics
- —
Market trends
- HPI YoY
- ▼ -42.04%
- Current HPI
- 190.5031
- Rent YoY
- —
- Metro
- —
- State GDP YoY
- ▲ 2.94%
- F500 in state
- 4
Industry mix (Fortune 500 HQ in AL)
| Industry | F500 HQs | Revenue |
|---|---|---|
| Financial Services | 1 | $8B |
|
||
| Healthcare | 1 | $5B |
|
||
Price history
1 event — show timeline
- 2026-06-08 Listed $89,900 WAMLS
Property tax history
+15.3%/yrLatest (2025): $391 · +187.8% YoY. Source: county tax records.
Cash-flow waterfall
monthlySold comps — $/sqft
last 12 mo · ≤1 miLoading sold comps…