 Multi-family
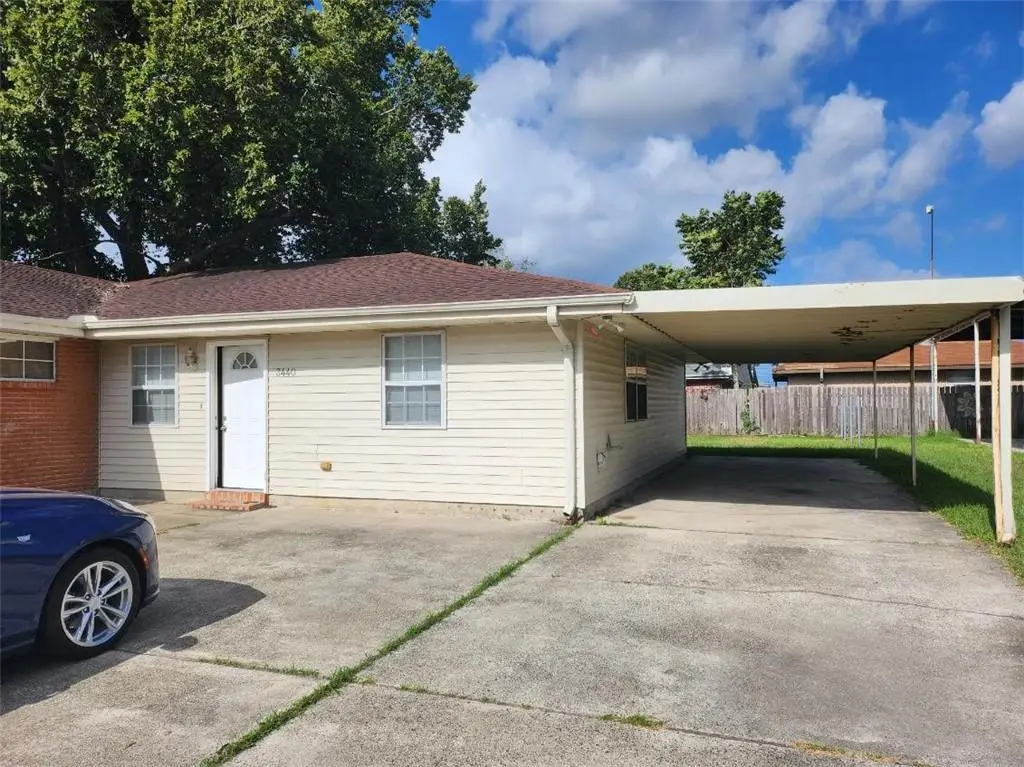
3438-40 Jackson Blvd · Chalmette, LA
Flood risk 8/10 · Major
- FEMA flood zone
- X (shaded)
- Chance of flooding over 30 yrs
- 0.6%
- Est. flood insurance / yr
- $507 – $1,088
Fire risk 1/10 · Minimal
- Est. fire insurance / yr
- $1,269 – $2,357
Heat risk 10/10 · Severe
- Hot days now (above 108°F)
- 7 days/yr
- Hot days in 30 yrs
- 22 days/yr
Wind risk 10/10 · Severe
- Chance of severe wind over 30 yrs
- 99.0%
Air-quality risk 3/10 · Minor
- Unhealthy air days now
- 3 days/yr
- Unhealthy air days in 30 yrs
- 3 days/yr
Risk factors via First Street. Map © Google.
Why this score? — see what drove the C- grade
The composite is a weighted blend of 9 inputs, each scored 0–100. Each bar is that input's sub-score; the figure is the points it added to the 100-point composite (weight × sub-score).
- Cash flow +25.2/30.0
- DSCR +8.3/10.0
- 1% rule +5.9/10.0
- Schools +5.0/10.0
- Rent growth +3.3/5.0
- Livability +3.2/5.0
- Condition / age +2.5/5.0
- ARV discount +0.0/15.0
- Appreciation +0.0/10.0
$280,000
🖨 Deal sheet (PDF) 📄 Offer letter ✓ Due diligence
Multi-family units
County records classify this as Multi-Family (2-4 Unit). Listing-text estimate: 1 unit. estimate disagrees with records
Listing remarks MLS
Investment Potential property with extra Lot or live in one side and rent the other. Lots of parking and yard space.
Key facts
- Extra lot
- Lots of parking
- Yard space
Tags
Neighborhood map
What this means for you Summary
Snapshot
- This is a multifamily listed at $280k.
Deal economics
- At list price, monthly cash flow is $563 ($7k/yr) — positive.
- The deal already cash-flows at list — no discount required.
- Meets the 1% rule at list price ($3k rent vs $280k).
- Recommended offer: $246k (12.0% below list) — sets the bar for market timing.
- Cap rate 9.0% vs local median 5.5% in Chalmette — top-decile yield for the area; either an underpriced asset or a hidden risk that comps aren't pricing in. Stress-test before assuming the spread holds.
Location & tenants
- Location reads 65/100 on livability (#137 in LA) — a middle-class / working-renter tenant base. Strengths: cost of living A+, housing A+, health & safety A; Watch: crime F, amenities F, commute F.
- Market conditions: Rents rising (+3.1%/yr); 209 active listings in the ZIP; 9 comparable units currently listed for rent nearby; rentals at typical pace (median 24d on market — plan ~3-4 weeks tenant-placement turnaround); 112 units permitted in St. Bernard Parish in 2024 (0 in 5+ unit buildings).
- At $3,062/mo this rent would consume 67% of the median local household income ($55k/yr) (locally 881% of renters already pay >50% of income on rent) — very limited rent-growth headroom before tenants either downsize or default.
Forward outlook
- Local home prices are declining (-3.0%/yr); year-one equity from $2k of loan paydown is wiped out by about $8k of value loss. Plan a longer hold.
- St. Bernard County population projected at +89% by 2050 — long-run rental-demand tailwind backs the buy-and-hold thesis.
Negotiation context
- It's been on market 339 days — a 12% lower offer ($246k) is reasonable based on typical stale-listing flexibility.
- Current owner paid $60k; list at $280k implies a 367% gain — meaningful room to come down on a strong offer.
Risks & watch-outs
- Watch-outs: flood insurance adds $66/mo.
- Climate carrying-cost: severe flood risk; severe wind risk, 99% chance of damaging wind over 30y; extreme-heat days projected 7→22/yr by 2055 (HVAC capex compounding) — expect insurance premiums to compound above CPI over the hold.
Questions for the listing agent
- It's been on market 339 days. Have you received any prior offers? Is the seller open to a 12% concession, seller financing, or rate buy-down credit?
- What's the actual annual flood-insurance premium (NFIP or private), and is the property in a SFHA with mandatory coverage?
- Why hasn't it sold? Are there any deal-killer items the seller is aware of (foundation, flood, title, zoning, code violations)?
- Is there a deadline driving the sale (1031 exchange, divorce, estate, relocation)? That informs how much negotiation room exists.
- Crime grade is F in this area — have there been break-ins, vandalism, or insurance claims at this property in the last 3 years? What carrier currently insures it and at what premium?
- What's the average days-on-market for RENTAL listings here right now (not sales)? A rising rental-DOM trend means longer vacancies and softer asking-rent achievability than the comps imply.
- What's the recent tenant-quality profile in this submarket — average credit score on applications, eviction rate, late-payment / NSF rate, and stable-employment percentage? A property-management company in the area should have these aggregated.
- How much new apartment / multifamily construction is in the pipeline within 1–3 miles? Heavy new supply (>2% of stock underway) typically softens rents 12–24 months out; light construction supports rent growth.
Investment metrics
- 1% rule
- 1.09% ✓
- Cap rate
- 8.99%
- Cash-on-cash
- 9.63%
- DSCR
- 1.43
- GRM
- 7.6
CMA / ARV
- ARV (median comp)
- $236,699
- List price
- $280,000
- Delta
- 18.29%
- Verdict
- OVERPRICED
- Comps
- 20 within 1.0 mi
Show comp detail 12 sales within ~0.75 mi
| Address | Dist | Beds/Ba | Sqft | Sold | Price | $/sf | Match |
|---|---|---|---|---|---|---|---|
| 3509-3511 Jupiter Dr | 0.09mi | 5/3.0 | 2,250 (-6%) | 2mo | $263,000 | $117 | 84 |
| 9029 31 Oz Dr | 0.16mi | 5/3.0 | 2,196 (-8%) | 17mo | $272,400 | $124 | 64 |
| 3705-07 Juno Dr | 0.22mi | 6/4.0 | 2,085 (-13%) | 10mo | $350,000 | $168 | 60 |
| 9112 14 Gladiators St | 0.32mi | 5/4.0 | 2,226 (-7%) | 18mo | $289,900 | $130 | 58 |
| 3400 Montesquieu St | 0.38mi | 6/5.0 | 2,744 (+14%) | 2mo | $419,000 | $153 | 57 |
| 3507-09 Tournefort St | 0.61mi | 6/4.0 | 2,352 (-2%) | 15mo | $410,000 | $174 | 56 |
| 3408 Rose Ave | 0.11mi | 4/3.0 | 2,048 (-15%) | 17mo | $220,000 | $107 | 56 |
| 125-27 W Philip Ct | 0.29mi | 9/5.0 | 2,100 (-12%) | 16mo | $259,000 | $123 | 53 |
| 125 27 W Philip Ct | 0.30mi | 5/3.0 | 2,100 (-12%) | 16mo | $259,000 | $123 | 52 |
| 4005-07 Jupiter Dr | 0.37mi | 5/2.5 | 2,048 (-15%) | 11mo | $230,000 | $112 | 49 |
| 3319 17 Pakenham Dr | 0.47mi | 6/5.0 | 2,690 (+12%) | 17mo | $379,000 | $141 | 44 |
| 3315 Delambert St | 0.75mi | 4/2.0 | 2,159 (-10%) | 12mo | $220,000 | $102 | 38 |
Match score weights: distance 35% · size 25% · config 20% · recency 20%. Top-matched comps best support the ARV.
Projected returns pro-forma
-3.0% appreciation · 3.11% rent growth · sell at horizon
- IRR
- -3.1%
- Equity multiple
- 0.88×
- Total profit
- $-9,205
- Equity at exit
- $41,749
- IRR
- 6.7%
- Equity multiple
- 1.50×
- Total profit
- $39,508
- Equity at exit
- $24,209
Cash invested: $78,400 (down + closing). Projections, not guarantees.
Landlord ↔ Tenant lean methodology
- Overall (STATE)
- 90 Strongly Landlord-Friendly
- State Louisiana
- 90 Strongly Landlord-Friendly · R+12
- County
- — inherits STATE
- City
- — inherits STATE
ZIP-level market 70043
- Rents YoY
- 3.1%
- Active inventory
- 209
- Price-to-rent
- 15.2×
Monthly cashflow live
- Estimated rent
- $3,062 high interval (Pro) →
- Mortgage (P&I)
- −$1,468
- Tax from tax record
- −$205 /mo · $2,459/yr
- Insurance
- −$117
- Flood insurance flood zone
- −$66 /mo · $798/yr
- HOA
- −$0
- Vacancy / Maint / Mgmt
- −$643
- Net cashflow
- $563
Break-even live
Sensitivity live
| Price | -10% $721 | -5% $642 | +0% $563 | +5% $483 | +10% $404 |
|---|---|---|---|---|---|
| Rent | -10% $321 | -5% $442 | +0% $563 | +5% $684 | +10% $804 |
| Rate | -1.0pp $704 | -0.5pp $634 | base $563 | +0.5pp $490 | +1.0pp $416 |
2-unit breakdown (identical units grouped — click to expand)
| Units | Beds | Baths | Est. rent |
|---|---|---|---|
| 2× units | 2 | 1 | $3,062 |
| #1 | 2 | 1 | $1,531 |
| #2 | 2 | 1 | $1,531 |
| Total (2 units) | $3,062 | ||
UW: 25.0% down · 7.5% · 30yr · 1.5% tax · 5.0% vac · 8.0% maint · 8.0% mgmt
Financing live
Cash to close
- Down payment
- $70,000
- Closing costs
- $8,400
- Reserves months
- —
- Total cash needed
- —
Loan-product check · same deal, 3 products live
Conventional
25% down · 7.5% · 30yr
- Down + closing
- —
- Monthly P&I
- —
- Monthly cashflow
- —
- DSCR
- —
- Eligible?
- —
Personal DTI + credit; lowest rate.
DSCR
20% down · 8.5% · 30yr
- Down + closing
- —
- Monthly P&I
- —
- Monthly cashflow
- —
- DSCR
- —
- Eligible?
- —
No personal income docs; deal must DSCR.
Hard money
10% down · 12.0% · 12mo
- Down + closing
- —
- Monthly P&I
- —
- Monthly cashflow
- —
- DSCR
- —
- Eligible?
- —
Short-term bridge; refi at stabilization.
Rent comps 9 comps
| Address | Beds | Baths | Sqft | Rent | $/sqft | DOM | Units | Dist |
|---|---|---|---|---|---|---|---|---|
| 2707 Jackson Blvd Chalmette, LA | 3.0 | 3.0 | 1733 | $2,300 | $1.33 | 44d | 1 | 0.58mi |
| 2707 Jackson Blvd Chalmette, LA | 3.0 | 2.5 | 1733 | $2,300 | $1.33 | 24d | 1 | 0.58mi |
| 8413 Benjamin Dr Chalmette, LA | 3.0 | 2.0 | 1800 | $2,300 | $1.28 | 3d | 1 | 0.75mi |
| 2518 Delambert St Chalmette, LA | 3.0 | 2.0 | 1617 | $1,825 | $1.13 | 44d | 1 | 0.98mi |
| 3708 Veronica Dr Chalmette, LA | 3.0 | 2.0 | 1818 | $2,550 | $1.40 | 2d | 1 | 1.09mi |
| 2429 Octavia Dr Chalmette, LA | 3.0 | 2.0 | 1700 | $1,575 | $0.93 | 24d | 1 | 1.28mi |
| 3012 Volpe Dr Chalmette, LA | 3.0 | 2.0 | 1812 | $2,500 | $1.38 | 44d | 1 | 1.33mi |
| 1804 Wisconsin St Chalmette, LA | 3.0 | 3.0 | 2350 | $2,000 | $0.85 | 24d | 1 | 1.47mi |
| 424 Chinchilla Dr Arabi, LA | 3.0 | 2.0 | 1735 | $3,500 | $2.02 | 16d | 1 | 1.48mi |
Listing history 18 events
-
2026-06-18days on market $280,000 Active 339 DOM
-
2026-06-17days on market $280,000 Active 338 DOM
-
2026-06-16days on market $280,000 Active 337 DOM
-
2026-06-15days on market $280,000 Active 336 DOM
-
2026-06-13days on market $280,000 Active 334 DOM
-
2026-06-10days on market $280,000 Active 331 DOM
-
2026-06-09days on market $280,000 Active 330 DOM
-
2026-06-08days on market $280,000 Active 329 DOM
-
2026-06-07days on market $280,000 Active 328 DOM
-
2026-06-03days on market $280,000 Active 324 DOM
-
2026-06-02days on market $280,000 Active 323 DOM
-
2026-06-01days on market $280,000 Active 322 DOM
-
2026-05-31days on market $280,000 Active 321 DOM
-
2026-05-04status Pending 116-char remark
Show marketing remark (116 chars)
Investment Potential property with extra Lot or live in one side and rent the other. Lots of parking and yard space.
-
2026-04-09price $280,000 116-char remark
Show marketing remark (116 chars)
Investment Potential property with extra Lot or live in one side and rent the other. Lots of parking and yard space.
-
2025-06-25$285,000 Active 116-char remark
Show marketing remark (116 chars)
Investment Potential property with extra Lot or live in one side and rent the other. Lots of parking and yard space.
-
2007-08-24soldstatus $60,000
-
1993-01-11soldstatus $24,000
ⓘ Source: listings_history table (triggers on properties + properties_extension) + one-shot
backfill from property_details.listing_events for pre-trigger history.
Tax reassessment forecast LA · Resets to sale price
- Current annual tax
- $2,459 · $205/mo
- Projected year-2 tax
- $2,459 · $205/mo
- Expected delta
- $0/yr ($0/mo · 0.0%)
ⓘ Screening estimate from a state-policy table — verify with the county assessor before closing.
Climate risk First Street
- Flood 8/10 Severe FEMA zone X (shaded) · 60% chance over 30 yrs
- Wildfire 1/10 Low
- Heat 10/10 Extreme 7 d/yr ≥108°F today · 22 d/yr by 30 yrs out
- Wind 10/10 Extreme 99% chance of damaging wind over 30 yrs
- Air quality 3/10 Moderate 3 unhealthy d/yr today · 3 by 30 yrs out
Nearby sold comps map
Loading sold comps map…
Walkable amenities ~0.75 mi
Loading nearby amenities…
Taxation est. · year 1
- Rental income
- $36,744
- − Mortgage interest
- −$15,684
- − Property taxes
- −$2,459
- − Insurance
- −$2,198
- − Repairs & maintenance
- −$2,940
- − Management
- −$2,940
- − Depreciation
- −$8,145
- Taxable income
- $2,378
- Est. tax owed @ 24.0%
- −$571
- After-tax cash flow
- $6,180/yr
For passive investors: Depreciation is non-cash, so a rental often shows a tax loss while cash-flowing — sheltering income. Rental losses are passive: they offset passive income freely, and up to $25,000/yr can offset ordinary (W-2) income if you actively participate and your MAGI is under $100k (phasing out to $0 by $150k); unused losses carry forward. On sale, claimed depreciation is recaptured at up to 25%, and gains may owe capital-gains tax (a 1031 exchange can defer both). Figures are a year-1 estimate at your 24.0% rate — not tax advice; consult a CPA.
Schools (NCES district)
No district data.
Livability — Chalmette
- Score
- 65/100
- State rank
- #137
- US rank
- #12500
Category grades
Schools grade is shown separately in the Schools card above.
Census & demographics
- Census place
- Chalmette, LA
- County
- Saint Bernard Parish · 22,638 people
- City population
- 22,638
- Metro
- New Orleans-Metairie, LA
- Population (ZIP)
- 22,638
- Household income
- $55,068
- Rent vs Own
- Severe rent burden
- 881.0
Population outlook (St. Bernard County) Hauer SSP2
- Today (2025)
- 66,513 people
- By 2030
- 77,768 · +16.9%
- By 2040
- 101,296 · +52.3%
- By 2050
- 125,770 · +89.1%
- By 2075
- 188,160 · +182.9%
- By 2100
- 239,339 · +259.8%
Race, ethnicity, and origin ACS 2023
- Neighborhood character
- Diverse neighborhood (Simpson 0.61)
- Race & ethnicity
- White 55% Black 26% Hispanic / Latino 12% Two or more races 10% Asian 2%
- Hispanic origin (detail)
- Mexican 2%
- Common ancestry
- Lithuanian 13% Slovak 2%
- Foreign-born
- 6% · Canada, Vietnam
- Languages at home
- 88% English-only · Spanish 8% Arabic 1% Vietnamese 1%
Political lean MEDSL · St. Bernard
- 2024 margin
- Strong R (+29.3) · D 34.5% · R 63.8% · Other 1.7%
- 2008→2024 swing
- +16.1pp toward D · 2008: -45.4pp · 2024: -29.3pp
- All cycles
- 2024: R+29.3 2020: R+28.5 2016: R+33.4 2012: R+24.7 2008: R+45.4
Not yet ingested
- Civics
- —
Market trends
- HPI YoY
- ▼ -211.77%
- Current HPI
- 194.8123
- Rent YoY
- ▲ 3.11%
- Metro
- New Orleans-Metairie, LA
- State GDP YoY
- ▲ 3.29%
- F500 in state
- 10
Industry mix (Fortune 500 HQ in LA)
| Industry | F500 HQs | Revenue |
|---|---|---|
| Telecommunications | 2 | $23B |
|
||
| Utilities | 1 | $12B |
|
||
| Wholesale / Distribution | 1 | $5B |
|
||
| Advertising | 1 | $2B |
|
||
Price history
+1066.7% since first listed5 events — show timeline
- 2026-05-04 Pending — AcadianaMLS
- 2026-04-09 Price Changed $280,000 AcadianaMLS
- 2025-06-25 Listed $285,000 AcadianaMLS
- 2007-08-24 Sold (Public Records) $60,000 Public Records
- 1993-01-11 Sold (Public Records) $24,000 Public Records
Property tax history
+1.0%/yrLatest (2025): $2,459 · -0.7% YoY. Source: county tax records.
Cash-flow waterfall
monthlySold comps — $/sqft
last 12 mo · ≤1 miLoading sold comps…