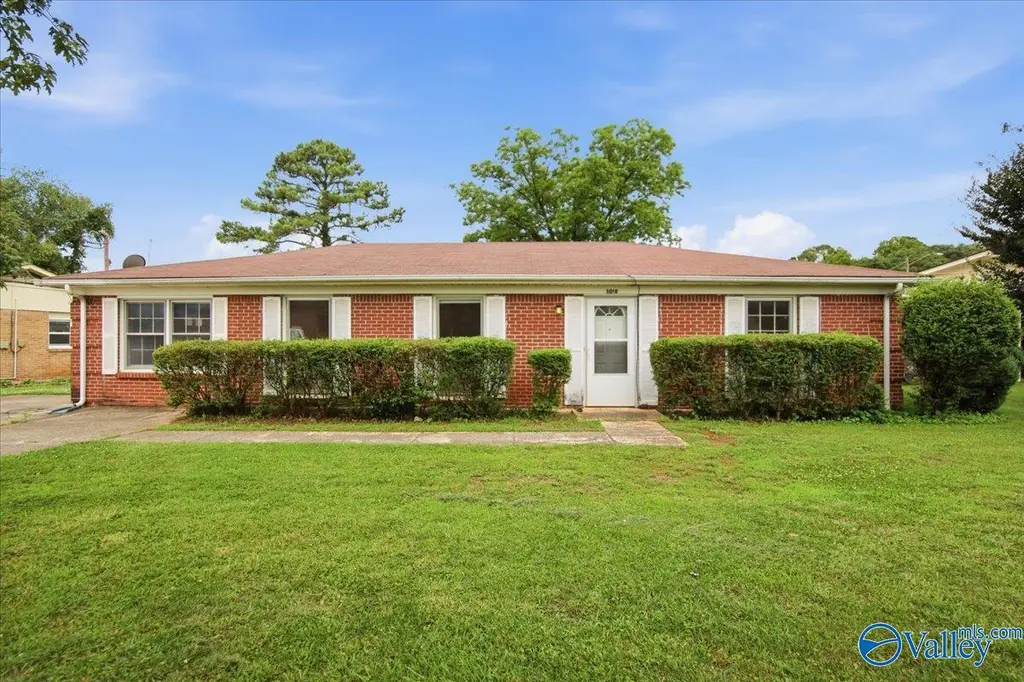
3018 Tucker Dr NW · Huntsville, AL
Flood risk 1/10 · Minimal
- FEMA flood zone
- X (unshaded)
- Chance of flooding over 30 yrs
- 0.0%
- Est. flood insurance / yr
- $507 – $1,088
Fire risk 1/10 · Minimal
- Est. fire insurance / yr
- $916 – $1,700
Heat risk 5/10 · Moderate
- Hot days now (above 105°F)
- 7 days/yr
- Hot days in 30 yrs
- 19 days/yr
Wind risk 4/10 · Minor
- Chance of severe wind over 30 yrs
- 18.0%
Air-quality risk 2/10 · Minimal
- Unhealthy air days now
- 1 days/yr
- Unhealthy air days in 30 yrs
- 1 days/yr
Risk factors via First Street. Map © Google.
Why this score? — see what drove the B+ grade
The composite is a weighted blend of 9 inputs, each scored 0–100. Each bar is that input's sub-score; the figure is the points it added to the 100-point composite (weight × sub-score).
- Cash flow +29.9/30.0
- ARV discount +15.0/15.0
- DSCR +10.0/10.0
- 1% rule +8.5/10.0
- Livability +4.1/5.0
- Schools +2.9/10.0
- Rent growth +2.5/5.0
- Condition / age +2.5/5.0
- Appreciation +0.0/10.0
$120,000
🖨 Deal sheet (PDF) 📄 Offer letter ✓ Due diligence
Listing remarks
Classic red brick exterior home evoking timeless charm and durability. The spacious backyard offers ample room for outdoor activities or potential landscaping projects, or relaxing on the screen porch. Inside, the main floor features a welcoming living room, and sitting area just off from the kitchen, plus a family room for plenty of entertaining space. The master bedroom boasts an en-suite half bath, while the two additional bathrooms are across the hall from a full bathroom. Convenient to downtown Huntsville, universities, shopping and dining. SOLD AS IS. Need some TLC. Financing: Conventional or CASH. Home perfect for Investors
Key facts
- En-suite half bath
- Red brick exterior
- Spacious backyard
Tags
Property features AI
Finance
- HOA & community: No homeowners association; Subdivision: Concord Place
Exterior
- Parking: Concrete driveway
- Utilities: Public sewer
- Home design: Single-family residence; One story; Built in 1964
- Construction: Brick construction
- Exterior features: Public water; 0.27-acre lot; Brick exterior
Interior
- Bathrooms: 1 full bathroom; 1 half bathroom
- Heating & cooling: Central heating; Central cooling
- Interior features: Crawl space basement; 9 total rooms
Neighborhood map
What this means for you Summary
Snapshot
- This is a 3-bed/1.0-bath single-family listed at $120k.
Deal economics
- At list price, monthly cash flow is $446 ($5k/yr) — positive.
- The deal already cash-flows at list — no discount required.
- Meets the 1% rule at list price ($2k rent vs $120k).
- Cap rate 10.8% vs local median 3.8% in Huntsville — top-decile yield for the area; either an underpriced asset or a hidden risk that comps aren't pricing in. Stress-test before assuming the spread holds.
Location & tenants
- Location reads 82/100 on livability (#3 in AL, #1,082 nationally) — a professional / high-income tenant draw. Strengths: commute A+, cost of living A+, housing A+; Watch: crime F.
- Huntsville City (urban): math 21% / reading 46% proficiency, ranked #48 of 129 in AL (top 37%) — families likely to look elsewhere, expect single-tenant / working-renter base with shorter leases.
- Zoned schools: James Dawson Elementary (math 0% / reading 24%, grade F, #536 of 627 statewide, top 88%, 432 students, 88% FRL); Jemison High School (math 12% / reading 12%, grade F, #242 of 305 statewide, top 80%, 843 students, 64% FRL) — zoned schools average 76% FRL vs 46% district-wide (30 pts higher); higher-poverty schools than district average — tighter screening recommended.
- Zoned-school proficiency averages 12% at this address vs 34% district-wide (-21 pts) — the specific schools serving this property underperform the Huntsville City average; the district grade overstates school quality for this exact location.
- Market conditions: Rents soft (-0.1%/yr); 337 active listings in the ZIP; 32 comparable units currently listed for rent nearby; rentals lingering (median 44d on market — plan ~5-8 weeks vacancy on turnover, expect pricing pressure); 50% of comp listings sitting > 30 days — soft ceiling on asking rent; 4,709 units permitted in Madison County in 2024 (1,186 in 5+ unit buildings).
- This rent runs 38% of the median local income ($51k/yr) — at the standard rent-burdened threshold; future hikes will face affordability resistance.
Forward outlook
- Local home prices are declining (-3.0%/yr); year-one equity from $830 of loan paydown is wiped out by about $4k of value loss. Plan a longer hold.
- Madison County population projected at +18% by 2050 — long-run rental-demand tailwind backs the buy-and-hold thesis.
Negotiation context
- Only 10 days on market — expect competitive offers; lowballing is unlikely to land.
Risks & watch-outs
- Climate carrying-cost: extreme-heat days projected 7→19/yr by 2055 (HVAC capex compounding) — expect insurance premiums to compound above CPI over the hold.
Questions for the listing agent
- Built in 1964 — when were the roof, HVAC, electrical panel, plumbing, and water heater last replaced?
- Is there a deadline driving the sale (1031 exchange, divorce, estate, relocation)? That informs how much negotiation room exists.
- Crime grade is F in this area — have there been break-ins, vandalism, or insurance claims at this property in the last 3 years? What carrier currently insures it and at what premium?
- What's the average days-on-market for RENTAL listings here right now (not sales)? A rising rental-DOM trend means longer vacancies and softer asking-rent achievability than the comps imply.
- What's the recent tenant-quality profile in this submarket — average credit score on applications, eviction rate, late-payment / NSF rate, and stable-employment percentage? A property-management company in the area should have these aggregated.
- How much new for-sale + rental construction is in the pipeline within 1–3 miles? Heavy new supply typically softens prices + rents 12–24 months out; constrained supply supports both.
Investment metrics
- 1% rule
- 1.35% ✓
- Cap rate
- 10.75%
- Cash-on-cash
- 15.93%
- DSCR
- 1.71
- GRM
- 6.2
CMA / ARV
- ARV (on-the-fly)
- $198,358
- Comps found
- 12
Show comp detail 12 sales within ~0.75 mi
| Address | Dist | Beds/Ba | Sqft | Sold | Price | $/sf | Match |
|---|---|---|---|---|---|---|---|
| 3900 Vogel Dr NW | 0.28mi | 3/1.5 | 1,628 (-3%) | 3mo | $191,500 | $118 | 77 |
| 3815 NW Jamestown Dr | 0.20mi | 3/2.0 | 1,629 (-3%) | 10mo | $193,000 | $118 | 73 |
| 3818 Jamestown Dr | 0.19mi | 4/2.5 (+1) | 1,770 (+5%) | 3mo | $249,900 | $141 | 68 |
| 3613 Bragg St NW | 0.25mi | 4/2.0 (+1) | 1,801 (+7%) | 9mo | $225,000 | $125 | 60 |
| 3306 Reynolds Dr NW | 0.60mi | 3/2.0 | 1,636 (-3%) | 5mo | $229,000 | $140 | 59 |
| 6113 Rickwood Dr NW | 0.73mi | 3/2.0 | 1,700 (+1%) | 4mo | $257,500 | $151 | 56 |
| 2416 Redmont Rd NW | 0.64mi | 4/2.0 (+1) | 1,629 (-3%) | 2mo | $135,000 | $83 | 54 |
| 3114 Leftwich St | 0.37mi | 3/1.0 | 1,476 (-12%) | 11mo | $115,000 | $78 | 54 |
| 4901 Roebuck Rd NW | 0.28mi | 4/2.0 (+1) | 1,931 (+15%) | 2mo | $225,000 | $117 | 52 |
| 3629 Greenbriar Dr | 0.62mi | 3/2.0 | 1,600 (-5%) | 10mo | $135,000 | $84 | 51 |
| 3514 Nathalee Ave | 0.75mi | 3/2.0 | 1,800 (+7%) | 2mo | $300,000 | $167 | 48 |
| 6014 Ellington Rd NW | 0.59mi | 4/2.5 (+1) | 1,792 (+7%) | 7mo | $150,000 | $84 | 44 |
Match score weights: distance 35% · size 25% · config 20% · recency 20%. Top-matched comps best support the ARV.
Projected returns pro-forma
-3.0% appreciation · 0.0% rent growth · sell at horizon
- IRR
- 3.4%
- Equity multiple
- 1.13×
- Total profit
- $4,250
- Equity at exit
- $17,892
- IRR
- 9.8%
- Equity multiple
- 1.66×
- Total profit
- $22,089
- Equity at exit
- $10,375
Cash invested: $33,600 (down + closing). Projections, not guarantees.
Landlord ↔ Tenant lean methodology
- Overall (STATE)
- 90 Strongly Landlord-Friendly
- State Alabama
- 90 Strongly Landlord-Friendly · R+15
- County
- — inherits STATE
- City
- — inherits STATE
ZIP-level market 35810
- Home prices YoY
- -23.5%
- Rents YoY
- -0.1%
- Active inventory
- 337
- Price-to-rent
- 6.2×
Monthly cashflow live
- Estimated rent
- $1,614 high interval (Pro) →
- Mortgage (P&I)
- −$629
- Tax est. 1.5%
- −$150 /mo · $1,800/yr
- Insurance
- −$50
- HOA
- −$0
- Vacancy / Maint / Mgmt
- −$339
- Net cashflow
- $446
Break-even live
Sensitivity live
| Price | -10% $529 | -5% $487 | +0% $446 | +5% $404 | +10% $363 |
|---|---|---|---|---|---|
| Rent | -10% $318 | -5% $382 | +0% $446 | +5% $510 | +10% $573 |
| Rate | -1.0pp $506 | -0.5pp $476 | base $446 | +0.5pp $415 | +1.0pp $383 |
UW: 25.0% down · 7.5% · 30yr · 1.5% tax · 5.0% vac · 8.0% maint · 8.0% mgmt
Financing live
Cash to close
- Down payment
- $30,000
- Closing costs
- $3,600
- Reserves months
- —
- Total cash needed
- —
Loan-product check · same deal, 3 products live
Conventional
25% down · 7.5% · 30yr
- Down + closing
- —
- Monthly P&I
- —
- Monthly cashflow
- —
- DSCR
- —
- Eligible?
- —
Personal DTI + credit; lowest rate.
DSCR
20% down · 8.5% · 30yr
- Down + closing
- —
- Monthly P&I
- —
- Monthly cashflow
- —
- DSCR
- —
- Eligible?
- —
No personal income docs; deal must DSCR.
Hard money
10% down · 12.0% · 12mo
- Down + closing
- —
- Monthly P&I
- —
- Monthly cashflow
- —
- DSCR
- —
- Eligible?
- —
Short-term bridge; refi at stabilization.
Rent comps 32 comps
| Address | Beds | Baths | Sqft | Rent | $/sqft | DOM | Units | Dist |
|---|---|---|---|---|---|---|---|---|
| 3415 Mimosa Ln NW Huntsville, AL | 3.0 | 2.0 | 1320 | $1,590 | $1.20 | 44d | 1 | 0.13mi |
| 3304 Caywood Dr NW Huntsville, AL | 3.0 | 1.5 | 1300 | $1,475 | $1.13 | 24d | 1 | 0.18mi |
| 3803 Mastin Lake Rd NW Huntsville, AL | 3.0 | 1.0 | 1103 | $1,295 | $1.17 | 44d | 1 | 0.30mi |
| 3423 Rosedale Dr NW Huntsville, AL | 3.0 | 1.0 | 1145 | $1,000 | $0.87 | 44d | 1 | 0.41mi |
| 3614 Wilbur Ave NW Huntsville, AL | 3.0 | 1.5 | 1196 | $1,420 | $1.19 | 24d | 1 | 0.44mi |
| 3203 Dyas Dr NW Huntsville, AL | 3.0 | 2.0 | 1346 | $2,100 | $1.56 | 24d | 1 | 0.48mi |
| 3505 Mastin Lake Rd NW Huntsville, AL | 3.0 | 2.0 | 1376 | $2,000 | $1.45 | 44d | 1 | 0.53mi |
| 3616 Hester Ln NW Huntsville, AL | 4.0 | 2.0 | 1650 | $1,350 | $0.82 | 44d | 1 | 0.54mi |
| 6008 Ellington Rd NW Huntsville, AL | 4.0 | 2.5 | 1845 | $1,595 | $0.86 | 44d | 1 | 0.57mi |
| 3306 Reynolds Dr NW Huntsville, AL | 3.0 | 2.0 | 1636 | $1,800 | $1.10 | 24d | 1 | 0.58mi |
| 3100 Gayhart Dr NW Huntsville, AL | 3.0 | 1.0 | 1050 | $1,298 | $1.24 | 44d | 1 | 0.59mi |
| 6015 Kimbrell Ln NW Huntsville, AL | 4.0 | 2.5 | 1958 | $2,300 | $1.17 | 44d | 1 | 0.62mi |
| 3304 Buttrey Dr NW Huntsville, AL | 4.0 | 2.0 | 1656 | $1,681 | $1.02 | 24d | 1 | 0.69mi |
| 2508 Piney Branch Rd NW Huntsville, AL | 3.0 | 1.5 | 1205 | $1,385 | $1.15 | 44d | 1 | 0.72mi |
| 2505 Piney Branch Rd NW Huntsville, AL | 3.0 | 1.5 | 1222 | $1,300 | $1.06 | 24d | 1 | 0.76mi |
| 4700 Sparkman Dr NW Huntsville, AL | 3.0 | 1.5 | 1554 | $1,350 | $0.87 | 24d | 1 | 0.79mi |
| 2613 Skyline Dr NW Huntsville, AL | 4.0 | 2.0 | 1572 | $1,695 | $1.08 | 24d | 1 | 0.90mi |
| 3309 Charleston Ave NW Huntsville, AL | 3.0 | 2.0 | 1425 | $1,375 | $0.96 | 21d | 1 | 0.92mi |
| 2215 Shady Lane Dr NW Huntsville, AL | 4.0 | 1.0 | 1450 | $1,500 | $1.03 | 44d | 1 | 0.92mi |
| 3708 Valleydale Rd NW Huntsville, AL | 3.0 | 1.5 | 1136 | $1,350 | $1.19 | 44d | 1 | 0.93mi |
| 3303 Barton Ave NW Huntsville, AL | 3.0 | 2.0 | 1750 | $1,600 | $0.91 | 44d | 1 | 1.00mi |
| 3721 Broadmor Rd NW Huntsville, AL | 3.0 | 1.5 | 1423 | $1,450 | $1.02 | 44d | 1 | 1.02mi |
| 2201 Shady Lane Dr NW Huntsville, AL | 3.0 | 1.5 | 1472 | $3,000 | $2.04 | 44d | 1 | 1.05mi |
| 2803 Hester Ln NW Huntsville, AL | 3.0 | 1.5 | 1224 | $1,400 | $1.14 | 24d | 1 | 1.09mi |
| 4214 Fortson Ln NW Huntsville, AL | 3.0 | 2.0 | 1308 | $1,395 | $1.07 | 44d | 1 | 1.15mi |
| 3205 Lewisburg Dr NW Huntsville, AL | 3.0 | 2.0 | 1408 | $1,600 | $1.14 | 24d | 1 | 1.25mi |
| 5003 Stag Run Cir NW Huntsville, AL | 3.0 | 2.0 | 1410 | $1,450 | $1.03 | 14d | 1 | 1.27mi |
| 4216 Chalet Cir NW Huntsville, AL | 3.0 | 2.0 | 1296 | $1,500 | $1.16 | 24d | 1 | 1.41mi |
| 2506 Jeri St NW Huntsville, AL | 3.0 | 1.5 | 1274 | $1,400 | $1.10 | 24d | 1 | 1.47mi |
| 3406 Oakmont Ave NW Huntsville, AL | 3.0 | 2.0 | 1389 | $1,600 | $1.15 | 44d | 1 | 1.48mi |
| 2002 Laverne Dr NW Huntsville, AL | 3.0 | 1.5 | 1165 | $1,100 | $0.94 | 24d | 1 | 1.49mi |
| 2801 Penland Ave NW Huntsville, AL | 3.0 | 2.0 | 1650 | $1,450 | $0.88 | 24d | 1 | 1.50mi |
Listing history 7 events
-
2026-06-14statusdays on market $120,000 Pending 10 DOM
-
2026-06-10days on market $120,000 Active 8 DOM
-
2026-06-09days on market $120,000 Active 7 DOM
-
2026-06-08days on market $120,000 Active 6 DOM
-
2026-06-07pricedays on market $120,000 Active 5 DOM
-
2026-06-03remarks 638-char remark
-
2026-06-03$140,000 Active 1 DOM
ⓘ Source: listings_history table (triggers on properties + properties_extension) + one-shot
backfill from property_details.listing_events for pre-trigger history.
Climate risk First Street
- Flood 1/10 Low FEMA zone X (unshaded) · 0% chance over 30 yrs
- Wildfire 1/10 Low
- Heat 5/10 Major 7 d/yr ≥105°F today · 19 d/yr by 30 yrs out
- Wind 4/10 Moderate 18% chance of damaging wind over 30 yrs
- Air quality 2/10 Low 1 unhealthy d/yr today · 1 by 30 yrs out
Nearby sold comps map
Loading sold comps map…
Walkable amenities ~0.75 mi
Loading nearby amenities…
Taxation est. · year 1
- Rental income
- $19,370
- − Mortgage interest
- −$6,722
- − Property taxes
- −$1,800
- − Insurance
- −$600
- − Repairs & maintenance
- −$1,550
- − Management
- −$1,550
- − Depreciation
- −$3,491
- Taxable income
- $3,658
- Est. tax owed @ 24.0%
- −$878
- After-tax cash flow
- $4,473/yr
For passive investors: Depreciation is non-cash, so a rental often shows a tax loss while cash-flowing — sheltering income. Rental losses are passive: they offset passive income freely, and up to $25,000/yr can offset ordinary (W-2) income if you actively participate and your MAGI is under $100k (phasing out to $0 by $150k); unused losses carry forward. On sale, claimed depreciation is recaptured at up to 25%, and gains may owe capital-gains tax (a 1031 exchange can defer both). Figures are a year-1 estimate at your 24.0% rate — not tax advice; consult a CPA.
Schools (NCES district)
- District
- Huntsville City
- NCES district ID
- 0101800
- Math proficiency
- 21% ▼ -23.00%
- Reading proficiency
- 46% ▬ 0.00%
- Median HH income
- $48,264
- Composite
- 28.84/100
- National rank
- #6647
- State rank
- #48 of 129 in AL
Livability — Huntsville
- Score
- 82/100
- State rank
- #3
- US rank
- #1082
Category grades
Schools grade is shown separately in the Schools card above.
Census & demographics
- Census place
- Huntsville, AL
- County
- Madison County · 380,832 people
- City population
- 220,435
- Metro
- Huntsville, AL
- Population (ZIP)
- 32,843
- Household income
- $51,233
- Rent vs Own
- Severe rent burden
- 1223.0
Population outlook (Madison County) Hauer SSP2
- Today (2025)
- 392,086 people
- By 2030
- 409,788 · +4.5%
- By 2040
- 440,557 · +12.4%
- By 2050
- 460,990 · +17.6%
- By 2075
- 502,872 · +28.3%
- By 2100
- 513,623 · +31.0%
Race, ethnicity, and origin ACS 2023
- Neighborhood character
- Predominantly Black (69%)
- Race & ethnicity
- Black 69% White 18% Hispanic / Latino 9% Two or more races 5%
- Hispanic origin (detail)
- Mexican 3% Puerto Rican 2% Dominican 2%
- Common ancestry
- Italian 2% Lithuanian 0%
- Foreign-born
- 6% · Canada
- Languages at home
- 92% English-only · Spanish 7%
Political lean MEDSL · Madison
- 2024 margin
- Lean R (+9.0) · D 44.7% · R 53.7% · Other 1.6%
- 2008→2024 swing
- +6.0pp toward D · 2008: -14.9pp · 2024: -9.0pp
- All cycles
- 2024: R+9.0 2020: R+8.0 2016: R+16.8 2012: R+18.7 2008: R+14.9
Not yet ingested
- Civics
- —
Market trends
- HPI YoY
- ▼ -61.00%
- Current HPI
- 198.9629
- Rent YoY
- ▬ -0.05%
- Metro
- Huntsville, AL
- State GDP YoY
- ▲ 2.94%
- F500 in state
- 4
Industry mix (Fortune 500 HQ in AL)
| Industry | F500 HQs | Revenue |
|---|---|---|
| Financial Services | 1 | $8B |
|
||
| Healthcare | 1 | $5B |
|
||
Price history
1 event — show timeline
- 2026-06-02 Listed $140,000 VMLS
Cash-flow waterfall
monthlySold comps — $/sqft
last 12 mo · ≤1 miLoading sold comps…