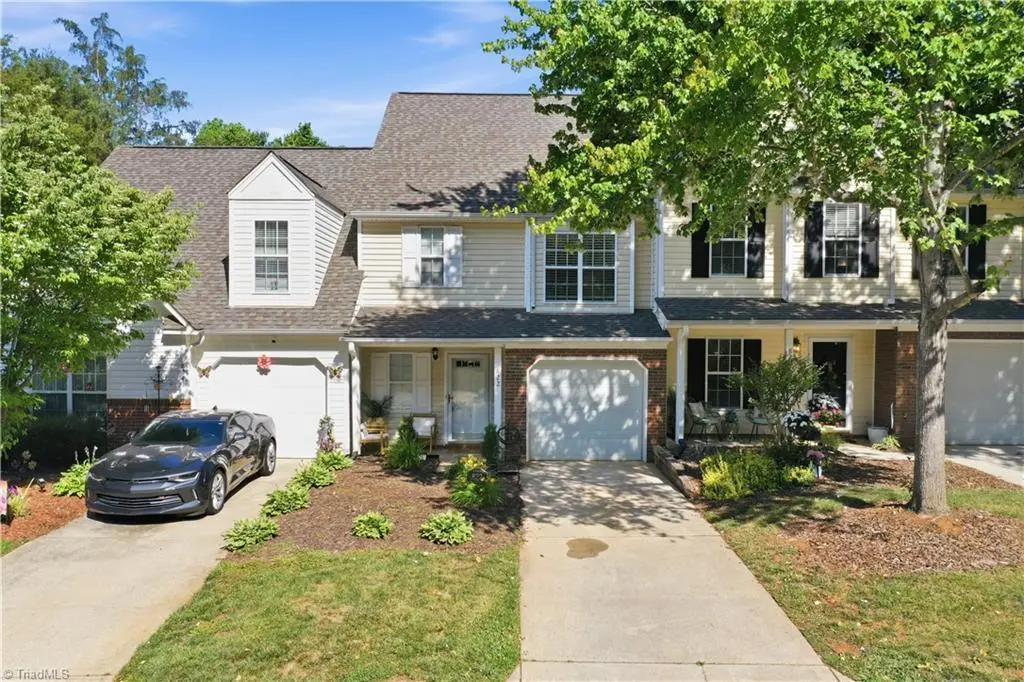
822 Creek Crossing Trl · Sedalia, NC
Flood risk 1/10 · Minimal
- FEMA flood zone
- X (unshaded)
- Chance of flooding over 30 yrs
- 0.0%
- Est. flood insurance / yr
- $507 – $1,088
Fire risk 3/10 · Minor
- Est. fire insurance / yr
- $906 – $1,684
Heat risk 5/10 · Moderate
- Hot days now (above 104°F)
- 7 days/yr
- Hot days in 30 yrs
- 18 days/yr
Wind risk 4/10 · Minor
- Chance of severe wind over 30 yrs
- 19.0%
Air-quality risk 2/10 · Minimal
- Unhealthy air days now
- 2 days/yr
- Unhealthy air days in 30 yrs
- 2 days/yr
Risk factors via First Street. Map © Google.
Why this score? — see what drove the F grade
The composite is a weighted blend of 9 inputs, each scored 0–100. Each bar is that input's sub-score; the figure is the points it added to the 100-point composite (weight × sub-score).
- Cash flow +8.9/30.0
- Appreciation +5.5/10.0
- Schools +3.6/10.0
- Rent growth +3.5/5.0
- Livability +3.1/5.0
- 1% rule +2.7/10.0
- ARV discount +2.7/15.0
- Condition / age +2.5/5.0
- DSCR +2.4/10.0
$239,000
🖨 Deal sheet 📄 Offer letter ✓ Due diligence
Listing remarks
Fresh interior paint and cleaned Carpets give this beautifully maintained Townhome a bright, refreshed feel throughout. Featuring LVP flooring, Granite countertops, and Gas Log Fireplace, the main living areas flow seamlessly into the Kitchen and Living spaces. Upstairs, both Bedrooms offer Walk-in Closets and en-suite baths and Laundry with washer and dryer. Step outside to enjoy the pond views from the private Backyard patio with privacy fencing. Located in the St. Andrews at Stoney Creek community with access to neighborhood amenities including the clubhouse, pool, and beautifully maintained common areas. Conveniently situated near Burlington, Greensboro, major highways, shopping, dining
Key facts
- Walk-in closets
- Pond views
- Gas log fireplace
Tags
Property features AI
Finance
- Other: Property type: Residential townhouse; Roads are publicly maintained
- HOA & community: Located in St. Andrews Townhomes; Community association with quarterly fee of $55 and additional monthly fee of $177
Exterior
- Parking: Attached garage (1 car); Driveway parking
- Utilities: Public water; Public sewer; Gas water heater; Natural gas heating
- Home design: Townhouse; Stick/Site built construction; Two levels; Built in 1999; Existing structure; One fireplace (gas log in living room)
- Construction: Brick and vinyl siding exterior; Slab foundation
- Exterior features: Fenced yard with privacy fencing; Pond on the property; Community pool
Interior
- Kitchen: Microwave; Dishwasher; Free-standing range
- Bedrooms: Total rooms: 6
- Flooring: Carpet; Vinyl
- Bathrooms: Two full bathrooms; One half bathroom
- Heating & cooling: Central air conditioning; Forced air heating (natural gas)
- Interior features: Ceiling fans; Pantry
- Laundry & utility: Laundry room with dryer connection; Gas water heater
Neighborhood map
What this means for you Summary
Snapshot
- This is a 2-bed/2.5-bath townhouse listed at $239k.
Deal economics
- At list price, monthly cash flow is $-195 ($-2k/yr) — negative.
- To cash-flow at today's rent, offer at most $205k (14.4% below list).
- To meet the 1% rule (rent ≥ 1% of price), the offer needs to be $184k (23.0% below list).
- Recommended offer: $184k (23.0% below list) — sets the bar for 1% rule.
Location & tenants
- Location reads 62/100 on livability (#453 in NC) — a middle-class / working-renter tenant base. Strengths: cost of living A+, housing A+; Watch: health & safety C-, crime D+, amenities F.
- Guilford County Schools (urban): math 39% / reading 45% proficiency, ranked #99 of 178 in NC (top 56%) — families likely to look elsewhere, expect single-tenant / working-renter base with shorter leases.
- Zoned schools: Sedalia Elementary (math 37% / reading 42%, grade F, #694 of 1,410 statewide, top 53%, 550 students, 62% FRL); Eastern Guilford Middle (math 26% / reading 38%, grade F, #317 of 475 statewide, top 68%, 980 students, 75% FRL); Eastern Guilford High (math 25% / reading 37%, grade F, #454 of 535 statewide, top 85%, 1,198 students, 67% FRL) — zoned schools average 68% FRL vs 52% district-wide (16 pts higher); higher-poverty schools than district average — tighter screening recommended.
- Market conditions: Rents rising fast (+4.0%/yr); 102 active listings in the ZIP; 6 comparable units currently listed for rent nearby; rentals at typical pace (median 23d on market — plan ~3-4 weeks tenant-placement turnaround); solid renter incomes; 3,843 units permitted in Guilford County in 2024 (2,397 in 5+ unit buildings).
Forward outlook
- In year one you build about $4k of equity ($2k loan paydown + $2k appreciation (1.0% local appreciation)).
- Guilford County population projected at +26% by 2050 — long-run rental-demand tailwind backs the buy-and-hold thesis.
- By year 8, paydown + projected appreciation supports a ~$33k cash-out refi (75% LTV) — recoverable capital for the next deal without selling this one.
Negotiation context
- Only 13 days on market — expect competitive offers; lowballing is unlikely to land.
- 11 sale attempts since 11y ago with the ask held roughly flat each time — persistent listings suggest the price (not the market) is what's stuck; bring a comps-based counter.
Risks & watch-outs
- Climate carrying-cost: extreme-heat days projected 7→18/yr by 2055 (HVAC capex compounding) — expect insurance premiums to compound above CPI over the hold.
Questions for the listing agent
- What do current leases actually rent for vs. the listed asking? Can we see a recent rent roll and the last 12 months of T-12 income?
- What does the HOA fee cover, when was the last increase, and are there any pending special assessments or reserve-fund shortfalls?
- Is there a deadline driving the sale (1031 exchange, divorce, estate, relocation)? That informs how much negotiation room exists.
- Schools are F-rated, which usually means shorter tenancies and higher turnover. Who's the typical renter profile here, and what's been the actual vacancy rate?
- Crime grade is D in this area — have there been break-ins, vandalism, or insurance claims at this property in the last 3 years? What carrier currently insures it and at what premium?
- The area grade is low — what's the realistic commute time and amenity access for the typical tenant pool here? Any planned neighborhood developments (good or bad) we should know about?
- What's the average days-on-market for RENTAL listings here right now (not sales)? A rising rental-DOM trend means longer vacancies and softer asking-rent achievability than the comps imply.
- What's the recent tenant-quality profile in this submarket — average credit score on applications, eviction rate, late-payment / NSF rate, and stable-employment percentage? A property-management company in the area should have these aggregated.
- How much new for-sale + rental construction is in the pipeline within 1–3 miles? Heavy new supply typically softens prices + rents 12–24 months out; constrained supply supports both.
Investment metrics
- 1% rule
- 0.77% ✗
- Cap rate
- 5.32%
- Cash-on-cash
- -3.49%
- DSCR
- 0.84
- GRM
- 10.8
CMA / ARV
- ARV (on-the-fly)
- $215,988
- Comps found
- 5
Show comp detail 5 sales within ~0.75 mi
| Address | Dist | Beds/Ba | Sqft | Sold | Price | $/sf | Match |
|---|---|---|---|---|---|---|---|
| 6318 Double Eagle Dr | 0.07mi | 2/2.5 | 1,320 (+0%) | 14mo | $219,000 | $166 | 85 |
| 6361 Double Eagle Dr | 0.10mi | 2/2.5 | 1,250 (-5%) | 7mo | $220,000 | $176 | 81 |
| 6321 Double Eagle Dr | 0.08mi | 2/2.5 | 1,198 (-9%) | 1mo | $197,000 | $164 | 80 |
| 6209 Birdie Ct | 0.09mi | 2/2.5 | 1,429 (+8%) | 6mo | $199,000 | $139 | 77 |
| 6310 Inkberry Dr | 0.74mi | 3/2.5 (+1) | 1,310 (-0%) | 14mo | $195,000 | $149 | 47 |
Match score weights: distance 35% · size 25% · config 20% · recency 20%. Top-matched comps best support the ARV.
Projected returns pro-forma
1.02% appreciation · 4.0% rent growth · sell at horizon
- IRR
- -1.7%
- Equity multiple
- 0.91×
- Total profit
- $-5,843
- Equity at exit
- $81,787
- IRR
- 3.8%
- Equity multiple
- 1.48×
- Total profit
- $31,999
- Equity at exit
- $108,841
Cash invested: $66,920 (down + closing). Projections, not guarantees.
Landlord ↔ Tenant lean methodology
- Overall (STATE)
- 85 Strongly Landlord-Friendly
- State North Carolina
- 85 Strongly Landlord-Friendly · R+3
- County
- — inherits STATE
- City
- — inherits STATE
ZIP-level market 27377
- Home prices YoY
- 0.4%
- Rents YoY
- 4.0%
- Active inventory
- 102
- Price-to-rent
- 10.8×
Monthly cashflow live
- Estimated rent
- $1,841 high interval (Pro) →
- Mortgage (P&I)
- −$1,253
- Tax from tax record
- −$101 /mo · $1,209/yr
- Insurance
- −$100
- HOA
- −$195
- Vacancy / Maint / Mgmt
- −$387
- Net cashflow
- $-195
Break-even live
UW: 25.0% down · 7.5% · 30yr · 1.5% tax · 5.0% vac · 8.0% maint · 8.0% mgmt
Financing live
Cash to close
- Down payment
- $59,750
- Closing costs
- $7,170
- Reserves months
- —
- Total cash needed
- —
Loan-product check · same deal, 3 products live
Conventional
25% down · 7.5% · 30yr
- Down + closing
- —
- Monthly P&I
- —
- Monthly cashflow
- —
- DSCR
- —
- Eligible?
- —
Personal DTI + credit; lowest rate.
DSCR
20% down · 8.5% · 30yr
- Down + closing
- —
- Monthly P&I
- —
- Monthly cashflow
- —
- DSCR
- —
- Eligible?
- —
No personal income docs; deal must DSCR.
Hard money
10% down · 12.0% · 12mo
- Down + closing
- —
- Monthly P&I
- —
- Monthly cashflow
- —
- DSCR
- —
- Eligible?
- —
Short-term bridge; refi at stabilization.
Rent comps 6 comps
| Address | Beds | Baths | Sqft | Rent | $/sqft | DOM | Units | Dist |
|---|---|---|---|---|---|---|---|---|
| 805 Creek Crossing Trl Whitsett, NC | 2.0 | 2.5 | 1307 | $1,680 | $1.29 | 18d | 1 | 0.08mi |
| 917 Creek Crossing Trl Whitsett, NC | 2.0 | 2.5 | 1243 | $1,995 | $1.60 | 23d | 1 | 0.15mi |
| 1010 Fairway Village Way Whitsett, NC | 1.0–3.0 | 1.0–2.0 | 1122 | $1,638 | $1.46 | 14d | 18 | 0.66mi |
| 1128 Brooksridge Way Unit 1128 Whitsett, NC | 2.0 | 2.5 | 1582 | $1,795 | $1.13 | 23d | 1 | 1.04mi |
| 1130 Brooksridge Way Unit 1130 Whitsett, NC | 2.0 | 2.5 | 1343 | $1,744 | $1.30 | 23d | 1 | 1.04mi |
| 7161 Royal Ascot Dr Whitsett, NC | 4.0 | 1.0–2.5 | 1658 | $2,168 | $1.31 | 14d | 80 | 1.21mi |
HOA detail
- Monthly dues
- $195 · $2,340/yr
- Likely covers
- gaspool
Listing history 44 events
-
2026-06-09status $239,000 Pending 13 DOM
-
2026-06-08days on market $239,000 Active 13 DOM
-
2026-06-07days on market $239,000 Active 12 DOM
-
2026-06-03days on market $239,000 Active 8 DOM
-
2026-06-02days on market $239,000 Active 7 DOM
-
2026-06-01days on market $239,000 Active 6 DOM
-
2026-05-31days on market $239,000 Active 5 DOM
-
2026-05-31days on market $239,000 Active 4 DOM
-
2026-05-26$239,000 Active
-
2026-05-07historical
-
2026-04-26price $239,000
-
2026-04-26price $239,000
-
2026-03-30$245,000 Active
-
2025-03-19soldstatus $243,000
-
2025-03-18soldstatus $243,000 Closed
-
2025-02-23status Pending
-
2025-02-03historical Due Diligence Period
-
2025-01-17status Active
-
2025-01-04status Pending
-
2024-12-17historical Due Diligence Period
-
2024-12-10$234,900 Active
-
2022-02-14soldstatus $187,500 Closed
-
2022-02-14soldstatus $187,500
-
2022-02-14soldstatus $187,500 Closed
-
2022-02-14soldstatus $187,500 Closed
-
2022-02-14soldstatus $187,500
-
2022-02-14soldstatus $187,500
-
2022-01-15status Pending
-
2022-01-15status Pending
-
2022-01-15status Pending
-
2022-01-14$165,000 Active
-
2022-01-14$165,000 Active
-
2022-01-14$165,000 Active
-
2022-01-12historical $165,000
-
2022-01-12historical $165,000
-
2022-01-12$165,000
-
2022-01-12$165,000
-
2015-04-28soldstatus $99,900 Sold
-
2015-04-28soldstatus $100,000
-
2015-04-07status Due Diligence Period
-
2015-04-01$99,900 Active
-
2015-02-25$99,900
-
2010-05-13soldstatus $110,000
-
2005-12-30soldstatus $105,000
ⓘ Source: listings_history table (triggers on properties + properties_extension) + one-shot
backfill from property_details.listing_events for pre-trigger history.
Tax reassessment forecast NC · Resets to sale price
- Current annual tax
- $1,209 · $101/mo
- Projected year-2 tax
- $1,960 · $163/mo
- Expected delta
- +$751/yr (+$63/mo · 62.1%)
ⓘ Screening estimate from a state-policy table — verify with the county assessor before closing.
Climate risk First Street
- Flood 1/10 Low FEMA zone X (unshaded) · 0% chance over 30 yrs
- Wildfire 3/10 Moderate
- Heat 5/10 Major 7 d/yr ≥104°F today · 18 d/yr by 30 yrs out
- Wind 4/10 Moderate 19% chance of damaging wind over 30 yrs
- Air quality 2/10 Low 2 unhealthy d/yr today · 2 by 30 yrs out
Nearby sold comps map
Loading sold comps map…
Walkable amenities ~0.75 mi
Loading nearby amenities…
Taxation est. · year 1
- Rental income
- $22,088
- − Mortgage interest
- −$13,388
- − Property taxes
- −$1,209
- − Insurance
- −$1,195
- − Repairs & maintenance
- −$1,767
- − Management
- −$1,767
- − HOA
- −$2,340
- − Depreciation
- −$6,953
- Taxable loss
- −$6,531
- Est. tax savings @ 24.0%
- +$1,567
- After-tax cash flow
- $-768/yr
For passive investors: Depreciation is non-cash, so a rental often shows a tax loss while cash-flowing — sheltering income. Rental losses are passive: they offset passive income freely, and up to $25,000/yr can offset ordinary (W-2) income if you actively participate and your MAGI is under $100k (phasing out to $0 by $150k); unused losses carry forward. On sale, claimed depreciation is recaptured at up to 25%, and gains may owe capital-gains tax (a 1031 exchange can defer both). Figures are a year-1 estimate at your 24.0% rate — not tax advice; consult a CPA.
Schools (NCES district)
- District
- Guilford County Schools
- NCES district ID
- 3701920
- Math proficiency
- 39% ▲ 1.00%
- Reading proficiency
- 45% ▲ 1.00%
- Median HH income
- $46,315
- Composite
- 35.78/100
- National rank
- #4842
- State rank
- #99 of 178 in NC
Livability — Sedalia
- Score
- 62/100
- State rank
- #453
- US rank
- #16681
Category grades
Schools grade is shown separately in the Schools card above.
Census & demographics
- County
- Guilford County · 487,190 people
- City population
- 72
- Metro
- Greensboro-High Point, NC
- Population (ZIP)
- 10,885
- Household income
- $90,181
- Rent vs Own
- Severe rent burden
- 356.0
Population outlook (Guilford County) Hauer SSP2
- Today (2025)
- 584,596 people
- By 2030
- 616,851 · +5.5%
- By 2040
- 678,451 · +16.1%
- By 2050
- 734,788 · +25.7%
- By 2075
- 862,985 · +47.6%
- By 2100
- 948,704 · +62.3%
Race, ethnicity, and origin ACS 2023
- Neighborhood character
- Diverse neighborhood (Simpson 0.61)
- Race & ethnicity
- White 52% Black 34% Two or more races 8% Hispanic / Latino 5% Asian 2%
- Common ancestry
- Serbian 6% Italian 3% Lithuanian 1%
- Foreign-born
- 5% · Canada, China
- Languages at home
- 95% English-only · Spanish 2% Chinese 1% Other Indo-European 1%
Political lean MEDSL · Guilford
- 2024 margin
- Strong D (+21.8) · D 60.2% · R 38.4% · Other 1.4%
- 2008→2024 swing
- +3.5pp toward D · 2008: 18.4pp · 2024: 21.8pp
- All cycles
- 2024: D+21.8 2020: D+23.1 2016: D+20.0 2012: D+16.5 2008: D+18.4
Not yet ingested
- Civics
- —
Market trends
- HPI YoY
- ▲ 1.02%
- Current HPI
- 232.0638
- Rent YoY
- ▲ 4.00%
- Metro
- Greensboro-High Point, NC
- State GDP YoY
- ▲ 3.28%
- F500 in state
- 26
Industry mix (Fortune 500 HQ in NC)
| Industry | F500 HQs | Revenue |
|---|---|---|
| Financial Services | 2 | $213B |
|
||
| Retail | 2 | $95B |
|
||
| Industrial Conglomerate | 1 | $38B |
|
||
| Metals / Steel | 1 | $35B |
|
||
| Utilities | 1 | $30B |
|
||
| Industrial Machinery | 1 | $19B |
|
||
Price history
+127.6% since first listed36 events — show timeline
- 2026-05-26 Listed $239,000 Triad MLS
- 2026-05-07 Listing Removed — TMLS
- 2026-04-26 Price Changed $239,000 TMLS
- 2026-04-26 Price Changed $239,000 Triad MLS
- 2026-03-30 Listed $245,000 TMLS
- 2025-03-19 Sold (Public Records) $243,000 Public Records
- 2025-03-18 Sold (MLS) $243,000 Triad MLS
- 2025-02-23 Pending — Triad MLS
- 2025-02-03 Contingent — Triad MLS
- 2025-01-17 Relisted — Triad MLS
- 2025-01-04 Pending — Triad MLS
- 2024-12-17 Contingent — Triad MLS
- 2024-12-10 Listed $234,900 Triad MLS
- 2022-02-14 Sold (Public Records) $187,500 Public Records
- 2022-02-14 Sold (MLS) $187,500 TMLS
- 2022-02-14 Sold (MLS) $187,500 Triad MLS
- 2022-02-14 Sold (MLS) $187,500 AMLSNC
- 2022-02-14 Sold (MLS) $187,500 AMLSNC
- 2022-02-14 Sold (MLS) $187,500 TMLS
- 2022-01-15 Pending — TMLS
- 2022-01-15 Pending — Triad MLS
- 2022-01-15 Pending — AMLSNC
- 2022-01-14 Listed $165,000 TMLS
- 2022-01-14 Listed $165,000 AMLSNC
- 2022-01-14 Listed $165,000 Triad MLS
- 2022-01-12 Coming Soon $165,000 TMLS
- 2022-01-12 Coming Soon $165,000 Triad MLS
- 2022-01-12 Listed $165,000 TMLS
- 2022-01-12 Listed $165,000 AMLSNC
- 2015-04-28 Sold (Public Records) $100,000 Public Records
- 2015-04-28 Sold (MLS) $99,900 Triad MLS
- 2015-04-07 Pending — Triad MLS
- 2015-04-01 Listed $99,900 Triad MLS
- 2015-02-25 Listed $99,900 TMLS
- 2010-05-13 Sold (Public Records) $110,000 Public Records
- 2005-12-30 Sold (Public Records) $105,000 Public Records
Property tax history
+2.2%/yrLatest (2025): $1,209 · -1.0% YoY. Source: county tax records.
Cash-flow waterfall
monthlySold comps — $/sqft
last 12 mo · ≤1 miLoading sold comps…