134 Nautilus Dr · Islamorada, Village of Islands, FL
Flood risk 9/10 · Severe
- FEMA flood zone
- AE
- Chance of flooding over 30 yrs
- 0.99%
- Est. flood insurance / yr
- $1,737 – $8,500
Fire risk 2/10 · Minimal
- Est. fire insurance / yr
- $947 – $1,759
Heat risk No data
- Hot days now (above threshold)
- —
- Hot days in 30 yrs
- —
Wind risk 10/10 · Severe
- Chance of severe wind over 30 yrs
- 99.0%
Air-quality risk 2/10 · Minimal
- Unhealthy air days now
- 1 days/yr
- Unhealthy air days in 30 yrs
- 1 days/yr
Risk factors via First Street. Map © Google.
Why this score? — see what drove the C+ grade
The composite is a weighted blend of 9 inputs, each scored 0–100. Each bar is that input's sub-score; the figure is the points it added to the 100-point composite (weight × sub-score).
- Cash flow +19.9/30.0
- Appreciation +10.0/10.0
- ARV discount +7.5/15.0
- DSCR +6.3/10.0
- 1% rule +5.3/10.0
- Schools +4.6/10.0
- Rent growth +2.5/5.0
- Livability +2.5/5.0
- Condition / age +2.5/5.0
$415,000
🖨 Deal sheet 📄 Offer letter ✓ Due diligence
Listing remarks
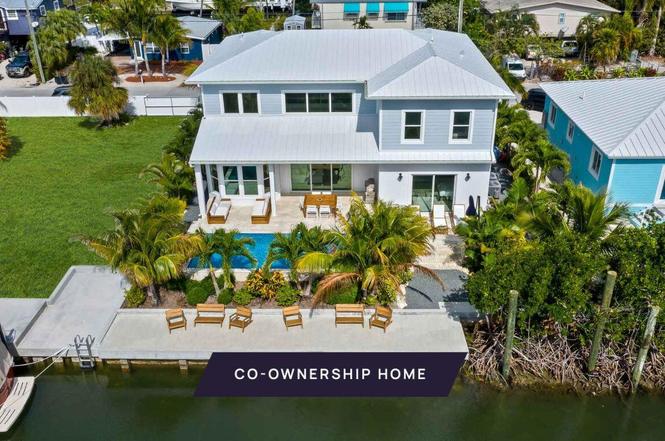
New co-ownership opportunity: Own one-eighth of this professionally managed, turnkey home by Pacaso. Tucked within the coveted White Marlin Beach enclave, this canal-front retreat captures the essence of refined Florida Keys living. Framed by swaying palms and a gracious front entry, the 5-bedroom, 3.5-bathroom residence offers a seamless blend of comfort and coastal elegance. The open-concept main level is bathed in natural light, with soaring ceilings, oversized windows, and glass doors that connect the living area to the private pool and tranquil canal beyond. A bright, gourmet kitchen anchors the space with JennAir appliances, dual sinks, and generous cabinetry—ideal for effortles
Key facts
- Private pool
- Gourmet kitchen
- Canal front retreat
Tags
Property features AI
Finance
- Other: Pets allowed with restrictions; Short-term rentals not allowed; Located in flood zone AE
- Financial info: Acceptable financing: Cash, Conventional, Other (specify)
- HOA & community: No first right of refusal; No association fee; Association services include cable, security, water and sewer
Exterior
- Parking: Garage; 2-car garage
- Security: Security system (interior listed as included); Security included in association services
- Utilities: Cable available / pre-wired for cable; Public sewer hookup; Water service included in association services
- Home design: Ground level building style; Building is above flood; Faces Bay/Gulf side
- Construction: Built in 2021; Concrete block (CBS) and Hardi board siding; Metal roof
- Exterior features: Fencing; Landscape lighting; Open porch/balcony; In-ground pool; On waterfront (canal front); Bay/Gulf view and canal view
Interior
- Kitchen: Stainless steel appliances; Oven; Range; Microwave; Refrigerator; Freezer; Dishwasher; Disposal
- Bathrooms: Three full bathrooms; One half bathroom
- Heating & cooling: Forced air heating; Central A/C
- Interior features: Drapes and blinds included; Security system; Walk-in closet; Storage space; Smoke alarms; Furnished
- Laundry & utility: Washer; Dryer; Laundry room
Neighborhood map
What this means for you Summary
Snapshot
- This is a 5-bed/3.5-bath single-family listed at $415k.
Deal economics
- At list price, monthly cash flow is $74 ($882/yr) — positive.
- The deal already cash-flows at list — no discount required.
- Meets the 1% rule at list price ($4k rent vs $415k).
- Recommended offer: $365k (12.0% below list) — sets the bar for market timing.
- Cap rate 7.7% vs local median 0.3% in Islamorada, Village of Islands — top-decile yield for the area; either an underpriced asset or a hidden risk that comps aren't pricing in. Stress-test before assuming the spread holds.
Location & tenants
- Location reads: area grade C — affects rentability + tenant quality, not the cash-flow math above.
- Monroe (town): math 50% / reading 55% proficiency, ranked #23 of 73 in FL (top 32%) — acceptable for families but not a draw, mixed tenant base, ~2y average lease.
- Market conditions: 153 active listings in the ZIP; solid renter incomes; 332 units permitted in Monroe County in 2024 (42 in 5+ unit buildings).
- At $4,263/mo this rent would consume 59% of the median local household income ($86k/yr) (locally 68% of renters already pay >50% of income on rent) — very limited rent-growth headroom before tenants either downsize or default.
Forward outlook
- In year one you build about $44k of equity ($3k loan paydown + $42k appreciation (10.0% local appreciation)).
- Monroe County population projected at +28% by 2050 — long-run rental-demand tailwind backs the buy-and-hold thesis.
- At projected returns (10.0% appreciation + 3.0% rent growth), your $116k cash investment doubles in ~3 years — after that, you're playing with house money.
- By year 2, paydown + projected appreciation supports a ~$71k cash-out refi (75% LTV) — recoverable capital for the next deal without selling this one.
Negotiation context
- It's been on market 177 days — a 12% lower offer ($365k) is reasonable based on typical stale-listing flexibility.
- 9 sale attempts since 5y ago; this cycle's ask has dropped $35k (8%) from the opening price — seller is motivated, your offer sets the floor, not the list.
Risks & watch-outs
- Watch-outs: flood insurance adds $427/mo.
- Climate carrying-cost: in FEMA flood zone AE (mandatory federal flood insurance); severe wind risk, 99% chance of damaging wind over 30y — expect insurance premiums to compound above CPI over the hold.
Questions for the listing agent
- It's been on market 177 days. Have you received any prior offers? Is the seller open to a 12% concession, seller financing, or rate buy-down credit?
- What's the actual annual flood-insurance premium (NFIP or private), and is the property in a SFHA with mandatory coverage?
- Why hasn't it sold? Are there any deal-killer items the seller is aware of (foundation, flood, title, zoning, code violations)?
- Is there a deadline driving the sale (1031 exchange, divorce, estate, relocation)? That informs how much negotiation room exists.
- What's the average days-on-market for RENTAL listings here right now (not sales)? A rising rental-DOM trend means longer vacancies and softer asking-rent achievability than the comps imply.
- What's the recent tenant-quality profile in this submarket — average credit score on applications, eviction rate, late-payment / NSF rate, and stable-employment percentage? A property-management company in the area should have these aggregated.
- How much new for-sale + rental construction is in the pipeline within 1–3 miles? Heavy new supply typically softens prices + rents 12–24 months out; constrained supply supports both.
Investment metrics
- 1% rule
- 1.03% ✓
- Cap rate
- 7.74%
- Cash-on-cash
- 5.16%
- DSCR
- 1.23
- GRM
- 8.1
CMA / ARV
- ARV (on-the-fly)
- $2,779,092
- Comps found
- 5
Show comp detail 5 sales within ~0.75 mi
| Address | Dist | Beds/Ba | Sqft | Sold | Price | $/sf | Match |
|---|---|---|---|---|---|---|---|
| 72 W Plaza Granada | 0.21mi | 4/3.5 (-1) | 2,937 (+1%) | 4mo | $2,300,000 | $783 | 80 |
| 128 W Plaza Del Sol | 0.37mi | 6/3.5 (+1) | 2,843 (-2%) | 12mo | $3,210,000 | $1,129 | 64 |
| 119 W Plaza Del Lago | 0.26mi | 4/3.5 (-1) | 3,128 (+8%) | 10mo | $2,989,000 | $956 | 62 |
| 109 Sapodilla Dr | 0.52mi | 4/3.5 (-1) | 3,130 (+8%) | 6mo | $2,900,000 | $927 | 53 |
| 117 Buena Vista Ct | 0.44mi | 4/2.5 (-1) | 2,683 (-8%) | 8mo | $2,900,000 | $1,081 | 51 |
Match score weights: distance 35% · size 25% · config 20% · recency 20%. Top-matched comps best support the ARV.
Projected returns pro-forma
10.0% appreciation · 3.0% rent growth · sell at horizon
- IRR
- 24.9%
- Equity multiple
- 2.99×
- Total profit
- $231,029
- Equity at exit
- $373,865
- IRR
- 22.0%
- Equity multiple
- 6.83×
- Total profit
- $677,310
- Equity at exit
- $806,254
Cash invested: $116,200 (down + closing). Projections, not guarantees.
Landlord ↔ Tenant lean methodology
- Overall (STATE)
- 87 Strongly Landlord-Friendly
- State Florida
- 87 Strongly Landlord-Friendly · R+3
- County
- — inherits STATE
- City
- — inherits STATE
ZIP-level market 33036
- Home prices YoY
- 34.3%
- Active inventory
- 153
- Price-to-rent
- 8.1×
Monthly cashflow live
- Estimated rent
- $4,263 medium interval (Pro) →
- Mortgage (P&I)
- −$2,176
- Tax est. 1.5%
- −$519 /mo · $6,225/yr
- Insurance
- −$173
- Flood insurance flood zone
- −$427 /mo · $5,118/yr
- HOA
- −$0
- Vacancy / Maint / Mgmt
- −$895
- Net cashflow
- $74
Break-even live
UW: 25.0% down · 7.5% · 30yr · 1.5% tax · 5.0% vac · 8.0% maint · 8.0% mgmt
Financing live
Cash to close
- Down payment
- $103,750
- Closing costs
- $12,450
- Reserves months
- —
- Total cash needed
- —
Loan-product check · same deal, 3 products live
Conventional
25% down · 7.5% · 30yr
- Down + closing
- —
- Monthly P&I
- —
- Monthly cashflow
- —
- DSCR
- —
- Eligible?
- —
Personal DTI + credit; lowest rate.
DSCR
20% down · 8.5% · 30yr
- Down + closing
- —
- Monthly P&I
- —
- Monthly cashflow
- —
- DSCR
- —
- Eligible?
- —
No personal income docs; deal must DSCR.
Hard money
10% down · 12.0% · 12mo
- Down + closing
- —
- Monthly P&I
- —
- Monthly cashflow
- —
- DSCR
- —
- Eligible?
- —
Short-term bridge; refi at stabilization.
Listing history 44 events
-
2026-06-19days on market $415,000 Active 177 DOM
-
2026-06-18days on market $415,000 Active 176 DOM
-
2026-06-17days on market $415,000 Active 175 DOM
-
2026-06-16days on market $415,000 Active 174 DOM
-
2026-06-15days on market $415,000 Active 173 DOM
-
2026-06-14days on market $415,000 Active 171 DOM
-
2026-06-13days on market $415,000 Active 170 DOM
-
2026-06-10days on market $415,000 Active 168 DOM
-
2026-06-09days on market $415,000 Active 167 DOM
-
2026-06-08days on market $415,000 Active 166 DOM
-
2026-06-07days on market $415,000 Active 165 DOM
-
2026-06-05days on market $415,000 Active 162 DOM
-
2026-06-03days on market $415,000 Active 161 DOM
-
2026-06-02days on market $415,000 Active 160 DOM
-
2026-06-01days on market $415,000 Active 159 DOM
-
2026-05-31days on market $415,000 Active 158 DOM
-
2026-05-30days on market $415,000 Active 157 DOM
-
2026-05-08price $415,000
-
2026-01-07status Active
-
2025-12-01status Pending
-
2025-11-24status Active
-
2025-10-30status Pending
-
2025-10-26historical
-
2025-10-24$450,000 Active
-
2025-07-21$450,000 Active
-
2025-04-24historical
-
2024-12-10price $475,000
-
2024-12-10historical
-
2024-10-23$499,000 Active
-
2024-10-22price $489,000
-
2024-08-06$519,000 Active
-
2023-02-07historical
-
2022-11-30price $450,000
-
2022-11-02$498,000 Active
-
2022-05-17historical
-
2022-01-05$444,000 Active
-
2021-12-30soldstatus $2,790,000
-
2021-12-27soldstatus $2,790,000 Closed
-
2021-11-24status Pending
-
2021-10-15price $2,790,000
-
2021-09-07price $2,890,000
-
2021-05-19$2,959,000 Active
-
2007-10-17soldstatus $305,000
-
1995-12-13soldstatus $35,000
ⓘ Source: listings_history table (triggers on properties + properties_extension) + one-shot
backfill from property_details.listing_events for pre-trigger history.
Climate risk First Street
- Flood 9/10 Extreme FEMA zone AE · 99% chance over 30 yrs
- Wildfire 2/10 Low
- Wind 10/10 Extreme 99% chance of damaging wind over 30 yrs
- Air quality 2/10 Low 1 unhealthy d/yr today · 1 by 30 yrs out
Nearby sold comps map
Loading sold comps map…
Walkable amenities ~0.75 mi
Loading nearby amenities…
Taxation est. · year 1
- Rental income
- $51,160
- − Mortgage interest
- −$23,246
- − Property taxes
- −$6,225
- − Insurance
- −$7,194
- − Repairs & maintenance
- −$4,093
- − Management
- −$4,093
- − Depreciation
- −$12,073
- Taxable loss
- −$5,763
- Est. tax savings @ 24.0%
- +$1,383
- After-tax cash flow
- $2,265/yr
For passive investors: Depreciation is non-cash, so a rental often shows a tax loss while cash-flowing — sheltering income. Rental losses are passive: they offset passive income freely, and up to $25,000/yr can offset ordinary (W-2) income if you actively participate and your MAGI is under $100k (phasing out to $0 by $150k); unused losses carry forward. On sale, claimed depreciation is recaptured at up to 25%, and gains may owe capital-gains tax (a 1031 exchange can defer both). Figures are a year-1 estimate at your 24.0% rate — not tax advice; consult a CPA.
Schools (NCES district)
- District
- Monroe
- NCES district ID
- 1201320
- Math proficiency
- 50% ▼ -14.00%
- Reading proficiency
- 55% ▼ -6.00%
- Median HH income
- $56,955
- Composite
- 45.51/100
- National rank
- #2608
- State rank
- #23 of 73 in FL
Livability — Islamorada, Village of Islands
No livability data for this city. (Only ~50 U.S. cities are tracked.)
Census & demographics
- Census place
- Islamorada, Village of Islands, FL
- County
- Monroe County · 66,185 people
- Metro
- Key West, FL
- Population (ZIP)
- 3,777
- Household income
- $86,032
- Rent vs Own
- Severe rent burden
- 68.0
Population outlook (Monroe County) Hauer SSP2
- Today (2025)
- 90,706 people
- By 2030
- 96,308 · +6.2%
- By 2040
- 106,565 · +17.5%
- By 2050
- 116,500 · +28.4%
- By 2075
- 141,423 · +55.9%
- By 2100
- 151,947 · +67.5%
Race, ethnicity, and origin ACS 2023
- Neighborhood character
- Predominantly White (77%)
- Race & ethnicity
- White 77% Hispanic / Latino 17% Two or more races 9% Asian 1%
- Hispanic origin (detail)
- Mexican 1% Puerto Rican 2% Cuban 10%
- Common ancestry
- Lithuanian 2% Subsaharan African 2% Slovak 1%
- Foreign-born
- 17% · Canada
- Languages at home
- 77% English-only · Spanish 16% Russian/Polish/Slavic 4% Other Indo-European 3%
Political lean MEDSL · Monroe
- 2024 margin
- R (+18.3) · D 40.5% · R 58.8%
- 2008→2024 swing
- -23.2pp toward R · 2008: 4.9pp · 2024: -18.3pp
- All cycles
- 2024: R+18.3 2020: R+7.9 2016: R+6.9 2012: D+0.4 2008: D+4.9
Not yet ingested
- Civics
- —
Market trends
- HPI YoY
- ▲ 161.75%
- Current HPI
- 632.97
- Rent YoY
- —
- Metro
- Key West, FL
- State GDP YoY
- ▲ 3.28%
- F500 in state
- 36
Industry mix (Fortune 500 HQ in FL)
| Industry | F500 HQs | Revenue |
|---|---|---|
| Industrial Technology | 2 | $29B |
|
||
| Insurance | 2 | $17B |
|
||
| Retail | 1 | $60B |
|
||
| Technology Distribution | 1 | $58B |
|
||
| Homebuilding | 1 | $35B |
|
||
| Technology Manufacturing | 1 | $35B |
|
||
Price history
+1085.7% since first listed27 events — show timeline
- 2026-05-08 Price Changed $415,000 FLKMLS
- 2026-01-07 Relisted — FLKMLS
- 2025-12-01 Pending — FLKMLS
- 2025-11-24 Relisted — FLKMLS
- 2025-10-30 Pending — FLKMLS
- 2025-10-26 Listing Removed — MARMLS
- 2025-10-24 Listed $450,000 FLKMLS
- 2025-07-21 Listed $450,000 MARMLS
- 2025-04-24 Listing Removed — FLKMLS
- 2024-12-10 Price Changed $475,000 FLKMLS
- 2024-12-10 Listing Removed — FLKMLS
- 2024-10-23 Listed $499,000 FLKMLS
- 2024-10-22 Price Changed $489,000 FLKMLS
- 2024-08-06 Listed $519,000 FLKMLS
- 2023-02-07 Listing Removed — FLKMLS
- 2022-11-30 Price Changed $450,000 FLKMLS
- 2022-11-02 Listed $498,000 FLKMLS
- 2022-05-17 Listing Removed — FLKMLS
- 2022-01-05 Listed $444,000 FLKMLS
- 2021-12-30 Sold (Public Records) $2,790,000 Public Records
- 2021-12-27 Sold (MLS) $2,790,000 FLKMLS
- 2021-11-24 Pending — FLKMLS
- 2021-10-15 Price Changed $2,790,000 FLKMLS
- 2021-09-07 Price Changed $2,890,000 FLKMLS
- 2021-05-19 Listed $2,959,000 FLKMLS
- 2007-10-17 Sold (Public Records) $305,000 Public Records
- 1995-12-13 Sold (Public Records) $35,000 Public Records
Property tax history
+27.5%/yrLatest (2025): $22,230 · +2.2% YoY. Source: county tax records.
Cash-flow waterfall
monthlySold comps — $/sqft
last 12 mo · ≤1 miLoading sold comps…