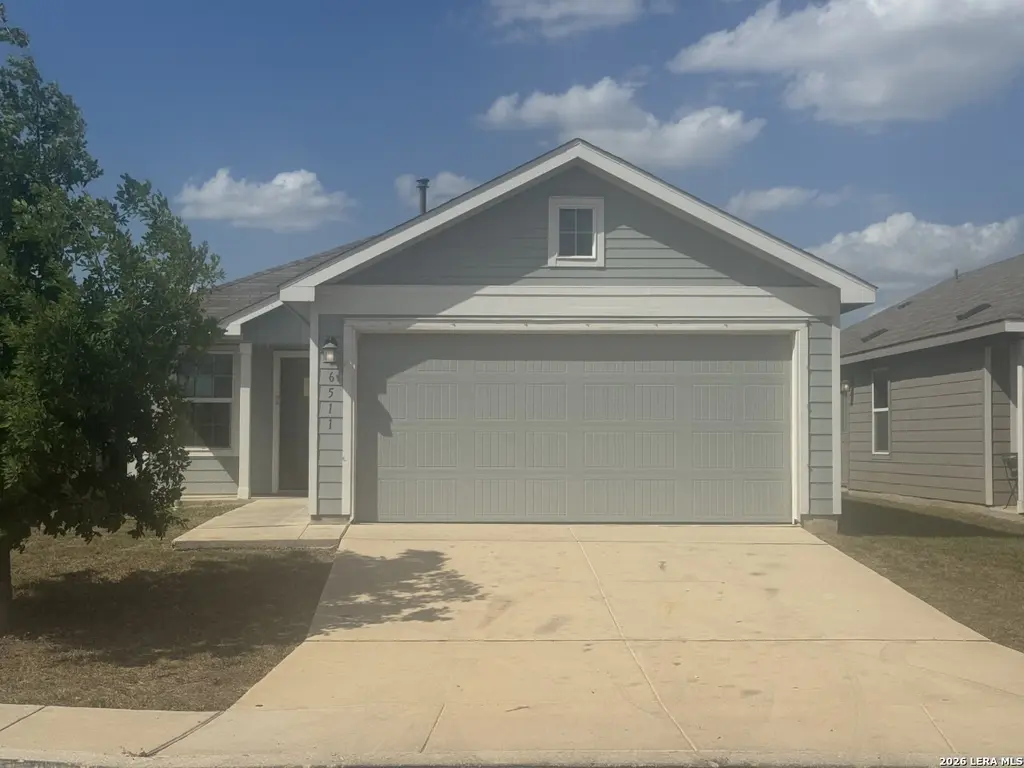
6511 Delgado Run · San Antonio, TX
Flood risk 1/10 · Minimal
- FEMA flood zone
- X (unshaded)
- Chance of flooding over 30 yrs
- 0.0%
- Est. flood insurance / yr
- $507 – $1,088
Fire risk 4/10 · Minor
- Est. fire insurance / yr
- $1,222 – $2,270
Heat risk 8/10 · Major
- Hot days now (above 108°F)
- 7 days/yr
- Hot days in 30 yrs
- 23 days/yr
Wind risk 8/10 · Major
- Chance of severe wind over 30 yrs
- 80.0%
Air-quality risk 2/10 · Minimal
- Unhealthy air days now
- 0 days/yr
- Unhealthy air days in 30 yrs
- 2 days/yr
Risk factors via First Street. Map © Google.
Why this score? — see what drove the D+ grade
The composite is a weighted blend of 9 inputs, each scored 0–100. Each bar is that input's sub-score; the figure is the points it added to the 100-point composite (weight × sub-score).
- ARV discount +15.0/15.0
- Appreciation +10.0/10.0
- Cash flow +7.1/30.0
- Livability +4.0/5.0
- 1% rule +3.7/10.0
- Rent growth +2.6/5.0
- Condition / age +2.5/5.0
- Schools +1.4/10.0
- DSCR +1.3/10.0
$188,600
🖨 Deal sheet 📄 Offer letter ✓ Due diligence
Listing remarks MLS
Discover your next chapter in the vibrant Rosillo Creek community! This charming 2020 Lennar Durbin single-story gem sparkles with 1,446 sq. ft. of sun-drenched, open-concept living-perfect for effortless entertaining and everyday joy. Featuring 3 generous bedrooms, 2 sleek baths, a private owner's suite with walk-in closet and spa-like bath, plus a chef-inspired kitchen flowing into the bright living area, this home wraps you in modern comfort and style. Nestled on a spacious lot with room to play or garden, it's just minutes from I-10, I-410, downtown San Antonio, and all the Alamo City excitement. Bursting with potential-this is San Antonio living at its brightest!
Key facts
- 5,706 sq ft lot
- 2 garage spots
- Built 2020
Neighborhood map
What this means for you Summary
Snapshot
- This is a 3-bed/2.0-bath single-family listed at $189k.
Deal economics
- At list price, monthly cash flow is $-271 ($-3k/yr) — negative.
- To cash-flow at today's rent, offer at most $141k (25.4% below list).
- To meet the 1% rule (rent ≥ 1% of price), the offer needs to be $165k (12.6% below list).
- Recommended offer: $141k (25.4% below list) — sets the bar for cash-flow.
- Cap rate 4.6% vs local median 3.8% in San Antonio — meaningfully above typical; check what's discounted (condition, days-on-market, listing class) to confirm the premium yield is real.
Location & tenants
- Location reads 80/100 on livability (#31 in TX, #1,616 nationally) — a professional / high-income tenant draw. Strengths: amenities A+, commute A+, cost of living A+; Watch: schools C-, crime F.
- San Antonio ISD (urban): math 12% / reading 22% proficiency, ranked #805 of 826 in TX (top 98%) — low school quality limits family demand, transient renter base, plan for 1-2y turnover; 80% free/reduced lunch — lower-income household profile, screen leases tightly.
- Market conditions: Rents flat; 113 active listings in the ZIP; 26 comparable units currently listed for rent nearby; rentals at typical pace (median 24d on market — plan ~3-4 weeks tenant-placement turnaround); lower-income renter base — watch delinquency; 8,308 units permitted in Bexar County in 2024 (2,506 in 5+ unit buildings).
- At $1,648/mo this rent would consume 47% of the median local household income ($42k/yr) (locally 705% of renters already pay >50% of income on rent) — very limited rent-growth headroom before tenants either downsize or default.
Forward outlook
- In year one you build about $20k of equity ($1k loan paydown + $19k appreciation (10.0% local appreciation)).
- Bexar County population projected at +50% by 2050 — long-run rental-demand tailwind backs the buy-and-hold thesis.
- By year 2, paydown + projected appreciation supports a ~$32k cash-out refi (75% LTV) — recoverable capital for the next deal without selling this one.
Negotiation context
- It's been on market 48 days — a 3% lower offer ($183k) is reasonable based on typical stale-listing flexibility.
- 2 sale attempts since 6y ago; this cycle's ask has dropped $16k (8%) from the opening price — seller is motivated, your offer sets the floor, not the list.
Risks & watch-outs
- Watch-outs: property tax is 3.1% of price.
- Climate carrying-cost: severe wind risk, 80% chance of damaging wind over 30y; extreme-heat days projected 7→23/yr by 2055 (HVAC capex compounding) — expect insurance premiums to compound above CPI over the hold.
Questions for the listing agent
- What do current leases actually rent for vs. the listed asking? Can we see a recent rent roll and the last 12 months of T-12 income?
- It's been on market 48 days. Have you received any prior offers? Is the seller open to a 25% concession, seller financing, or rate buy-down credit?
- Property tax is high relative to price — has the assessment been appealed recently, and will the sale trigger a re-assessment?
- What does the HOA fee cover, when was the last increase, and are there any pending special assessments or reserve-fund shortfalls?
- Is there a deadline driving the sale (1031 exchange, divorce, estate, relocation)? That informs how much negotiation room exists.
- Crime grade is F in this area — have there been break-ins, vandalism, or insurance claims at this property in the last 3 years? What carrier currently insures it and at what premium?
- The area grade is low — what's the realistic commute time and amenity access for the typical tenant pool here? Any planned neighborhood developments (good or bad) we should know about?
- What's the average days-on-market for RENTAL listings here right now (not sales)? A rising rental-DOM trend means longer vacancies and softer asking-rent achievability than the comps imply.
- What's the recent tenant-quality profile in this submarket — average credit score on applications, eviction rate, late-payment / NSF rate, and stable-employment percentage? A property-management company in the area should have these aggregated.
- How much new for-sale + rental construction is in the pipeline within 1–3 miles? Heavy new supply typically softens prices + rents 12–24 months out; constrained supply supports both.
Investment metrics
- 1% rule
- 0.87% ✗
- Cap rate
- 4.57%
- Cash-on-cash
- -6.17%
- DSCR
- 0.73
- GRM
- 9.5
CMA / ARV
- ARV (median comp)
- $230,969
- List price
- $188,600
- Delta
- -18.34%
- Verdict
- UNDERPRICED
- Comps
- 20 within 1.0 mi
Show comp detail 12 sales within ~0.75 mi
| Address | Dist | Beds/Ba | Sqft | Sold | Price | $/sf | Match |
|---|---|---|---|---|---|---|---|
| 202 Reuben Kemper | 0.16mi | 3/2.0 | 1,450 (0%) | 2mo | $200,000 | $138 | 91 |
| 402 River Run Way | 0.37mi | 3/2.0 | 1,411 (-3%) | 1mo | $214,999 | $152 | 78 |
| 410 River Run Way | 0.38mi | 3/2.0 | 1,402 (-3%) | 1mo | $209,999 | $150 | 76 |
| 442 River Run Way | 0.41mi | 3/2.0 | 1,402 (-3%) | 2mo | $209,999 | $150 | 74 |
| 458 River Run Way | 0.43mi | 3/2.0 | 1,402 (-3%) | 2mo | $200,999 | $143 | 73 |
| 443 River Run Way | 0.45mi | 3/2.0 | 1,402 (-3%) | 1mo | $211,999 | $151 | 73 |
| 526 Ambush Rdg | 0.26mi | 3/2.0 | 1,276 (-12%) | 2mo | $209,000 | $164 | 66 |
| 414 River Run Way | 0.39mi | 3/2.0 | 1,266 (-13%) | 1mo | $194,999 | $154 | 60 |
| 450 River Run Way | 0.42mi | 4/2.0 (+1) | 1,575 (+9%) | 2mo | $217,999 | $138 | 60 |
| 418 River Run Way | 0.39mi | 4/2.0 (+1) | 1,600 (+10%) | 1mo | $225,999 | $141 | 58 |
| 451 River Run Way | 0.46mi | 4/2.0 (+1) | 1,600 (+10%) | 2mo | $220,999 | $138 | 55 |
| 527 River Run Way | 0.56mi | 4/2.0 (+1) | 1,600 (+10%) | 2mo | $211,999 | $132 | 50 |
Match score weights: distance 35% · size 25% · config 20% · recency 20%. Top-matched comps best support the ARV.
Projected returns pro-forma
10.0% appreciation · 0.53% rent growth · sell at horizon
- IRR
- 19.1%
- Equity multiple
- 2.55×
- Total profit
- $81,622
- Equity at exit
- $169,906
- IRR
- 17.1%
- Equity multiple
- 5.68×
- Total profit
- $247,017
- Equity at exit
- $366,408
Cash invested: $52,808 (down + closing). Projections, not guarantees.
Landlord ↔ Tenant lean methodology
- Overall (STATE)
- 87 Strongly Landlord-Friendly
- State Texas
- 87 Strongly Landlord-Friendly · R+5
- County
- — inherits STATE
- City
- — inherits STATE
ZIP-level market 78220
- Home prices YoY
- 9.1%
- Rents YoY
- 0.5%
- Active inventory
- 113
- Price-to-rent
- 9.5×
Monthly cashflow live
- Estimated rent
- $1,648 high interval (Pro) →
- Mortgage (P&I)
- −$989
- Tax from tax record
- −$489 /mo · $5,867/yr
- Insurance
- −$79
- HOA
- −$17
- Vacancy / Maint / Mgmt
- −$346
- Net cashflow
- $-271
Break-even live
UW: 25.0% down · 7.5% · 30yr · 1.5% tax · 5.0% vac · 8.0% maint · 8.0% mgmt
Financing live
Cash to close
- Down payment
- $47,150
- Closing costs
- $5,658
- Reserves months
- —
- Total cash needed
- —
Loan-product check · same deal, 3 products live
Conventional
25% down · 7.5% · 30yr
- Down + closing
- —
- Monthly P&I
- —
- Monthly cashflow
- —
- DSCR
- —
- Eligible?
- —
Personal DTI + credit; lowest rate.
DSCR
20% down · 8.5% · 30yr
- Down + closing
- —
- Monthly P&I
- —
- Monthly cashflow
- —
- DSCR
- —
- Eligible?
- —
No personal income docs; deal must DSCR.
Hard money
10% down · 12.0% · 12mo
- Down + closing
- —
- Monthly P&I
- —
- Monthly cashflow
- —
- DSCR
- —
- Eligible?
- —
Short-term bridge; refi at stabilization.
Rent comps 26 comps
| Address | Beds | Baths | Sqft | Rent | $/sqft | DOM | Units | Dist |
|---|---|---|---|---|---|---|---|---|
| 134 Samuel Kemper San Antonio, TX | 3.0 | 2.0 | 1450 | $1,550 | $1.07 | 12d | 1 | 0.10mi |
| 242 Ambush Rdg San Antonio, TX | 3.0 | 2.0 | 1276 | $1,495 | $1.17 | 23d | 1 | 0.13mi |
| 6422 Magee Run San Antonio, TX | 3.0 | 2.0 | 1450 | $1,690 | $1.17 | 17d | 1 | 0.15mi |
| 6422 Magee Run San Antonio, TX | 3.0 | 2.0 | 1450 | $1,550 | $1.07 | 1d | 1 | 0.15mi |
| 6422 Magee Run San Antonio, TX | 3.0 | 2.0 | 1450 | $1,690 | $1.17 | 23d | 1 | 0.15mi |
| 6410 Magee Run San Antonio, TX | 3.0 | 2.0 | 1450 | $1,715 | $1.18 | 10d | 1 | 0.16mi |
| 422 De Herrera San Antonio, TX | 3.0 | 2.0 | 1450 | $1,595 | $1.10 | 23d | 1 | 0.16mi |
| 422 De Herrera San Antonio, TX | 3.0 | 2.0 | 1450 | $1,625 | $1.12 | 43d | 1 | 0.17mi |
| 127 Expedition Way San Antonio, TX | 2.0 | 1.0 | 950 | $1,400 | $1.47 | 23d | 1 | 0.17mi |
| 6406 Kemper Pl San Antonio, TX | 3.0 | 2.0 | 1450 | $1,499 | $1.03 | 14d | 1 | 0.24mi |
| 6427 Kemper Pl San Antonio, TX | 3.0 | 2.0 | 1266 | $1,700 | $1.34 | 17d | 1 | 0.26mi |
| 115 Katy Post San Antonio, TX | 4.0 | 2.5 | 1725 | $1,995 | $1.16 | 23d | 1 | 0.29mi |
| 414 Retama Pass San Antonio, TX | 3.0 | 2.5 | 1836 | $1,800 | $0.98 | 23d | 1 | 0.32mi |
| 518 Wild Olive Way San Antonio, TX | 2.0 | 2.0 | 1472 | $1,550 | $1.05 | 21d | 1 | 0.37mi |
| 550 Retama Pass San Antonio, TX | 3.0 | 2.0 | 1207 | $1,750 | $1.45 | 4d | 1 | 0.38mi |
| 535 Wild Olive Way San Antonio, TX | 3.0 | 2.0 | 1570 | $1,550 | $0.99 | 4d | 1 | 0.41mi |
| 462 River Run Way San Antonio, TX | 3.0 | 2.0 | 1411 | $1,555 | $1.10 | 23d | 1 | 0.43mi |
| 603 Wild Olive Way San Antonio, TX | 3.0 | 2.0 | 1207 | $1,600 | $1.33 | 23d | 1 | 0.43mi |
| 627 Retama Pass San Antonio, TX | 4.0 | 2.5 | 1776 | $1,900 | $1.07 | 23d | 1 | 0.46mi |
| 463 River Run Way San Antonio, TX | 4.0 | 2.0 | 1600 | $1,545 | $0.97 | 21d | 1 | 0.47mi |
| 6110 Willow Point Blvd San Antonio, TX | 3.0 | 2.5 | 1833 | $1,795 | $0.98 | 10d | 1 | 0.53mi |
| 6110 Willow Point Blvd San Antonio, TX | 3.0 | 2.5 | 1833 | $1,795 | $0.98 | 20d | 1 | 0.53mi |
| 6110 Willow Point Blvd Unit NA San Antonio, TX | 3.0 | 2.5 | 1850 | $1,750 | $0.95 | 23d | 1 | 0.53mi |
| 6334 Willow Point Blvd San Antonio, TX | 3.0 | 2.0 | 1497 | $1,797 | $1.20 | 23d | 1 | 0.55mi |
| 6102 Walnut Way San Antonio, TX | 4.0 | 2.5 | 1611 | $1,750 | $1.09 | 43d | 1 | 0.59mi |
| 5847 Tree View St San Antonio, TX | 3.0 | 2.0 | 1362 | $1,900 | $1.40 | 17d | 1 | 0.88mi |
HOA detail
- Monthly dues
- $17 · $204/yr
Listing history 3 events
-
2026-04-08$205,000 New 678-char remark
Show marketing remark (678 chars)
Discover your next chapter in the vibrant Rosillo Creek community! This charming 2020 Lennar Durbin single-story gem sparkles with 1,446 sq. ft. of sun-drenched, open-concept living-perfect for effortless entertaining and everyday joy. Featuring 3 generous bedrooms, 2 sleek baths, a private owner's suite with walk-in closet and spa-like bath, plus a chef-inspired kitchen flowing into the bright living area, this home wraps you in modern comfort and style. Nestled on a spacious lot with room to play or garden, it's just minutes from I-10, I-410, downtown San Antonio, and all the Alamo City excitement. Bursting with potential-this is San Antonio living at its brightest!
-
2020-10-19soldstatus Sold 404-char remark
Show marketing remark (404 chars)
The Durbin from our Cottage Collection features an open concept living space with 3 bedrooms and 2 baths. The gorgeous kitchen overlooks the dining room and comes equipped with beautiful granite countertops. The master suite is nestled in the corner of the home and boasts a spacious master bath and massive walk-in closet. A two-car garage completes this charming home. Estimated availability Sept 2020!
-
2020-07-03$195,499 New 404-char remark
Show marketing remark (404 chars)
The Durbin from our Cottage Collection features an open concept living space with 3 bedrooms and 2 baths. The gorgeous kitchen overlooks the dining room and comes equipped with beautiful granite countertops. The master suite is nestled in the corner of the home and boasts a spacious master bath and massive walk-in closet. A two-car garage completes this charming home. Estimated availability Sept 2020!
ⓘ Source: listings_history table (triggers on properties + properties_extension) + one-shot
backfill from property_details.listing_events for pre-trigger history.
Tax reassessment forecast TX · Resets to sale price
- Current annual tax
- $5,867 · $489/mo
- Projected year-2 tax
- $5,867 · $489/mo
- Expected delta
- $0/yr ($0/mo · 0.0%)
ⓘ Screening estimate from a state-policy table — verify with the county assessor before closing.
Climate risk First Street
- Flood 1/10 Low FEMA zone X (unshaded) · 0% chance over 30 yrs
- Wildfire 4/10 Moderate
- Heat 8/10 Severe 7 d/yr ≥108°F today · 23 d/yr by 30 yrs out
- Wind 8/10 Severe 80% chance of damaging wind over 30 yrs
- Air quality 2/10 Low 0 unhealthy d/yr today · 2 by 30 yrs out
Nearby sold comps map
Loading sold comps map…
Walkable amenities ~0.75 mi
Loading nearby amenities…
Taxation est. · year 1
- Rental income
- $19,779
- − Mortgage interest
- −$10,565
- − Property taxes
- −$5,867
- − Insurance
- −$943
- − Repairs & maintenance
- −$1,582
- − Management
- −$1,582
- − HOA
- −$204
- − Depreciation
- −$5,487
- Taxable loss
- −$6,451
- Est. tax savings @ 24.0%
- +$1,548
- After-tax cash flow
- $-1,709/yr
For passive investors: Depreciation is non-cash, so a rental often shows a tax loss while cash-flowing — sheltering income. Rental losses are passive: they offset passive income freely, and up to $25,000/yr can offset ordinary (W-2) income if you actively participate and your MAGI is under $100k (phasing out to $0 by $150k); unused losses carry forward. On sale, claimed depreciation is recaptured at up to 25%, and gains may owe capital-gains tax (a 1031 exchange can defer both). Figures are a year-1 estimate at your 24.0% rate — not tax advice; consult a CPA.
Schools (NCES district)
- District
- San Antonio ISD
- NCES district ID
- 4838730
- Math proficiency
- 12% ▼ -21.00%
- Reading proficiency
- 22% ▼ -7.00%
- Median HH income
- $30,952
- Composite
- 13.57/100
- National rank
- #9512
- State rank
- #805 of 826 in TX
Livability — San Antonio
- Score
- 80/100
- State rank
- #31
- US rank
- #1616
Category grades
Schools grade is shown separately in the Schools card above.
Census & demographics
- Census place
- San Antonio, TX
- County
- Bexar County · 1,990,555 people
- City population
- 1,806,925
- Metro
- San Antonio-New Braunfels, TX
- Population (ZIP)
- 19,423
- Household income
- $41,710
- Rent vs Own
- Severe rent burden
- 705.0
Population outlook (Bexar County) Hauer SSP2
- Today (2025)
- 2,336,851 people
- By 2030
- 2,560,728 · +9.6%
- By 2040
- 3,020,569 · +29.3%
- By 2050
- 3,493,522 · +49.5%
- By 2075
- 4,668,459 · +99.8%
- By 2100
- 5,533,242 · +136.8%
Race, ethnicity, and origin ACS 2023
- Neighborhood character
- Majority Hispanic (60%)
- Race & ethnicity
- Hispanic / Latino 60% Black 30% Two or more races 22% White 8%
- Hispanic origin (detail)
- Mexican 47% Puerto Rican 1%
- Foreign-born
- 11% · Canada
- Languages at home
- 63% English-only · Spanish 36%
Political lean MEDSL · Bexar
- 2024 margin
- Lean D (+9.8) · D 54.3% · R 44.6% · Other 1.1%
- 2008→2024 swing
- +4.2pp toward D · 2008: 5.6pp · 2024: 9.8pp
- All cycles
- 2024: D+9.8 2020: D+18.2 2016: D+13.5 2012: D+4.6 2008: D+5.6
Not yet ingested
- Civics
- —
Market trends
- HPI YoY
- ▲ 23.86%
- Current HPI
- 284.9844
- Rent YoY
- ▲ 0.53%
- Metro
- San Antonio-New Braunfels, TX
- State GDP YoY
- ▲ 3.95%
- F500 in state
- 110
Industry mix (Fortune 500 HQ in TX)
| Industry | F500 HQs | Revenue |
|---|---|---|
| Energy | 16 | $1,198B |
|
||
| Technology | 5 | $198B |
|
||
| Engineering / Construction | 4 | $72B |
|
||
| Energy Services | 3 | $60B |
|
||
| Utilities | 3 | $41B |
|
||
| Healthcare | 2 | $330B |
|
||
Price history
+4.9% since first listed3 events — show timeline
- 2026-04-08 Listed $205,000 LERA
- 2020-10-19 Sold (MLS) — LERA
- 2020-07-03 Listed $195,499 LERA
Property tax history
+52.8%/yrLatest (2025): $5,867 · -0.8% YoY. Source: county tax records.
Cash-flow waterfall
monthlySold comps — $/sqft
last 12 mo · ≤1 miLoading sold comps…