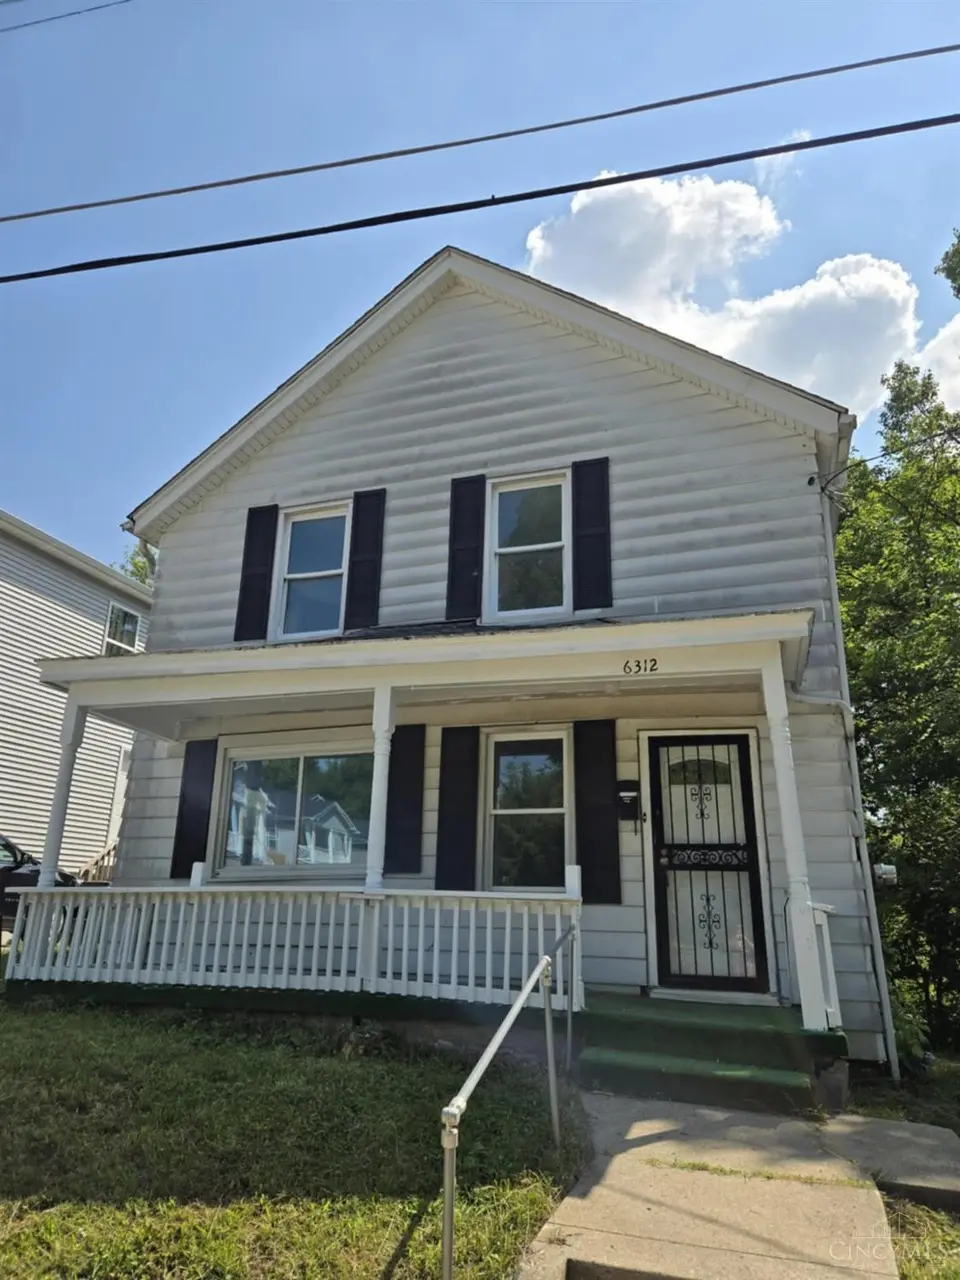
6312 Witherby Ave · Cincinnati, OH
Flood risk 1/10 · Minimal
- FEMA flood zone
- X (unshaded)
- Chance of flooding over 30 yrs
- 0.0%
- Est. flood insurance / yr
- $473 – $860
Fire risk 1/10 · Minimal
- Est. fire insurance / yr
- $713 – $1,323
Heat risk 3/10 · Minor
- Hot days now (above 103°F)
- 7 days/yr
- Hot days in 30 yrs
- 18 days/yr
Wind risk 2/10 · Minimal
- Chance of severe wind over 30 yrs
- 1.0%
Air-quality risk 2/10 · Minimal
- Unhealthy air days now
- 1 days/yr
- Unhealthy air days in 30 yrs
- 1 days/yr
Risk factors via First Street. Map © Google.
Why this score? — see what drove the B- grade
The composite is a weighted blend of 9 inputs, each scored 0–100. Each bar is that input's sub-score; the figure is the points it added to the 100-point composite (weight × sub-score).
- Cash flow +27.1/30.0
- ARV discount +15.0/15.0
- DSCR +9.4/10.0
- 1% rule +6.4/10.0
- Livability +4.0/5.0
- Rent growth +3.0/5.0
- Condition / age +2.5/5.0
- Schools +1.5/10.0
- Appreciation +0.0/10.0
$135,000
🖨 Deal sheet (PDF) 📄 Offer letter ✓ Due diligence
Listing remarks MLS
Solid house with many of the big expense items handled including a newer roof, brand new HVAC and water heater. This home just needs your cosmetic ideas! Good property for an owner occupant or good potential rental.
Key facts
- Built 1911
- Listed 73 days
Property features AI
Finance
- Other: Residential zoning; Public transportation (metro) access; Listing provided by RE/MAX Victory + Affiliates
- Financial info: Lease not considered
- HOA & community: No HOA
Exterior
- Parking: Driveway
- Security: Smoke alarm
- Utilities: Public water; Public sewer; Natural gas
- Home design: Traditional single-family home; Two levels; Stone foundation; Less than 0.5 acre lot; lot roughly 50 x 100
- Construction: Aluminum siding; Shingle roof
- Exterior features: Front porch; Busline nearby; City street access
Interior
- Kitchen: Walkout kitchen; Wood cabinets
- Bedrooms: Three bedrooms, all on second floor; Primary bedroom approximately 14 x 11; Second bedroom approximately 14 x 10; Third bedroom approximately 14 x 12
- Flooring: Wall-to-wall carpet in living room
- Bathrooms: One full bathroom on second floor
- Heating & cooling: Forced air heating (gas); Central air conditioning; Gas water heating
- Interior features: Six total rooms; Full basement with walkout; unfinished; Wall-to-wall carpet in living room; Smoke alarm
- Laundry & utility: Basement provides utility space
Neighborhood map
What this means for you Summary
Snapshot
- This is a 3-bed/1.0-bath single-family listed at $135k.
Deal economics
- At list price, monthly cash flow is $381 ($5k/yr) — positive.
- The deal already cash-flows at list — no discount required.
- Meets the 1% rule at list price ($2k rent vs $135k).
- Recommended offer: $127k (6.0% below list) — sets the bar for market timing.
- Cap rate 9.7% vs local median 3.9% in Cincinnati — top-decile yield for the area; either an underpriced asset or a hidden risk that comps aren't pricing in. Stress-test before assuming the spread holds.
Location & tenants
- Location reads 80/100 on livability (#130 in OH, #1,856 nationally) — a professional / high-income tenant draw. Strengths: amenities A+, commute A+, cost of living A+; Watch: employment D, crime F.
- North College Hill City (suburban): math 13% / reading 22% proficiency, ranked #637 of 656 in OH (top 97%) — low school quality limits family demand, transient renter base, plan for 1-2y turnover; 75% free/reduced lunch — lower-income household profile, screen leases tightly.
- Zoned schools: North College Hill Elementary School (math 17% / reading 22%, grade F, #1,293 of 1,584 statewide, top 83%, 481 students, 0% FRL); North College Hill Middle School (math 11% / reading 22%, grade F, #622 of 654 statewide, top 95%, 430 students, 0% FRL); North College Hill High School (math 12% / reading 22%, grade F, #701 of 781 statewide, top 90%, 333 students, 0% FRL) — zoned schools average 0% FRL vs 75% district-wide (75 pts lower); this property's tenant base skews higher-income than the district average.
- Market conditions: Rents rising (+1.8%/yr); 48 active listings in the ZIP; 20 comparable units currently listed for rent nearby; rentals at typical pace (median 19d on market — plan ~3-4 weeks tenant-placement turnaround); 801 units permitted in Hamilton County in 2024 (190 in 5+ unit buildings).
- This rent runs 33% of the median local income ($56k/yr) — at the standard rent-burdened threshold; future hikes will face affordability resistance.
Forward outlook
- Local home prices are declining (-3.0%/yr); year-one equity from $933 of loan paydown is wiped out by about $4k of value loss. Plan a longer hold.
Negotiation context
- It's been on market 74 days — a 6% lower offer ($127k) is reasonable based on typical stale-listing flexibility.
- 3 sale attempts since 9y ago; this cycle's ask has dropped $15k (10%) from the opening price — seller is motivated, your offer sets the floor, not the list.
- Current owner paid $30k; list at $135k implies a 350% gain — meaningful room to come down on a strong offer.
Risks & watch-outs
- Watch-outs: built in 1911 — expect roof / HVAC / electrical / plumbing capex.
Questions for the listing agent
- It's been on market 74 days. Have you received any prior offers? Is the seller open to a 6% concession, seller financing, or rate buy-down credit?
- Built in 1911 — when were the roof, HVAC, electrical panel, plumbing, and water heater last replaced?
- Why hasn't it sold? Are there any deal-killer items the seller is aware of (foundation, flood, title, zoning, code violations)?
- Is there a deadline driving the sale (1031 exchange, divorce, estate, relocation)? That informs how much negotiation room exists.
- Schools are B-rated — typically a magnet for longer-tenancy family renters. What's the average tenant stay here, and is there a school-zone premium baked into asking?
- Crime grade is F in this area — have there been break-ins, vandalism, or insurance claims at this property in the last 3 years? What carrier currently insures it and at what premium?
- What's the average days-on-market for RENTAL listings here right now (not sales)? A rising rental-DOM trend means longer vacancies and softer asking-rent achievability than the comps imply.
- What's the recent tenant-quality profile in this submarket — average credit score on applications, eviction rate, late-payment / NSF rate, and stable-employment percentage? A property-management company in the area should have these aggregated.
- How much new for-sale + rental construction is in the pipeline within 1–3 miles? Heavy new supply typically softens prices + rents 12–24 months out; constrained supply supports both.
Investment metrics
- 1% rule
- 1.14% ✓
- Cap rate
- 9.68%
- Cash-on-cash
- 12.10%
- DSCR
- 1.54
- GRM
- 7.3
CMA / ARV
- ARV (on-the-fly)
- $216,660
- Comps found
- 12
Show comp detail 12 sales within ~0.75 mi
| Address | Dist | Beds/Ba | Sqft | Sold | Price | $/sf | Match |
|---|---|---|---|---|---|---|---|
| 6623 Betts Ave | 0.44mi | 3/1.0 | 1,242 (-10%) | 0mo | $140,000 | $113 | 62 |
| 1961 Connecticut Ave | 0.50mi | 4/2.0 (+1) | 1,332 (-4%) | 3mo | $250,000 | $188 | 60 |
| 1708 De Armand Ave | 0.65mi | 2/1.0 (-1) | 1,415 (+2%) | 2mo | $222,500 | $157 | 59 |
| 2268 Deblin Dr | 0.47mi | 4/2.0 (+1) | 1,443 (+5%) | 3mo | $240,000 | $166 | 59 |
| 6537 Meis Ave | 0.60mi | 2/1.5 (-1) | 1,469 (+6%) | 1mo | $205,000 | $140 | 54 |
| 6381 Golfway Dr | 0.48mi | 4/1.5 (+1) | 1,245 (-10%) | 1mo | $199,500 | $160 | 54 |
| 1919 Sundale Ave | 0.43mi | 4/1.0 (+1) | 1,201 (-13%) | 1mo | $100,000 | $83 | 52 |
| 5781 Willowcove Dr | 0.58mi | 2/2.0 (-1) | 1,472 (+7%) | 2mo | $275,000 | $187 | 52 |
| 1944 Dallas Ave | 0.54mi | 3/1.0 | 1,199 (-13%) | 2mo | $199,500 | $166 | 51 |
| 2235 W North Bend Rd | 0.60mi | 3/2.0 | 1,576 (+14%) | 1mo | $135,000 | $86 | 43 |
| 6822 Betts Ave | 0.65mi | 2/1.0 (-1) | 1,182 (-14%) | 2mo | $128,000 | $108 | 39 |
| 2037 Carpenter | 0.67mi | 4/2.0 (+1) | 1,544 (+12%) | 2mo | $230,000 | $149 | 38 |
Match score weights: distance 35% · size 25% · config 20% · recency 20%. Top-matched comps best support the ARV.
Projected returns pro-forma
-3.0% appreciation · 1.82% rent growth · sell at horizon
- IRR
- 0.4%
- Equity multiple
- 1.01×
- Total profit
- $555
- Equity at exit
- $20,129
- IRR
- 8.9%
- Equity multiple
- 1.64×
- Total profit
- $24,347
- Equity at exit
- $11,672
Cash invested: $37,800 (down + closing). Projections, not guarantees.
Landlord ↔ Tenant lean methodology
- Overall (STATE)
- 73 Landlord-Friendly
- State Ohio
- 73 Landlord-Friendly · R+6
- County
- — inherits STATE
- City
- — inherits STATE
ZIP-level market 45224
- Rents YoY
- 1.8%
- Active inventory
- 48
- Price-to-rent
- 7.3×
Monthly cashflow live
- Estimated rent
- $1,542 high interval (Pro) →
- Mortgage (P&I)
- −$708
- Tax from tax record
- −$73 /mo · $877/yr
- Insurance
- −$56
- HOA
- −$0
- Vacancy / Maint / Mgmt
- −$324
- Net cashflow
- $381
Break-even live
Sensitivity live
| Price | -10% $458 | -5% $419 | +0% $381 | +5% $343 | +10% $305 |
|---|---|---|---|---|---|
| Rent | -10% $259 | -5% $320 | +0% $381 | +5% $442 | +10% $503 |
| Rate | -1.0pp $449 | -0.5pp $416 | base $381 | +0.5pp $346 | +1.0pp $311 |
UW: 25.0% down · 7.5% · 30yr · 1.5% tax · 5.0% vac · 8.0% maint · 8.0% mgmt
Financing live
Cash to close
- Down payment
- $33,750
- Closing costs
- $4,050
- Reserves months
- —
- Total cash needed
- —
Loan-product check · same deal, 3 products live
Conventional
25% down · 7.5% · 30yr
- Down + closing
- —
- Monthly P&I
- —
- Monthly cashflow
- —
- DSCR
- —
- Eligible?
- —
Personal DTI + credit; lowest rate.
DSCR
20% down · 8.5% · 30yr
- Down + closing
- —
- Monthly P&I
- —
- Monthly cashflow
- —
- DSCR
- —
- Eligible?
- —
No personal income docs; deal must DSCR.
Hard money
10% down · 12.0% · 12mo
- Down + closing
- —
- Monthly P&I
- —
- Monthly cashflow
- —
- DSCR
- —
- Eligible?
- —
Short-term bridge; refi at stabilization.
Rent comps 20 comps
| Address | Beds | Baths | Sqft | Rent | $/sqft | DOM | Units | Dist |
|---|---|---|---|---|---|---|---|---|
| 1834 Emerson Ave Cincinnati, OH | 2.0 | 1.0 | 1187 | $1,500 | $1.26 | 25d | 1 | 0.27mi |
| 1804 Waltham Ave Cincinnati, OH | 2.0 | 1.0 | 1186 | $1,425 | $1.20 | 9d | 1 | 0.36mi |
| 1720 W North Bend Rd Cincinnati, OH | 3.0 | 1.0 | 900 | $1,400 | $1.56 | 25d | 1 | 0.48mi |
| 5928 Belmont Ave Unit Washer Dryer Hookup Cincinnati, OH | 3.0 | 1.0 | 1120 | $1,395 | $1.25 | 18d | 1 | 0.59mi |
| 6211 Hamilton Ave Cincinnati, OH | 2.0 | 1.0–2.0 | 836 | $1,982 | $2.37 | 0d | 14 | 0.63mi |
| 5910 Belmont Ave Unit 3 Cincinnati, OH | 2.0 | 1.0 | 900 | $995 | $1.11 | 6d | 1 | 0.63mi |
| 5910 Belmont Ave Unit 3 Cincinnati, OH | 2.0 | 1.0 | 900 | $995 | $1.11 | 0d | 1 | 0.63mi |
| 6834 Betts Ave Cincinnati, OH | 4.0 | 1.5 | 1426 | $1,695 | $1.19 | 25d | 1 | 0.65mi |
| 1837 W Galbraith Rd Cincinnati, OH | 2.0 | 2.0 | 1087 | $1,500 | $1.38 | 25d | 1 | 0.70mi |
| 1604 W Galbraith Rd Unit F North College Hill, OH | 2.0 | 1.0 | 1250 | $1,150 | $0.92 | 17d | 1 | 0.81mi |
| 1740 Bising Ave North College Hill, OH | 3.0 | 2.0 | 1235 | $1,697 | $1.37 | 0d | 6 | 0.96mi |
| 2512 Rack Ct Unit 3 Cincinnati, OH | 2.0 | 1.0 | 900 | $1,125 | $1.25 | 25d | 1 | 0.96mi |
| 7032 La Boiteaux Ave Cincinnati, OH | 4.0 | 1.0 | 1200 | $1,800 | $1.50 | 25d | 1 | 0.98mi |
| 1628 Linden Dr Unit 937 Cincinnati, OH | 2.0 | 1.0 | 950 | $1,163 | $1.22 | 25d | 1 | 1.02mi |
| 1632 Linden Dr Unit 951 Cincinnati, OH | 2.0 | 1.0 | 950 | $1,099 | $1.16 | 0d | 1 | 1.02mi |
| 5843 Monfort Hills Ave Cincinnati, OH | 2.0 | 1.0 | 1820 | $1,200 | $0.66 | 25d | 1 | 1.05mi |
| 1409 Cedar Ave Cincinnati, OH | 3.0 | 1.0 | 1248 | $1,525 | $1.22 | 6d | 1 | 1.07mi |
| 5406 Scarletoak Dr Cincinnati, OH | 2.0 | 2.0 | 1508 | $2,400 | $1.59 | 5d | 1 | 1.16mi |
| 5824 Shadymist Ln Unit 3 Cincinnati, OH | 2.0 | 1.0 | 875 | $1,100 | $1.26 | 25d | 1 | 1.16mi |
| 6 Columbine Ct Unit 3 Cincinnati, OH | 3.0 | 1.5 | 992 | $1,795 | $1.81 | 0d | 1 | 1.40mi |
Listing history 22 events
-
2026-06-21days on market $135,000 Active 74 DOM
-
2026-06-18days on market $135,000 Active 71 DOM
-
2026-06-17days on market $135,000 Active 70 DOM
-
2026-06-16days on market $135,000 Active 69 DOM
-
2026-06-15days on market $135,000 Active 68 DOM
-
2026-06-13pricedays on market $135,000 Active 66 DOM
-
2026-06-09days on market $140,000 Active 62 DOM
-
2026-06-08days on market $140,000 Active 61 DOM
-
2026-06-07days on market $140,000 Active 60 DOM
-
2026-06-03days on market $140,000 Active 56 DOM
-
2026-06-02days on market $140,000 Active 55 DOM
-
2026-06-01days on market $140,000 Active 54 DOM
-
2026-05-31days on market $140,000 Active 53 DOM
-
2026-04-28price $140,000
-
2026-04-09$150,000 Active
-
2025-09-25historical $1,450
-
2025-09-24price $1,450
-
2025-08-21price $1,550
-
2025-07-31$1,600
-
2017-05-16soldstatus $30,000 Sold 216-char remark
Show marketing remark (216 chars)
Solid house with many of the big expense items handled including a newer roof, brand new HVAC and water heater. This home just needs your cosmetic ideas! Good property for an owner occupant or good potential rental.
-
2017-05-08historical Accept Backup Offers 216-char remark
Show marketing remark (216 chars)
Solid house with many of the big expense items handled including a newer roof, brand new HVAC and water heater. This home just needs your cosmetic ideas! Good property for an owner occupant or good potential rental.
-
2017-04-10$34,900 Active 216-char remark
Show marketing remark (216 chars)
Solid house with many of the big expense items handled including a newer roof, brand new HVAC and water heater. This home just needs your cosmetic ideas! Good property for an owner occupant or good potential rental.
ⓘ Source: listings_history table (triggers on properties + properties_extension) + one-shot
backfill from property_details.listing_events for pre-trigger history.
Tax reassessment forecast OH · Partial reset (capped growth)
- Current annual tax
- $877 · $73/mo
- Projected year-2 tax
- $1,492 · $124/mo
- Expected delta
- +$614/yr (+$51/mo · 70.1%)
ⓘ Screening estimate from a state-policy table — verify with the county assessor before closing.
Climate risk First Street
- Flood 1/10 Low FEMA zone X (unshaded) · 0% chance over 30 yrs
- Wildfire 1/10 Low
- Heat 3/10 Moderate 7 d/yr ≥103°F today · 18 d/yr by 30 yrs out
- Wind 2/10 Low 100% chance of damaging wind over 30 yrs
- Air quality 2/10 Low 1 unhealthy d/yr today · 1 by 30 yrs out
Nearby sold comps map
Loading sold comps map…
Walkable amenities ~0.75 mi
Loading nearby amenities…
Taxation est. · year 1
- Rental income
- $18,508
- − Mortgage interest
- −$7,562
- − Property taxes
- −$877
- − Insurance
- −$675
- − Repairs & maintenance
- −$1,481
- − Management
- −$1,481
- − Depreciation
- −$3,927
- Taxable income
- $2,505
- Est. tax owed @ 24.0%
- −$601
- After-tax cash flow
- $3,973/yr
For passive investors: Depreciation is non-cash, so a rental often shows a tax loss while cash-flowing — sheltering income. Rental losses are passive: they offset passive income freely, and up to $25,000/yr can offset ordinary (W-2) income if you actively participate and your MAGI is under $100k (phasing out to $0 by $150k); unused losses carry forward. On sale, claimed depreciation is recaptured at up to 25%, and gains may owe capital-gains tax (a 1031 exchange can defer both). Figures are a year-1 estimate at your 24.0% rate — not tax advice; consult a CPA.
Schools (NCES district)
- District
- North College Hill City
- NCES district ID
- 3904451
- Math proficiency
- 13% ▼ -14.00%
- Reading proficiency
- 22% ▼ -11.00%
- Median HH income
- $40,355
- Composite
- 14.89/100
- National rank
- #9375
- State rank
- #637 of 656 in OH
Livability — Cincinnati
- Score
- 80/100
- State rank
- #130
- US rank
- #1856
Category grades
Schools grade is shown separately in the Schools card above.
Census & demographics
- County
- Hamilton County · 701,295 people
- City population
- 505,555
- Metro
- Cincinnati, OH-KY-IN
- Population (ZIP)
- 21,900
- Household income
- $56,471
- Rent vs Own
- Severe rent burden
- 1382.0
Population outlook (Hamilton County) Hauer SSP2
- Today (2025)
- 826,054 people
- By 2030
- 830,947 · +0.6%
- By 2040
- 832,319 · +0.8%
- By 2050
- 822,428 · -0.4%
- By 2075
- 788,688 · -4.5%
- By 2100
- 710,674 · -14.0%
Race, ethnicity, and origin ACS 2023
- Neighborhood character
- Diverse neighborhood (Simpson 0.60)
- Race & ethnicity
- Black 51% White 37% Two or more races 6% Hispanic / Latino 5%
- Common ancestry
- Lithuanian 2% Italian 2% Slovak 1%
- Foreign-born
- 5% · Canada
- Languages at home
- 95% English-only · Spanish 3%
Political lean MEDSL · Hamilton
- 2024 margin
- D (+14.9) · D 57.0% · R 42.1%
- 2008→2024 swing
- +7.9pp toward D · 2008: 7.0pp · 2024: 14.9pp
- All cycles
- 2024: D+14.9 2020: D+15.9 2016: D+9.5 2012: D+4.9 2008: D+7.0
Not yet ingested
- Civics
- —
Market trends
- HPI YoY
- ▼ -148.06%
- Current HPI
- 224.1379
- Rent YoY
- ▲ 1.82%
- Metro
- Cincinnati, OH-KY-IN
- State GDP YoY
- ▲ 1.98%
- F500 in state
- 48
Industry mix (Fortune 500 HQ in OH)
| Industry | F500 HQs | Revenue |
|---|---|---|
| Insurance | 3 | $145B |
|
||
| Industrial Machinery | 3 | $49B |
|
||
| Financial Services | 3 | $24B |
|
||
| Consumer Goods | 2 | $93B |
|
||
| Aerospace / Defense | 2 | $47B |
|
||
| Utilities | 2 | $33B |
|
||
Price history
+301.1% since first listed9 events — show timeline
- 2026-04-28 Price Changed $140,000 Cincy MLS
- 2026-04-09 Listed $150,000 Cincy MLS
- 2025-09-25 Rental Removed $1,450 CINCYMLS
- 2025-09-24 Price Changed $1,450 CINCYMLS
- 2025-08-21 Price Changed $1,550 CINCYMLS
- 2025-07-31 Listed for Rent $1,600 CINCYMLS
- 2017-05-16 Sold (MLS) $30,000 Cincy MLS
- 2017-05-08 Contingent — Cincy MLS
- 2017-04-10 Listed $34,900 Cincy MLS
Property tax history
+7.2%/yrLatest (2025): $877 · +0.0% YoY. Source: county tax records.
Cash-flow waterfall
monthlySold comps — $/sqft
last 12 mo · ≤1 miLoading sold comps…