512 Farragut Ave · Hamilton, NJ
Flood risk 1/10 · Minimal
- FEMA flood zone
- X (unshaded)
- Chance of flooding over 30 yrs
- 0.0%
- Est. flood insurance / yr
- $507 – $1,088
Fire risk 5/10 · Moderate
- Est. fire insurance / yr
- $526 – $976
Heat risk 7/10 · Major
- Hot days now (above 102°F)
- 7 days/yr
- Hot days in 30 yrs
- 15 days/yr
Wind risk 8/10 · Major
- Chance of severe wind over 30 yrs
- 80.0%
Air-quality risk 3/10 · Minor
- Unhealthy air days now
- 1 days/yr
- Unhealthy air days in 30 yrs
- 4 days/yr
Risk factors via First Street. Map © Google.
Why this score? — see what drove the F grade
The composite is a weighted blend of 9 inputs, each scored 0–100. Each bar is that input's sub-score; the figure is the points it added to the 100-point composite (weight × sub-score).
- Appreciation +10.0/10.0
- Cash flow +8.5/30.0
- Rent growth +2.5/5.0
- Livability +2.5/5.0
- Condition / age +2.5/5.0
- 1% rule +2.3/10.0
- DSCR +2.3/10.0
- Schools +2.1/10.0
- ARV discount +0.0/15.0
$349,000
🖨 Deal sheet (PDF) 📄 Offer letter ✓ Due diligence
Listing remarks MLS
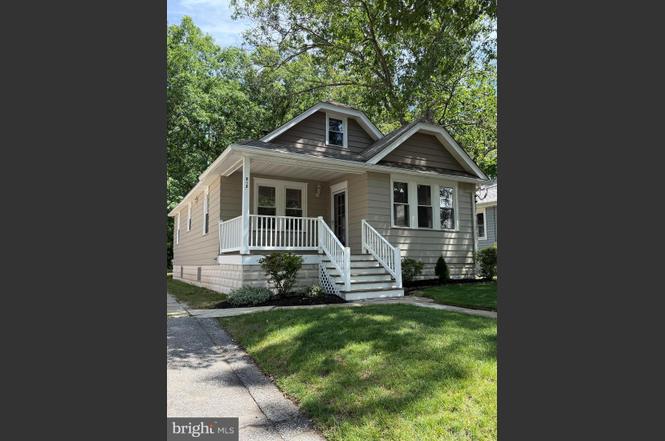
Charming Updated Home in the Heart of Mays Landing Welcome to this beautifully updated 3-bedroom, 1-bath home, originally built in 1931, where classic charm meets modern convenience. Nestled on a quiet street in the heart of Mays Landing, this adorable property offers a fantastic location within walking distance of WaWa and Shaner Elementary School. Step inside to discover a fresh, move-in-ready interior featuring new luxury vinyl plank flooring throughout, fresh paint in every room, and all-new light fixtures. The kitchen has been refreshed with refinished cabinets and countertops, while the newly remodeled bathroom adds a stylish modern touch. One of the home's standout features is the fully finished second floor, spanning the entire width of the house. Complete with closets, this versatile space is ideal as a spacious primary bedroom, home office, playroom, or flex space to suit your needs. Additional highlights include: - Convenient laundry room with washer and dryer - Covered front porch perfect for relaxing evenings - Spacious backyard with wooded views and no rear neighbors - Meticulously maintained home with thoughtful updates throughout - Low property taxes for added affordability Whether you're a first-time buyer, downsizing, or looking for a move-in-ready home with character, this Mays Landing gem offers exceptional value and comfort. Don't miss your opportunity to make this charming home your own—schedule your showing today!
Key facts
- Covered front porch
- Spacious backyard
- Thoughtful updates
Tags
Property features AI
Exterior
- Parking: Four total parking spaces; Two-car driveway; Two off-street spaces; On-street parking available
- Utilities: Public water; Public sewer; Electric cooling fuel; Hot water: natural gas
- Home design: Detached property; Shingle roof; Frame construction
- Construction: Frame construction with block foundation
- Exterior features: Lot dimensions approximately 50.24 x 115.00; Municipal trash service
Interior
- Bedrooms: Two main-level bedrooms; One upper-level bedroom
- Bathrooms: One full bathroom on the main level
- Heating & cooling: Radiator heating (oil-fired); Central air conditioning with ceiling fans; Hot water supplied by natural gas
- Interior features: Full, unfinished basement; Multiple access exits (2+)
Neighborhood map
What this means for you Summary
Snapshot
- This is a 3-bed/1.0-bath single-family listed at $349k.
Deal economics
- At list price, monthly cash flow is $-308 ($-4k/yr) — negative.
- To cash-flow at today's rent, offer at most $295k (15.6% below list).
- To meet the 1% rule (rent ≥ 1% of price), the offer needs to be $255k (27.0% below list).
- Recommended offer: $255k (27.0% below list) — sets the bar for 1% rule.
Location & tenants
- Location reads: area grade F — affects rentability + tenant quality, not the cash-flow math above.
- Hamilton Township School District (suburban): math 9% / reading 37% proficiency, ranked #401 of 472 in NJ (top 85%) — low school quality limits family demand, transient renter base, plan for 1-2y turnover.
- Zoned schools: George L. Hess Educational Complex (math 8% / reading 32%, grade F, #990 of 1,303 statewide, top 76%, 1,363 students, 53% FRL); William Davies Middle School (math 10% / reading 41%, grade F, #359 of 431 statewide, top 84%, 930 students, 51% FRL); Oakcrest High School (math 9% / reading 36%, grade F, #342 of 399 statewide, top 86%, 914 students, 61% FRL) — zoned schools average 55% FRL vs 37% district-wide (18 pts higher); higher-poverty schools than district average — tighter screening recommended.
- Market conditions: 244 active listings in the ZIP; 1 comparable units currently listed for rent nearby; solid renter incomes; 672 units permitted in Atlantic County in 2024 (258 in 5+ unit buildings).
- This rent runs 40% of the median local income ($77k/yr) — at the standard rent-burdened threshold; future hikes will face affordability resistance.
Forward outlook
- In year one you build about $37k of equity ($2k loan paydown + $35k appreciation (10.0% local appreciation)).
- Atlantic County population projected at -12% by 2050 — secular population decline; favor cash flow + early exit over multi-decade hold.
- By year 2, paydown + projected appreciation supports a ~$60k cash-out refi (75% LTV) — recoverable capital for the next deal without selling this one.
Negotiation context
- Only 7 days on market — expect competitive offers; lowballing is unlikely to land.
- 3 sale attempts since 12y ago with the ask held roughly flat each time — persistent listings suggest the price (not the market) is what's stuck; bring a comps-based counter.
Risks & watch-outs
- Watch-outs: built in 1931 — expect roof / HVAC / electrical / plumbing capex.
- Climate carrying-cost: severe wind risk, 80% chance of damaging wind over 30y; moderate wildfire risk; extreme-heat days projected 7→15/yr by 2055 (HVAC capex compounding) — expect insurance premiums to compound above CPI over the hold.
Questions for the listing agent
- What do current leases actually rent for vs. the listed asking? Can we see a recent rent roll and the last 12 months of T-12 income?
- Built in 1931 — when were the roof, HVAC, electrical panel, plumbing, and water heater last replaced?
- Is there a deadline driving the sale (1031 exchange, divorce, estate, relocation)? That informs how much negotiation room exists.
- The area grade is low — what's the realistic commute time and amenity access for the typical tenant pool here? Any planned neighborhood developments (good or bad) we should know about?
- What's the average days-on-market for RENTAL listings here right now (not sales)? A rising rental-DOM trend means longer vacancies and softer asking-rent achievability than the comps imply.
- What's the recent tenant-quality profile in this submarket — average credit score on applications, eviction rate, late-payment / NSF rate, and stable-employment percentage? A property-management company in the area should have these aggregated.
- How much new for-sale + rental construction is in the pipeline within 1–3 miles? Heavy new supply typically softens prices + rents 12–24 months out; constrained supply supports both.
Investment metrics
- 1% rule
- 0.73% ✗
- Cap rate
- 5.23%
- Cash-on-cash
- -3.79%
- DSCR
- 0.83
- GRM
- 11.4
CMA / ARV
- ARV (on-the-fly)
- $238,008
- Comps found
- 5
Show comp detail 5 sales within ~0.75 mi
| Address | Dist | Beds/Ba | Sqft | Sold | Price | $/sf | Match |
|---|---|---|---|---|---|---|---|
| 5913 7th | 0.10mi | 4/2.5 (+1) | 1,100 (-2%) | 18mo | $199,000 | $181 | 65 |
| 6029 Main St | 0.41mi | 2/1.0 (-1) | 1,199 (+6%) | 1mo | $135,000 | $113 | 64 |
| 5914 10th St | 0.23mi | 3/2.0 | 1,234 (+9%) | 20mo | $260,000 | $211 | 52 |
| 6031 Ken Scull Ave | 0.34mi | 3/2.0 | 1,273 (+13%) | 17mo | $313,500 | $246 | 45 |
| 5917 Parsons Row | 0.28mi | 3/2.0 | 989 (-12%) | 24mo | $225,000 | $228 | 42 |
Match score weights: distance 35% · size 25% · config 20% · recency 20%. Top-matched comps best support the ARV.
Projected returns pro-forma
10.0% appreciation · 3.0% rent growth · sell at horizon
- IRR
- 21.6%
- Equity multiple
- 2.74×
- Total profit
- $170,413
- Equity at exit
- $314,407
- IRR
- 19.5%
- Equity multiple
- 6.29×
- Total profit
- $517,253
- Equity at exit
- $678,030
Cash invested: $97,720 (down + closing). Projections, not guarantees.
Landlord ↔ Tenant lean methodology
- Overall (STATE)
- 21 Tenant-Leaning
- State New Jersey
- 21 Tenant-Leaning · D+6
- County
- — inherits STATE
- City
- — inherits STATE
ZIP-level market 08330
- Home prices YoY
- 3.9%
- Active inventory
- 244
- Price-to-rent
- 11.4×
Monthly cashflow live
- Estimated rent
- $2,549 medium interval (Pro) →
- Mortgage (P&I)
- −$1,830
- Tax from tax record
- −$346 /mo · $4,157/yr
- Insurance
- −$145
- HOA
- −$0
- Vacancy / Maint / Mgmt
- −$535
- Net cashflow
- $-308
Break-even live
Sensitivity live
| Price | -10% $-111 | -5% $-210 | +0% $-308 | +5% $-407 | +10% $-506 |
|---|---|---|---|---|---|
| Rent | -10% $-510 | -5% $-409 | +0% $-308 | +5% $-208 | +10% $-107 |
| Rate | -1.0pp $-133 | -0.5pp $-220 | base $-308 | +0.5pp $-399 | +1.0pp $-491 |
UW: 25.0% down · 7.5% · 30yr · 1.5% tax · 5.0% vac · 8.0% maint · 8.0% mgmt
Financing live
Cash to close
- Down payment
- $87,250
- Closing costs
- $10,470
- Reserves months
- —
- Total cash needed
- —
Loan-product check · same deal, 3 products live
Conventional
25% down · 7.5% · 30yr
- Down + closing
- —
- Monthly P&I
- —
- Monthly cashflow
- —
- DSCR
- —
- Eligible?
- —
Personal DTI + credit; lowest rate.
DSCR
20% down · 8.5% · 30yr
- Down + closing
- —
- Monthly P&I
- —
- Monthly cashflow
- —
- DSCR
- —
- Eligible?
- —
No personal income docs; deal must DSCR.
Hard money
10% down · 12.0% · 12mo
- Down + closing
- —
- Monthly P&I
- —
- Monthly cashflow
- —
- DSCR
- —
- Eligible?
- —
Short-term bridge; refi at stabilization.
Rent comps 1 comps
| Address | Beds | Baths | Sqft | Rent | $/sqft | DOM | Units | Dist |
|---|---|---|---|---|---|---|---|---|
| 6200 Old Harding Hwy Mays Landing, NJ | 1.0–2.0 | 1.0–2.0 | 987 | $2,239 | $2.27 | 0d | 1 | 1.14mi |
Listing history 7 events
-
2026-06-21days on market $349,000 Active 7 DOM
-
2026-06-19days on market $349,000 Active 5 DOM
-
2026-06-18days on market $349,000 Active 4 DOM
-
2026-06-17days on market $349,000 Active 3 DOM
-
2026-06-16days on market $349,000 Active 2 DOM
-
2026-06-15remarks 699-char remark
-
2026-06-15$349,000 Active 1 DOM
ⓘ Source: listings_history table (triggers on properties + properties_extension) + one-shot
backfill from property_details.listing_events for pre-trigger history.
Tax reassessment forecast NJ · Partial reset (capped growth)
- Current annual tax
- $4,157 · $346/mo
- Projected year-2 tax
- $6,424 · $535/mo
- Expected delta
- +$2,266/yr (+$189/mo · 54.5%)
ⓘ Screening estimate from a state-policy table — verify with the county assessor before closing.
Climate risk First Street
- Flood 1/10 Low FEMA zone X (unshaded) · 0% chance over 30 yrs
- Wildfire 5/10 Major
- Heat 7/10 Severe 7 d/yr ≥102°F today · 15 d/yr by 30 yrs out
- Wind 8/10 Severe 80% chance of damaging wind over 30 yrs
- Air quality 3/10 Moderate 1 unhealthy d/yr today · 4 by 30 yrs out
Nearby sold comps map
Loading sold comps map…
Walkable amenities ~0.75 mi
Loading nearby amenities…
Taxation est. · year 1
- Rental income
- $30,586
- − Mortgage interest
- −$19,549
- − Property taxes
- −$4,157
- − Insurance
- −$1,745
- − Repairs & maintenance
- −$2,447
- − Management
- −$2,447
- − Depreciation
- −$10,153
- Taxable loss
- −$9,912
- Est. tax savings @ 24.0%
- +$2,379
- After-tax cash flow
- $-1,323/yr
For passive investors: Depreciation is non-cash, so a rental often shows a tax loss while cash-flowing — sheltering income. Rental losses are passive: they offset passive income freely, and up to $25,000/yr can offset ordinary (W-2) income if you actively participate and your MAGI is under $100k (phasing out to $0 by $150k); unused losses carry forward. On sale, claimed depreciation is recaptured at up to 25%, and gains may owe capital-gains tax (a 1031 exchange can defer both). Figures are a year-1 estimate at your 24.0% rate — not tax advice; consult a CPA.
Schools (NCES district)
- District
- Hamilton Township School District
- NCES district ID
- 3406510
- Math proficiency
- 9% ▼ -20.00%
- Reading proficiency
- 37% ▼ -9.00%
- Median HH income
- $60,997
- Composite
- 21.34/100
- National rank
- #8372
- State rank
- #401 of 472 in NJ
Livability — Hamilton
No livability data for this city. (Only ~50 U.S. cities are tracked.)
Census & demographics
- Census place
- Mays Landing, NJ
- County
- Atlantic County · 143,611 people
- Metro
- Atlantic City-Hammonton, NJ
- Population (ZIP)
- 29,972
- Household income
- $77,167
- Rent vs Own
- Severe rent burden
- 1003.0
Population outlook (Atlantic County) Hauer SSP2
- Today (2025)
- 268,948 people
- By 2030
- 264,497 · -1.7%
- By 2040
- 252,261 · -6.2%
- By 2050
- 237,846 · -11.6%
- By 2075
- 210,650 · -21.7%
- By 2100
- 180,234 · -33.0%
Race, ethnicity, and origin ACS 2023
- Neighborhood character
- Diverse neighborhood (Simpson 0.62)
- Race & ethnicity
- White 58% Hispanic / Latino 16% Black 14% Two or more races 13% Asian 4%
- Hispanic origin (detail)
- Puerto Rican 7% Dominican 4%
- Common ancestry
- Romanian 3% Italian 2% Lithuanian 1%
- Foreign-born
- 9% · Canada, Vietnam, Guatemala
- Languages at home
- 84% English-only · Spanish 10% Tagalog/Filipino 1% Other Indo-European 1%
Political lean MEDSL · Atlantic
- 2024 margin
- Toss-up / Even · D 47.7% · R 50.7% · Other 1.6%
- 2008→2024 swing
- -18.1pp toward R · 2008: 15.1pp · 2024: -3.0pp
- All cycles
- 2024: R+3.0 2020: D+6.7 2016: D+6.2 2012: D+17.2 2008: D+15.1
Not yet ingested
- Civics
- —
Market trends
- HPI YoY
- ▲ 11.58%
- Current HPI
- 308.5148
- Rent YoY
- —
- Metro
- Atlantic City-Hammonton, NJ
- State GDP YoY
- ▲ 2.05%
- F500 in state
- 34
Industry mix (Fortune 500 HQ in NJ)
| Industry | F500 HQs | Revenue |
|---|---|---|
| Consumer Goods | 3 | $31B |
|
||
| Pharmaceuticals | 2 | $153B |
|
||
| Technology | 2 | $21B |
|
||
| Insurance | 2 | $20B |
|
||
| Healthcare | 2 | $19B |
|
||
| Financial Services | 1 | $70B |
|
||
Price history
+105.4% since first listed4 events — show timeline
- 2026-06-14 Listed $349,000 BRIGHT MLS
- 2026-06-14 Listed $349,000 SJSRMLS
- 2015-02-02 Listing Removed — SJSRMLS
- 2014-09-30 Listed $169,900 SJSRMLS
Property tax history
+1.5%/yrLatest (2025): $4,157 · +2.6% YoY. Source: county tax records.
Cash-flow waterfall
monthlySold comps — $/sqft
last 12 mo · ≤1 miLoading sold comps…