8108 Lake View Dr S · Ellenton, FL
Flood risk 1/10 · Minimal
- FEMA flood zone
- X (unshaded)
- Chance of flooding over 30 yrs
- 0.0%
- Est. flood insurance / yr
- $507 – $1,088
Fire risk 3/10 · Minor
- Est. fire insurance / yr
- $947 – $1,759
Heat risk 10/10 · Severe
- Hot days now (above 107°F)
- 7 days/yr
- Hot days in 30 yrs
- 28 days/yr
Wind risk 10/10 · Severe
- Chance of severe wind over 30 yrs
- 99.0%
Air-quality risk 3/10 · Minor
- Unhealthy air days now
- 3 days/yr
- Unhealthy air days in 30 yrs
- 3 days/yr
Risk factors via First Street. Map © Google.
Why this score? — see what drove the B grade
The composite is a weighted blend of 9 inputs, each scored 0–100. Each bar is that input's sub-score; the figure is the points it added to the 100-point composite (weight × sub-score).
- Cash flow +30.0/30.0
- 1% rule +10.0/10.0
- DSCR +10.0/10.0
- ARV discount +7.5/15.0
- Schools +4.4/10.0
- Livability +3.8/5.0
- Condition / age +3.8/5.0
- Rent growth +2.5/5.0
- Appreciation +0.0/10.0
$79,900
🖨 Deal sheet (PDF) 📄 Offer letter ✓ Due diligence
Listing remarks
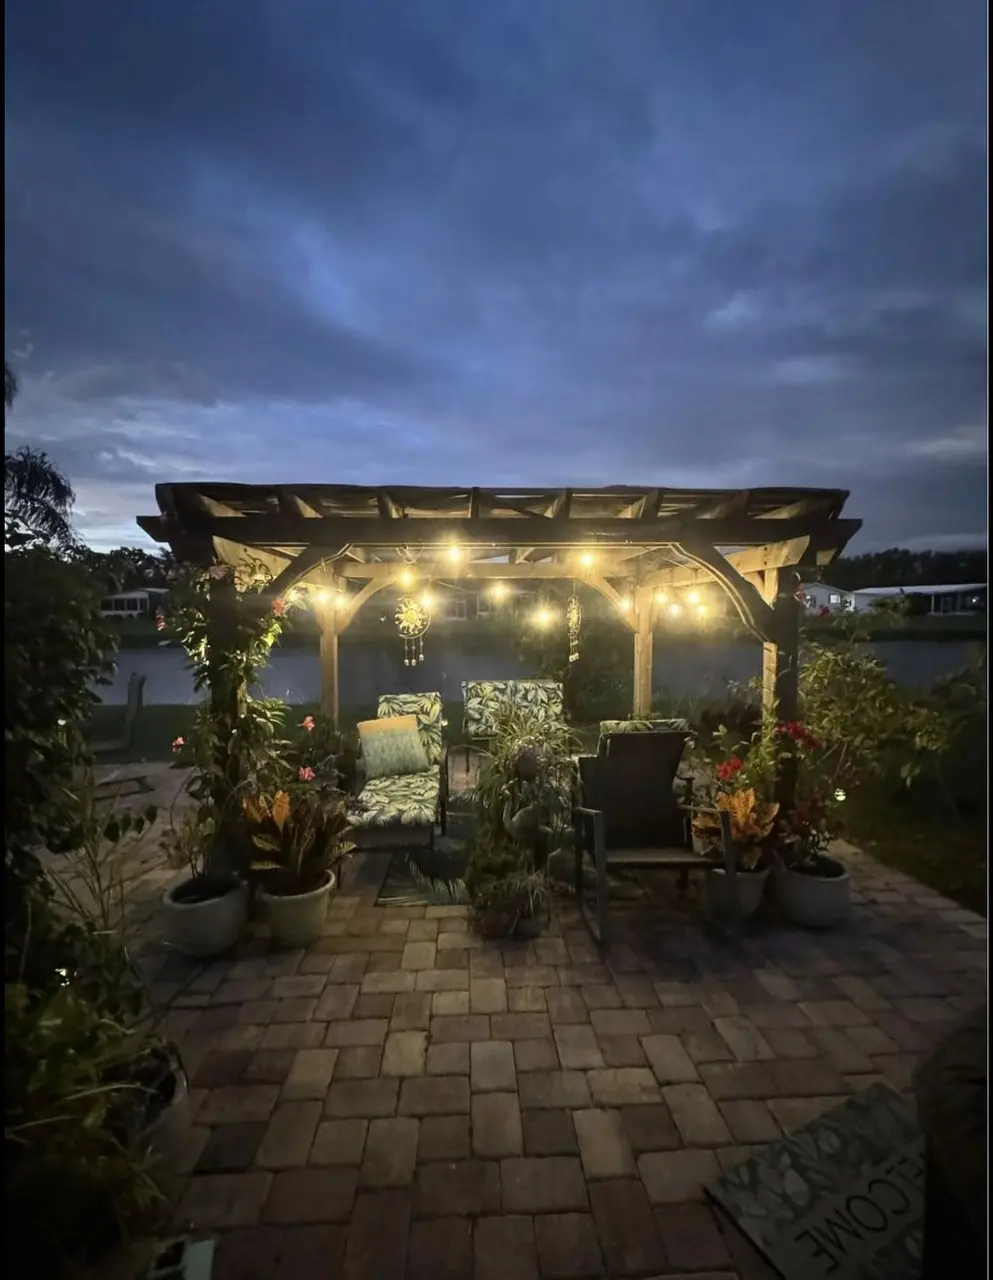
This stunning waterfront Florida home is located in the desirable Colony Cove 55+ community--- Northside. * * * * Resident--Investor-- * * * * Average rental income after lot rent paid--- $500-$900 monthly First person 55 yrs, 2nd person over 45 yrs. The inviting outdoor space has been upgraded with 16 x 29 paved patio and a 10 x 12 pergola-- along with a NEW Saluspa hot tub for 2-4 persons. Relax and watch sunrise/sunsets daily! Tons of wildlife in your back yard! The 2 bedroom 2 bath home plus Florida room has bright and inviting living spaces --an open concept. Large island in kitchen makes a cozy friendly space while preparing meals. * * * Beautiful Laminate flooring througho
Key facts
- Saluspa hot tub
- Paved patio
- New a/c
Tags
Neighborhood map
What this means for you Summary
Snapshot
- This is a 2-bed/2.0-bath single-family listed at $80k. Condition is rated good.
Deal economics
- At list price, monthly cash flow is $974 ($12k/yr) — positive.
- The deal already cash-flows at list — no discount required.
- Meets the 1% rule at list price ($2k rent vs $80k).
- Cap rate 20.9% vs local median 4.5% in Ellenton — top-decile yield for the area; either an underpriced asset or a hidden risk that comps aren't pricing in. Stress-test before assuming the spread holds.
Location & tenants
- Location reads 76/100 on livability (#232 in FL, #3,666 nationally) — a middle-class / working-renter tenant base. Strengths: cost of living A+, housing A+, health & safety A+; Watch: schools D+, amenities F, commute F.
- Manatee (suburban): math 54% / reading 50% proficiency, ranked #26 of 73 in FL (top 36%) — acceptable for families but not a draw, mixed tenant base, ~2y average lease.
- Market conditions: 182 active listings in the ZIP; 10 comparable units currently listed for rent nearby; rentals at typical pace (median 23d on market — plan ~3-4 weeks tenant-placement turnaround); 7,472 units permitted in Manatee County in 2024 (1,782 in 5+ unit buildings).
- This rent runs 36% of the median local income ($64k/yr) — at the standard rent-burdened threshold; future hikes will face affordability resistance.
Forward outlook
- Local home prices are declining (-3.0%/yr); year-one equity from $552 of loan paydown is wiped out by about $2k of value loss. Plan a longer hold.
- Manatee County population projected at +43% by 2050 — long-run rental-demand tailwind backs the buy-and-hold thesis.
- At projected returns (-3.0% appreciation + 3.0% rent growth), your $22k cash investment doubles in ~3 years — after that, you're playing with house money.
Negotiation context
- Only 14 days on market — expect competitive offers; lowballing is unlikely to land.
Risks & watch-outs
- Climate carrying-cost: severe wind risk, 99% chance of damaging wind over 30y; extreme-heat days projected 7→28/yr by 2055 (HVAC capex compounding) — expect insurance premiums to compound above CPI over the hold.
Questions for the listing agent
- Is there a deadline driving the sale (1031 exchange, divorce, estate, relocation)? That informs how much negotiation room exists.
- Schools are D-rated, which usually means shorter tenancies and higher turnover. Who's the typical renter profile here, and what's been the actual vacancy rate?
- What's the average days-on-market for RENTAL listings here right now (not sales)? A rising rental-DOM trend means longer vacancies and softer asking-rent achievability than the comps imply.
- What's the recent tenant-quality profile in this submarket — average credit score on applications, eviction rate, late-payment / NSF rate, and stable-employment percentage? A property-management company in the area should have these aggregated.
- How much new for-sale + rental construction is in the pipeline within 1–3 miles? Heavy new supply typically softens prices + rents 12–24 months out; constrained supply supports both.
Investment metrics
- 1% rule
- 2.42% ✓
- Cap rate
- 20.92%
- Cash-on-cash
- 52.25%
- DSCR
- 3.32
- GRM
- 3.4
CMA / ARV
- ARV (on-the-fly)
- $180,752
- Comps found
- 7
Show comp detail 7 sales within ~0.75 mi
| Address | Dist | Beds/Ba | Sqft | Sold | Price | $/sf | Match |
|---|---|---|---|---|---|---|---|
| 3407 Glenda Ln | 0.51mi | 2/2.0 | 1,072 (-6%) | 19mo | $169,000 | $158 | 50 |
| 3436 71st Ave E | 0.74mi | 2/2.0 | 1,188 (+4%) | 16mo | $250,000 | $210 | 46 |
| 3408 Glenda Ln | 0.51mi | 2/2.0 | 1,007 (-12%) | 14mo | $170,000 | $169 | 44 |
| 3100 Donna Dr | 0.67mi | 2/2.0 | 1,200 (+5%) | 23mo | $142,000 | $118 | 41 |
| 8211 Gretchen Pl | 0.50mi | 2/2.0 | 1,300 (+14%) | 20mo | $148,000 | $114 | 37 |
| 3306 Evelyn Dr | 0.54mi | 2/2.0 | 978 (-14%) | 18mo | $174,900 | $179 | 35 |
| 3101 Darnea Ln | 0.72mi | 2/2.0 | 1,032 (-10%) | 23mo | $82,000 | $79 | 31 |
Match score weights: distance 35% · size 25% · config 20% · recency 20%. Top-matched comps best support the ARV.
Projected returns pro-forma
-3.0% appreciation · 3.0% rent growth · sell at horizon
- IRR
- 50.2%
- Equity multiple
- 3.20×
- Total profit
- $49,119
- Equity at exit
- $11,913
- IRR
- 55.7%
- Equity multiple
- 6.49×
- Total profit
- $122,773
- Equity at exit
- $6,908
Cash invested: $22,372 (down + closing). Projections, not guarantees.
Landlord ↔ Tenant lean methodology
- Overall (STATE)
- 87 Strongly Landlord-Friendly
- State Florida
- 87 Strongly Landlord-Friendly · R+3
- County
- — inherits STATE
- City
- — inherits STATE
ZIP-level market 34222
- Home prices YoY
- -26.9%
- Active inventory
- 182
- Price-to-rent
- 3.4×
Monthly cashflow live
- Estimated rent
- $1,932 high interval (Pro) →
- Mortgage (P&I)
- −$419
- Tax est. 1.5%
- −$100 /mo · $1,198/yr
- Insurance
- −$33
- HOA
- −$0
- Vacancy / Maint / Mgmt
- −$406
- Net cashflow
- $974
Break-even live
Sensitivity live
| Price | -10% $1,029 | -5% $1,002 | +0% $974 | +5% $946 | +10% $919 |
|---|---|---|---|---|---|
| Rent | -10% $821 | -5% $898 | +0% $974 | +5% $1,050 | +10% $1,127 |
| Rate | -1.0pp $1,014 | -0.5pp $994 | base $974 | +0.5pp $953 | +1.0pp $932 |
UW: 25.0% down · 7.5% · 30yr · 1.5% tax · 5.0% vac · 8.0% maint · 8.0% mgmt
Financing live
Cash to close
- Down payment
- $19,975
- Closing costs
- $2,397
- Reserves months
- —
- Total cash needed
- —
Loan-product check · same deal, 3 products live
Conventional
25% down · 7.5% · 30yr
- Down + closing
- —
- Monthly P&I
- —
- Monthly cashflow
- —
- DSCR
- —
- Eligible?
- —
Personal DTI + credit; lowest rate.
DSCR
20% down · 8.5% · 30yr
- Down + closing
- —
- Monthly P&I
- —
- Monthly cashflow
- —
- DSCR
- —
- Eligible?
- —
No personal income docs; deal must DSCR.
Hard money
10% down · 12.0% · 12mo
- Down + closing
- —
- Monthly P&I
- —
- Monthly cashflow
- —
- DSCR
- —
- Eligible?
- —
Short-term bridge; refi at stabilization.
Rent comps 10 comps
| Address | Beds | Baths | Sqft | Rent | $/sqft | DOM | Units | Dist |
|---|---|---|---|---|---|---|---|---|
| 4212 Long Lake Way Ellenton, FL | 2.0 | 2.0 | 1000 | $1,900 | $1.90 | 25d | 1 | 0.03mi |
| 3908 Lemonwood Dr N Ellenton, FL | 2.0 | 2.0 | 1400 | $1,750 | $1.25 | 25d | 1 | 0.20mi |
| 8314 Nancy Ln Ellenton, FL | 2.0 | 2.0 | 1404 | $1,895 | $1.35 | 25d | 1 | 0.37mi |
| 3808 Sunset Dr Ellenton, FL | 3.0 | 2.0 | 1441 | $1,699 | $1.18 | 22d | 1 | 0.38mi |
| 7711 Desoto Dr Ellenton, FL | 2.0 | 2.5 | 1356 | $1,599 | $1.18 | 16d | 1 | 0.43mi |
| 2711 80th Ave E Ellenton, FL | 3.0 | 2.0 | 1000 | $1,836 | $1.84 | 4d | 1 | 0.90mi |
| 3931 Day Bridge Pl Ellenton, FL | 3.0 | 2.0 | 1250 | $2,295 | $1.84 | 4d | 1 | 0.90mi |
| 5605 78th Ave E Palmetto, FL | 3.0 | 2.0 | 1415 | $2,800 | $1.98 | 22d | 1 | 0.97mi |
| 482 Outer Dr Unit NA Ellenton, FL | 3.0 | 2.0 | 1400 | $1,600 | $1.14 | 4d | 1 | 1.08mi |
| 9922 52nd St E Parrish, FL | 3.0 | 2.0 | 1270 | $2,250 | $1.77 | 4d | 1 | 1.37mi |
Listing history 11 events
-
2026-06-18days on market $79,900 Active 14 DOM
-
2026-06-17days on market $79,900 Active 13 DOM
-
2026-06-16days on market $79,900 Active 12 DOM
-
2026-06-15days on market $79,900 Active 11 DOM
-
2026-06-13days on market $79,900 Active 9 DOM
-
2026-06-13days on market $79,900 Active 8 DOM
-
2026-06-10days on market $79,900 Active 6 DOM
-
2026-06-09days on market $79,900 Active 5 DOM
-
2026-06-08days on market $79,900 Active 4 DOM
-
2026-06-08remarks 699-char remark
-
2026-06-08$79,900 Active 3 DOM
ⓘ Source: listings_history table (triggers on properties + properties_extension) + one-shot
backfill from property_details.listing_events for pre-trigger history.
Climate risk First Street
- Flood 1/10 Low FEMA zone X (unshaded) · 0% chance over 30 yrs
- Wildfire 3/10 Moderate
- Heat 10/10 Extreme 7 d/yr ≥107°F today · 28 d/yr by 30 yrs out
- Wind 10/10 Extreme 99% chance of damaging wind over 30 yrs
- Air quality 3/10 Moderate 3 unhealthy d/yr today · 3 by 30 yrs out
Nearby sold comps map
Loading sold comps map…
Walkable amenities ~0.75 mi
Loading nearby amenities…
Taxation est. · year 1
- Rental income
- $23,183
- − Mortgage interest
- −$4,476
- − Property taxes
- −$1,198
- − Insurance
- −$400
- − Repairs & maintenance
- −$1,855
- − Management
- −$1,855
- − Depreciation
- −$2,324
- Taxable income
- $11,076
- Est. tax owed @ 24.0%
- −$2,658
- After-tax cash flow
- $9,030/yr
For passive investors: Depreciation is non-cash, so a rental often shows a tax loss while cash-flowing — sheltering income. Rental losses are passive: they offset passive income freely, and up to $25,000/yr can offset ordinary (W-2) income if you actively participate and your MAGI is under $100k (phasing out to $0 by $150k); unused losses carry forward. On sale, claimed depreciation is recaptured at up to 25%, and gains may owe capital-gains tax (a 1031 exchange can defer both). Figures are a year-1 estimate at your 24.0% rate — not tax advice; consult a CPA.
Condition & rehab AI · 12 photos
This well-maintained waterfront home in Colony Cove 55+ community is move-in ready with a paved patio, pergola, and new Saluspa hot tub. It offers a great rental opportunity with a beautiful outdoor space and a desirable location.
Value-add opportunities
- Both Landscaping — Enhances curb appeal and adds value for both resale and rental.
- Both Patio furniture — Improves outdoor living space and adds value for both resale and rental.
Renovation cost estimate screening
Value-add ROI direction
- Both Landscaping — Enhances curb appeal and adds value for both resale and rental. ↑
- Both Patio furniture — Improves outdoor living space and adds value for both resale and rental. ↑
ⓘ Cost ranges are severity-bucket heuristics (US national rule-of-thumb). Get contractor quotes + a written scope before underwriting a rehab budget.
Schools (NCES district)
- District
- Manatee
- NCES district ID
- 1201230
- Math proficiency
- 54% ▼ -6.00%
- Reading proficiency
- 50% ▼ -2.00%
- Median HH income
- $49,607
- Composite
- 44.43/100
- National rank
- #2806
- State rank
- #26 of 73 in FL
Livability — Ellenton
- Score
- 76/100
- State rank
- #232
- US rank
- #3666
Category grades
Schools grade is shown separately in the Schools card above.
Census & demographics
- County
- Manatee County · 416,364 people
- City population
- 14,819
- Metro
- North Port-Sarasota-Bradenton, FL
- Population (ZIP)
- 14,819
- Household income
- $64,355
- Rent vs Own
- Severe rent burden
- 313.0
Population outlook (Manatee County) Hauer SSP2
- Today (2025)
- 447,342 people
- By 2030
- 488,911 · +9.3%
- By 2040
- 567,934 · +27.0%
- By 2050
- 637,995 · +42.6%
- By 2075
- 781,970 · +74.8%
- By 2100
- 848,272 · +89.6%
Race, ethnicity, and origin ACS 2023
- Neighborhood character
- Predominantly White (70%)
- Race & ethnicity
- White 70% Hispanic / Latino 17% Two or more races 13% Black 7% Native American 2% Asian 1%
- Hispanic origin (detail)
- Mexican 8% Puerto Rican 2%
- Common ancestry
- Romanian 3% Slovak 2% Lithuanian 2%
- Foreign-born
- 8% · Canada, Jamaica, Vietnam
- Languages at home
- 88% English-only · Spanish 10% Other Indo-European 1% Vietnamese 1%
Political lean MEDSL · Manatee
- 2024 margin
- Strong R (+23.5) · D 37.9% · R 61.4%
- 2008→2024 swing
- -16.5pp toward R · 2008: -7.0pp · 2024: -23.5pp
- All cycles
- 2024: R+23.5 2020: R+16.1 2016: R+17.1 2012: R+12.5 2008: R+7.0
Not yet ingested
- Civics
- —
Market trends
- HPI YoY
- ▼ -107.75%
- Current HPI
- 293.2597
- Rent YoY
- —
- Metro
- North Port-Sarasota-Bradenton, FL
- State GDP YoY
- ▲ 3.28%
- F500 in state
- 36
Industry mix (Fortune 500 HQ in FL)
| Industry | F500 HQs | Revenue |
|---|---|---|
| Industrial Technology | 2 | $29B |
|
||
| Insurance | 2 | $17B |
|
||
| Retail | 1 | $60B |
|
||
| Technology Distribution | 1 | $58B |
|
||
| Homebuilding | 1 | $35B |
|
||
| Technology Manufacturing | 1 | $35B |
|
||
Price history
1 event — show timeline
- 2026-06-04 Listed $79,900 ForSaleByOwner.com
Cash-flow waterfall
monthlySold comps — $/sqft
last 12 mo · ≤1 miLoading sold comps…