21621 Sandia Rd #150 · Apple Valley, CA
Flood risk 4/10 · Minor
- FEMA flood zone
- D
- Chance of flooding over 30 yrs
- 0.2%
- Est. flood insurance / yr
- $544 – $1,084
Fire risk 6/10 · Moderate
- Est. fire insurance / yr
- $659 – $1,223
Heat risk 7/10 · Major
- Hot days now (above 99°F)
- 5 days/yr
- Hot days in 30 yrs
- 14 days/yr
Wind risk 1/10 · Minimal
- Chance of severe wind over 30 yrs
- —
Air-quality risk 10/10 · Severe
- Unhealthy air days now
- 25 days/yr
- Unhealthy air days in 30 yrs
- 30 days/yr
Risk factors via First Street. Map © Google.
Why this score? — see what drove the D+ grade
The composite is a weighted blend of 9 inputs, each scored 0–100. Each bar is that input's sub-score; the figure is the points it added to the 100-point composite (weight × sub-score).
- Cash flow +17.7/30.0
- ARV discount +7.5/15.0
- DSCR +5.5/10.0
- 1% rule +4.8/10.0
- Condition / age +4.0/5.0
- Rent growth +3.6/5.0
- Schools +3.1/10.0
- Livability +3.1/5.0
- Appreciation +0.0/10.0
$205,000
🖨 Deal sheet (PDF) 📄 Offer letter ✓ Due diligence
Listing remarks MLS
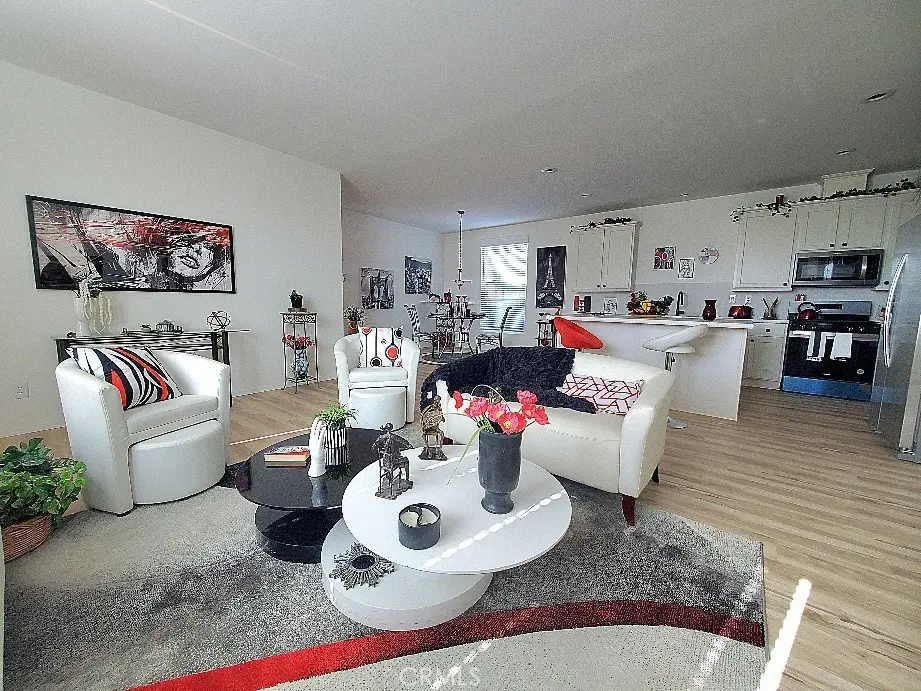
BRAND NEW NEVER BEEN LIVED IN 3 bedroom, 2 bath home with 2 CAR GARAGE. MOUNTAIN VIEW VILLAS, gated senior 55+ community. This prestigious resort style living is offering one of the final opportunities to own a brand new home to a lucky few. This manufactured home will come with a 1 year home warranty, with window treatments, quality cabinetry throughout, laminate flooring, full size fridge, microwave, dishwasher, garbage disposal, & huge single sink. This is all owner occupied homes, no renter's with park rent only $786. There is a private clubhouse pool, spa, workout room, card room, full banquet style kitchen. A doggy park is available for your fur babies and RV storage upon availability. The Jess Ranch Market Place is minutes away for major shopping and entertainment. Just approximately 90 Minutes from LA & Orange Co. DEALER HAS A PREFERRED LENDER WITH AS LOW AS 5% DOWN. SELLER WILL CREDIT 3 MONTHS FREE SPACE RENT OR MAY BUY DOWN INTEREST RATE. Dealer#1254134, SP1578710.HOME Serial #CAV110AZ24-22052A/B
Key facts
- Mountain view villas
- Private clubhouse
- Doggy park
Tags
Neighborhood map
What this means for you Summary
Snapshot
- This is a 3-bed/2.0-bath manufactured listed at $205k. Condition is rated good.
Deal economics
- At list price, monthly cash flow is $165 ($2k/yr) — positive.
- The deal already cash-flows at list — no discount required.
- To meet the 1% rule (rent ≥ 1% of price), the offer needs to be $200k (2.3% below list).
- Recommended offer: $180k (12.0% below list) — sets the bar for market timing.
- Cap rate 7.3% vs local median 3.5% in Apple Valley — top-decile yield for the area; either an underpriced asset or a hidden risk that comps aren't pricing in. Stress-test before assuming the spread holds.
Location & tenants
- Location reads 61/100 on livability (#532 in CA) — a middle-class / working-renter tenant base. Strengths: housing A+, commute B+; Watch: employment D+, crime D-, amenities F.
- Apple Valley Unified (suburban): math 25% / reading 40% proficiency, ranked #955 of 1,400 in CA (top 68%) — families likely to look elsewhere, expect single-tenant / working-renter base with shorter leases; 60% free/reduced lunch — lower-income household profile, screen leases tightly.
- Zoned schools: Vanguard Preparatory (1,135 students, 69% FRL); Apple Valley High (2,206 students, 62% FRL).
- Market conditions: Rents rising fast (+4.3%/yr); 429 active listings in the ZIP; 12 comparable units currently listed for rent nearby; rentals at typical pace (median 26d on market — plan ~3-4 weeks tenant-placement turnaround); 42% of comp listings sitting > 30 days — soft ceiling on asking rent; 5,458 units permitted in San Bernardino County in 2024 (1,500 in 5+ unit buildings).
- This rent runs 36% of the median local income ($67k/yr) — at the standard rent-burdened threshold; future hikes will face affordability resistance.
Forward outlook
- Local home prices are declining (-3.0%/yr); year-one equity from $1k of loan paydown is wiped out by about $6k of value loss. Plan a longer hold.
- San Bernardino County population projected at +15% by 2050 — modest demand growth; plan on rents tracking national, not racing it.
Negotiation context
- It's been on market 142 days — a 12% lower offer ($180k) is reasonable based on typical stale-listing flexibility.
- 2 sale attempts with the ask held roughly flat each time — persistent listings suggest the price (not the market) is what's stuck; bring a comps-based counter.
Risks & watch-outs
- Climate carrying-cost: major wildfire risk; extreme-heat days projected 5→14/yr by 2055 (HVAC capex compounding) — expect insurance premiums to compound above CPI over the hold.
Questions for the listing agent
- It's been on market 142 days. Have you received any prior offers? Is the seller open to a 12% concession, seller financing, or rate buy-down credit?
- Why hasn't it sold? Are there any deal-killer items the seller is aware of (foundation, flood, title, zoning, code violations)?
- Is there a deadline driving the sale (1031 exchange, divorce, estate, relocation)? That informs how much negotiation room exists.
- Schools are F-rated, which usually means shorter tenancies and higher turnover. Who's the typical renter profile here, and what's been the actual vacancy rate?
- Crime grade is D in this area — have there been break-ins, vandalism, or insurance claims at this property in the last 3 years? What carrier currently insures it and at what premium?
- The area grade is low — what's the realistic commute time and amenity access for the typical tenant pool here? Any planned neighborhood developments (good or bad) we should know about?
- What's the average days-on-market for RENTAL listings here right now (not sales)? A rising rental-DOM trend means longer vacancies and softer asking-rent achievability than the comps imply.
- What's the recent tenant-quality profile in this submarket — average credit score on applications, eviction rate, late-payment / NSF rate, and stable-employment percentage? A property-management company in the area should have these aggregated.
- How much new for-sale + rental construction is in the pipeline within 1–3 miles? Heavy new supply typically softens prices + rents 12–24 months out; constrained supply supports both.
Investment metrics
- 1% rule
- 0.98% ✗
- Cap rate
- 7.26%
- Cash-on-cash
- 3.45%
- DSCR
- 1.15
- GRM
- 8.5
CMA / ARV
- ARV (median comp)
- $112,729
- List price
- $205,000
- Delta
- 81.85%
- Verdict
- OVERPRICED
- Comps
- 10 within 1.0 mi
Show comp detail 12 sales within ~0.75 mi
| Address | Dist | Beds/Ba | Sqft | Sold | Price | $/sf | Match |
|---|---|---|---|---|---|---|---|
| 21621 Sandia #83 | 0.05mi | 3/2.0 | 1,456 (+5%) | 3mo | $100,000 | $69 | 87 |
| 21621 Sandia Rd #163 | 0.05mi | 3/2.0 | 1,386 (0%) | 14mo | $150,000 | $108 | 87 |
| 21621 Sandia Rd #127 | 0.05mi | 3/2.0 | 1,300 (-6%) | 4mo | $155,000 | $119 | 85 |
| 21621 Sandia Rd #95 | 0.05mi | 3/2.0 | 1,300 (-6%) | 6mo | $139,000 | $107 | 83 |
| 21621 Sandia Rd #92 | 0.05mi | 3/2.0 | 1,344 (-3%) | 14mo | $119,000 | $89 | 81 |
| 21621 Sandia Rd #32 | 0.05mi | 3/2.0 | 1,296 (-6%) | 10mo | $105,000 | $81 | 79 |
| 21621 Sandia Rd #105 | 0.05mi | 2/2.0 (-1) | 1,440 (+4%) | 12mo | $144,900 | $101 | 76 |
| 21621 Sandia Rd #57 | 0.05mi | 3/2.0 | 1,568 (+13%) | 1mo | $112,000 | $71 | 75 |
| 21621-100 Sandia Rd | 0.07mi | 3/2.0 | 1,280 (-8%) | 12mo | $115,000 | $90 | 74 |
| 21621 Sandia Rd #42 | 0.05mi | 2/2.0 (-1) | 1,248 (-10%) | 8mo | $110,000 | $88 | 70 |
| 21621 Sandia Rd #39 | 0.05mi | 3/2.0 | 1,560 (+13%) | 9mo | $105,000 | $67 | 69 |
| 21621 Sandia Rd #98 | 0.05mi | 3/2.0 | 1,204 (-13%) | 12mo | $121,000 | $100 | 66 |
Match score weights: distance 35% · size 25% · config 20% · recency 20%. Top-matched comps best support the ARV.
Projected returns pro-forma
-3.0% appreciation · 4.3% rent growth · sell at horizon
- IRR
- -9.4%
- Equity multiple
- 0.65×
- Total profit
- $-20,033
- Equity at exit
- $30,566
- IRR
- 1.7%
- Equity multiple
- 1.13×
- Total profit
- $7,380
- Equity at exit
- $17,725
Cash invested: $57,400 (down + closing). Projections, not guarantees.
Landlord ↔ Tenant lean methodology
- Overall (STATE)
- 18 Strongly Tenant-Friendly
- State California
- 18 Strongly Tenant-Friendly · D+13
- County
- — inherits STATE
- City
- — inherits STATE
ZIP-level market 92308
- Home prices YoY
- -28.8%
- Rents YoY
- 4.3%
- Active inventory
- 429
- Price-to-rent
- 8.5×
Monthly cashflow live
- Estimated rent
- $2,002 high interval (Pro) →
- Mortgage (P&I)
- −$1,075
- Tax est. 1.5%
- −$256 /mo · $3,075/yr
- Insurance
- −$85
- HOA
- −$0
- Vacancy / Maint / Mgmt
- −$420
- Net cashflow
- $165
Break-even live
Sensitivity live
| Price | -10% $307 | -5% $236 | +0% $165 | +5% $94 | +10% $23 |
|---|---|---|---|---|---|
| Rent | -10% $7 | -5% $86 | +0% $165 | +5% $244 | +10% $323 |
| Rate | -1.0pp $268 | -0.5pp $217 | base $165 | +0.5pp $112 | +1.0pp $58 |
UW: 25.0% down · 7.5% · 30yr · 1.5% tax · 5.0% vac · 8.0% maint · 8.0% mgmt
Financing live
Cash to close
- Down payment
- $51,250
- Closing costs
- $6,150
- Reserves months
- —
- Total cash needed
- —
Loan-product check · same deal, 3 products live
Conventional
25% down · 7.5% · 30yr
- Down + closing
- —
- Monthly P&I
- —
- Monthly cashflow
- —
- DSCR
- —
- Eligible?
- —
Personal DTI + credit; lowest rate.
DSCR
20% down · 8.5% · 30yr
- Down + closing
- —
- Monthly P&I
- —
- Monthly cashflow
- —
- DSCR
- —
- Eligible?
- —
No personal income docs; deal must DSCR.
Hard money
10% down · 12.0% · 12mo
- Down + closing
- —
- Monthly P&I
- —
- Monthly cashflow
- —
- DSCR
- —
- Eligible?
- —
Short-term bridge; refi at stabilization.
Rent comps 12 comps
| Address | Beds | Baths | Sqft | Rent | $/sqft | DOM | Units | Dist |
|---|---|---|---|---|---|---|---|---|
| 11255 Mohawk Rd Apple Valley, CA | 2.0 | 2.0 | 1147 | $1,950 | $1.70 | 45d | 1 | 0.54mi |
| 11515 Chimayo Rd Apple Valley, CA | 3.0 | 2.0 | 1471 | $2,250 | $1.53 | 45d | 1 | 0.68mi |
| 21490 Bear Valley Rd Apt A Apple Valley, CA | 2.0 | 1.0 | 875 | $1,595 | $1.82 | 22d | 1 | 0.71mi |
| 11045 Kiowa Rd Apple Valley, CA | 2.0 | 2.0 | 1147 | $1,825 | $1.59 | 26d | 1 | 1.06mi |
| 12406 Pawnee Rd Apple Valley, CA | 3.0 | 1.5 | 1488 | $2,200 | $1.48 | 18d | 1 | 1.11mi |
| 12212 Kiowa Rd Unit 4 Apple Valley, CA | 2.0 | 2.0 | 990 | $1,700 | $1.72 | 7d | 1 | 1.17mi |
| 21777 Panoche Rd Unit 4 Apple Valley, CA | 2.0 | 2.0 | 930 | $1,400 | $1.51 | 4d | 1 | 1.17mi |
| 21777 Panoche Rd Unit 5 Apple Valley, CA | 2.0 | 2.0 | 930 | $1,450 | $1.56 | 7d | 1 | 1.17mi |
| 10868 Kiowa Rd Unit D Apple Valley, CA | 2.0 | 1.0 | 1000 | $1,500 | $1.50 | 1d | 1 | 1.23mi |
| 21181 Balsa St Apple Valley, CA | 3.0 | 2.0 | 1080 | $2,500 | $2.31 | 45d | 1 | 1.34mi |
| 10547 Cochiti Rd Apple Valley, CA | 2.0 | 1.0 | 927 | $1,649 | $1.78 | 45d | 1 | 1.37mi |
| 12401 Tesuque Rd Apple Valley, CA | 3.0 | 2.0 | 1506 | $2,245 | $1.49 | 45d | 1 | 1.41mi |
Listing history 16 events
-
2026-06-16days on market $205,000 Active 142 DOM
-
2026-06-15days on market $205,000 Active 141 DOM
-
2026-06-13days on market $205,000 Active 139 DOM
-
2026-06-13days on market $205,000 Active 138 DOM
-
2026-06-09days on market $205,000 Active 135 DOM
-
2026-06-08days on market $205,000 Active 134 DOM
-
2026-06-07days on market $205,000 Active 133 DOM
-
2026-06-04days on market $205,000 Active 130 DOM
-
2026-06-03days on market $205,000 Active 129 DOM
-
2026-06-02days on market $205,000 Active 128 DOM
-
2026-06-01days on market $205,000 Active 127 DOM
-
2026-05-31days on market $205,000 Active 126 DOM
-
2026-01-25$205,000 Active 1032-char remark
Show marketing remark (1032 chars)
BRAND NEW NEVER BEEN LIVED IN 3 bedroom, 2 bath home with 2 CAR GARAGE. MOUNTAIN VIEW VILLAS, gated senior 55+ community. This prestigious resort style living is offering one of the final opportunities to own a brand new home to a lucky few. This manufactured home will come with a 1 year home warranty, with window treatments, quality cabinetry throughout, laminate flooring, full size fridge, microwave, dishwasher, garbage disposal, & huge single sink. This is all owner occupied homes, no renter's with park rent only $786. There is a private clubhouse pool, spa, workout room, card room, full banquet style kitchen. A doggy park is available for your fur babies and RV storage upon availability. The Jess Ranch Market Place is minutes away for major shopping and entertainment. Just approximately 90 Minutes from LA & Orange Co. DEALER HAS A PREFERRED LENDER WITH AS LOW AS 5% DOWN. SELLER WILL CREDIT 3 MONTHS FREE SPACE RENT OR MAY BUY DOWN INTEREST RATE. Dealer#1254134, SP1578710.HOME Serial #CAV110AZ24-22052A/B
-
2025-12-31historical
-
2025-07-28price $210,000
-
2025-02-10$220,000 Active
ⓘ Source: listings_history table (triggers on properties + properties_extension) + one-shot
backfill from property_details.listing_events for pre-trigger history.
Climate risk First Street
- Flood 4/10 Moderate FEMA zone D · 20% chance over 30 yrs
- Wildfire 6/10 Major
- Heat 7/10 Severe 5 d/yr ≥99°F today · 14 d/yr by 30 yrs out
- Wind 1/10 Low
- Air quality 10/10 Extreme 25 unhealthy d/yr today · 30 by 30 yrs out
Nearby sold comps map
Loading sold comps map…
Walkable amenities ~0.75 mi
Loading nearby amenities…
Taxation est. · year 1
- Rental income
- $24,025
- − Mortgage interest
- −$11,483
- − Property taxes
- −$3,075
- − Insurance
- −$1,025
- − Repairs & maintenance
- −$1,922
- − Management
- −$1,922
- − Depreciation
- −$5,964
- Taxable loss
- −$1,366
- Est. tax savings @ 24.0%
- +$328
- After-tax cash flow
- $2,307/yr
For passive investors: Depreciation is non-cash, so a rental often shows a tax loss while cash-flowing — sheltering income. Rental losses are passive: they offset passive income freely, and up to $25,000/yr can offset ordinary (W-2) income if you actively participate and your MAGI is under $100k (phasing out to $0 by $150k); unused losses carry forward. On sale, claimed depreciation is recaptured at up to 25%, and gains may owe capital-gains tax (a 1031 exchange can defer both). Figures are a year-1 estimate at your 24.0% rate — not tax advice; consult a CPA.
Condition & rehab AI · 12 photos
This brand new, move-in-ready manufactured home in a gated senior community offers a pristine living environment with no immediate repairs or maintenance needed.
Value-add opportunities
- Both Landscaping — Enhances curb appeal and adds value
- Both Painting — Fresh paint can make the home more appealing
- Both Window treatments — Improves aesthetics and energy efficiency
Renovation cost estimate screening
Value-add ROI direction
- Both Landscaping — Enhances curb appeal and adds value ↑
- Both Painting — Fresh paint can make the home more appealing ↑
- Both Window treatments — Improves aesthetics and energy efficiency ↑
ⓘ Cost ranges are severity-bucket heuristics (US national rule-of-thumb). Get contractor quotes + a written scope before underwriting a rehab budget.
Schools (NCES district)
- District
- Apple Valley Unified
- NCES district ID
- 0600017
- Math proficiency
- 25% ▬ 0.00%
- Reading proficiency
- 40% ▬ 0.00%
- Median HH income
- $49,264
- Composite
- 30.91/100
- National rank
- #11351
- State rank
- #955 of 1400 in CA
Livability — Apple Valley
- Score
- 61/100
- State rank
- #532
- US rank
- #17800
Category grades
Schools grade is shown separately in the Schools card above.
Census & demographics
- Census place
- Apple Valley, CA
- County
- San Bernardino County · 2,030,291 people
- City population
- 83,889
- Metro
- Riverside-San Bernardino-Ontario, CA
- Population (ZIP)
- 42,709
- Household income
- $66,568
- Rent vs Own
- Severe rent burden
- 1389.0
Population outlook (San Bernardino County) Hauer SSP2
- Today (2025)
- 2,300,329 people
- By 2030
- 2,378,907 · +3.4%
- By 2040
- 2,523,137 · +9.7%
- By 2050
- 2,642,388 · +14.9%
- By 2075
- 2,880,769 · +25.2%
- By 2100
- 2,909,436 · +26.5%
Race, ethnicity, and origin ACS 2023
- Neighborhood character
- Diverse neighborhood (Simpson 0.65)
- Race & ethnicity
- White 44% Hispanic / Latino 38% Two or more races 19% Black 9% Asian 3%
- Hispanic origin (detail)
- Mexican 34%
- Common ancestry
- Italian 1% Iranian 1% Slovak 1%
- Foreign-born
- 11% · Canada, South Korea
- Languages at home
- 75% English-only · Spanish 20% Tagalog/Filipino 1% Other Asian/Pacific 1%
Political lean MEDSL · San Bernardino
- 2024 margin
- Toss-up / Even · D 47.5% · R 49.7% · Other 2.8%
- 2008→2024 swing
- -8.5pp toward R · 2008: 6.3pp · 2024: -2.1pp
- All cycles
- 2024: R+2.1 2020: D+10.7 2016: D+9.8 2012: D+5.4 2008: D+6.3
Not yet ingested
- Civics
- —
Market trends
- HPI YoY
- ▼ -145.60%
- Current HPI
- 359.2305
- Rent YoY
- ▲ 4.30%
- Metro
- Riverside-San Bernardino-Ontario, CA
- State GDP YoY
- ▲ 3.21%
- F500 in state
- 116
Industry mix (Fortune 500 HQ in CA)
| Industry | F500 HQs | Revenue |
|---|---|---|
| Technology | 27 | $1,492B |
|
||
| Financial Services | 3 | $174B |
|
||
| Retail | 3 | $44B |
|
||
| Insurance | 3 | $26B |
|
||
| Media / Entertainment | 2 | $115B |
|
||
| Pharmaceuticals / Biotech | 2 | $62B |
|
||
Price history
-6.8% since first listed4 events — show timeline
- 2026-01-25 Listed $205,000 CRMLS
- 2025-12-31 Listing Removed — CRMLS
- 2025-07-28 Price Changed $210,000 CRMLS
- 2025-02-10 Listed $220,000 CRMLS
Cash-flow waterfall
monthlySold comps — $/sqft
last 12 mo · ≤1 miLoading sold comps…