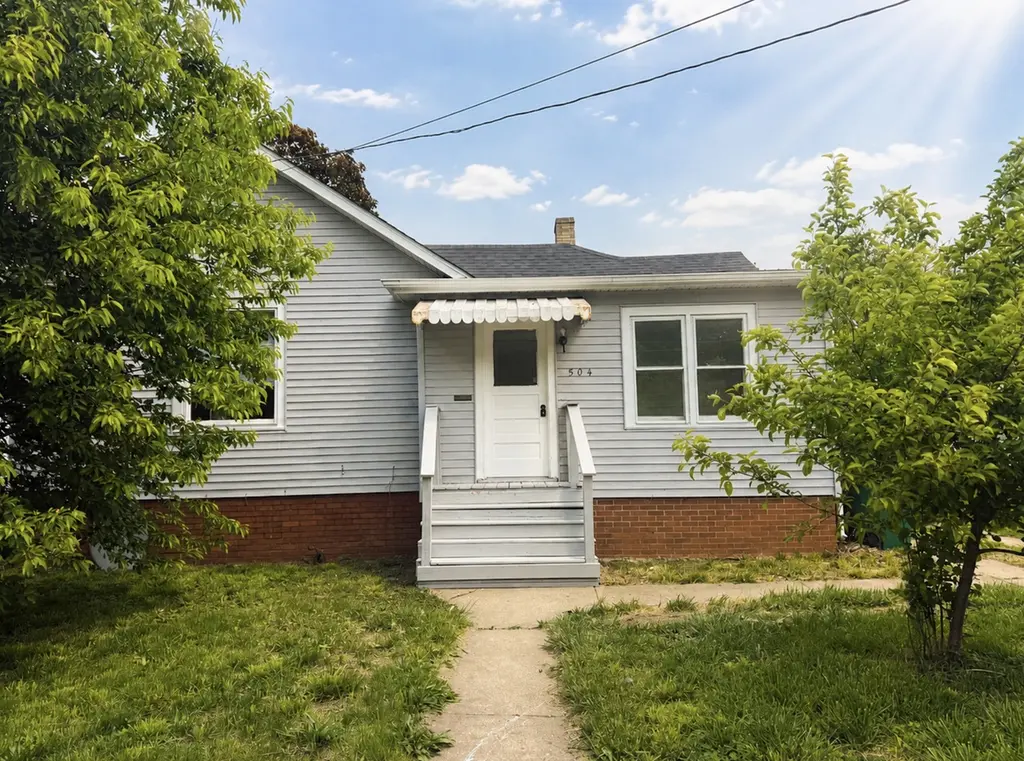
504 E Stanton St · Streator, IL
Flood risk 1/10 · Minimal
- FEMA flood zone
- X (unshaded)
- Chance of flooding over 30 yrs
- 0.0%
- Est. flood insurance / yr
- $473 – $860
Fire risk 1/10 · Minimal
- Est. fire insurance / yr
- $804 – $1,492
Heat risk 3/10 · Minor
- Hot days now (above 104°F)
- 7 days/yr
- Hot days in 30 yrs
- 17 days/yr
Wind risk 2/10 · Minimal
- Chance of severe wind over 30 yrs
- 1.0%
Air-quality risk 2/10 · Minimal
- Unhealthy air days now
- 1 days/yr
- Unhealthy air days in 30 yrs
- 1 days/yr
Risk factors via First Street. Map © Google.
Why this score? — see what drove the D+ grade
The composite is a weighted blend of 9 inputs, each scored 0–100. Each bar is that input's sub-score; the figure is the points it added to the 100-point composite (weight × sub-score).
- Cash flow +21.6/30.0
- DSCR +6.9/10.0
- 1% rule +5.8/10.0
- ARV discount +3.2/15.0
- Livability +3.2/5.0
- Rent growth +2.5/5.0
- Condition / age +2.5/5.0
- Schools +1.3/10.0
- Appreciation +0.0/10.0
$129,500
🖨 Deal sheet 📄 Offer letter ✓ Due diligence
Key facts
- 8,000 sq ft lot
- 2 parking spots
- Built 1884
Neighborhood map
What this means for you Summary
Snapshot
- This is a 3-bed/1.0-bath single-family listed at $130k.
Deal economics
- At list price, monthly cash flow is $197 ($2k/yr) — positive.
- The deal already cash-flows at list — no discount required.
- Meets the 1% rule at list price ($1k rent vs $130k).
- Recommended offer: $126k (3.0% below list) — sets the bar for market timing.
Location & tenants
- Location reads 63/100 on livability (#752 in IL) — a middle-class / working-renter tenant base. Strengths: cost of living A+, health & safety A+, housing B+; Watch: schools F, amenities F, commute F.
- Streator Twp Hsd 40 (town): math 11% / reading 19% proficiency, ranked #513 of 620 in IL (top 83%) — low school quality limits family demand, transient renter base, plan for 1-2y turnover.
- Market conditions: 87 active listings in the ZIP; 1 comparable units currently listed for rent nearby; 82 units permitted in LaSalle County in 2024 (0 in 5+ unit buildings).
Forward outlook
- Local home prices are declining (-3.0%/yr); year-one equity from $895 of loan paydown is wiped out by about $4k of value loss. Plan a longer hold.
- LaSalle County population projected at -16% by 2050 — secular population decline; favor cash flow + early exit over multi-decade hold.
Negotiation context
- It's been on market 38 days — a 3% lower offer ($126k) is reasonable based on typical stale-listing flexibility.
- 5 sale attempts since 17y ago with the ask held roughly flat each time — persistent listings suggest the price (not the market) is what's stuck; bring a comps-based counter.
- Current owner paid $9k; list at $130k implies a 1339% gain — meaningful room to come down on a strong offer.
Risks & watch-outs
- Watch-outs: built in 1884 — expect roof / HVAC / electrical / plumbing capex.
Questions for the listing agent
- It's been on market 38 days. Have you received any prior offers? Is the seller open to a 3% concession, seller financing, or rate buy-down credit?
- Built in 1884 — when were the roof, HVAC, electrical panel, plumbing, and water heater last replaced?
- Is there a deadline driving the sale (1031 exchange, divorce, estate, relocation)? That informs how much negotiation room exists.
- Schools are F-rated, which usually means shorter tenancies and higher turnover. Who's the typical renter profile here, and what's been the actual vacancy rate?
- The area grade is low — what's the realistic commute time and amenity access for the typical tenant pool here? Any planned neighborhood developments (good or bad) we should know about?
- What's the average days-on-market for RENTAL listings here right now (not sales)? A rising rental-DOM trend means longer vacancies and softer asking-rent achievability than the comps imply.
- What's the recent tenant-quality profile in this submarket — average credit score on applications, eviction rate, late-payment / NSF rate, and stable-employment percentage? A property-management company in the area should have these aggregated.
- How much new for-sale + rental construction is in the pipeline within 1–3 miles? Heavy new supply typically softens prices + rents 12–24 months out; constrained supply supports both.
Investment metrics
- 1% rule
- 1.08% ✓
- Cap rate
- 8.12%
- Cash-on-cash
- 6.53%
- DSCR
- 1.29
- GRM
- 7.7
CMA / ARV
- ARV (on-the-fly)
- $118,320
- Comps found
- 12
Show comp detail 12 sales within ~0.75 mi
| Address | Dist | Beds/Ba | Sqft | Sold | Price | $/sf | Match |
|---|---|---|---|---|---|---|---|
| 910 N Bloomington St | 0.30mi | 3/1.5 | 1,020 (+3%) | 3mo | $144,001 | $141 | 76 |
| 1012 N Bloomington St | 0.29mi | 3/1.0 | 1,050 (+6%) | 2mo | $100,000 | $95 | 74 |
| 1603 N Sterling St | 0.51mi | 3/1.0 | 960 (-3%) | 3mo | $67,000 | $70 | 70 |
| 904 Johnson St | 0.56mi | 3/1.5 | 975 (-1%) | 1mo | $164,000 | $168 | 69 |
| 107 W Larue St | 0.37mi | 2/1.0 (-1) | 950 (-4%) | 4mo | $115,000 | $121 | 69 |
| 403 N Wasson St | 0.44mi | 3/1.0 | 1,078 (+9%) | 1mo | $121,887 | $113 | 63 |
| 608 N Shabbona St | 0.36mi | 3/1.5 | 1,120 (+14%) | 1mo | $120,000 | $107 | 57 |
| 112 W Grant St | 0.35mi | 2/1.0 (-1) | 1,108 (+12%) | 3mo | $65,000 | $59 | 56 |
| 304 W Morrell St | 0.50mi | 2/1.0 (-1) | 1,125 (+14%) | 1mo | $135,000 | $120 | 48 |
| 416 N Colorado Ave | 0.62mi | 3/2.0 | 884 (-10%) | 2mo | $156,000 | $176 | 48 |
| 917 Johnson St | 0.59mi | 2/1.0 (-1) | 864 (-12%) | 1mo | $67,000 | $78 | 46 |
| 424 W Bluff St | 0.68mi | 2/1.0 (-1) | 1,100 (+12%) | 1mo | $145,000 | $132 | 43 |
Match score weights: distance 35% · size 25% · config 20% · recency 20%. Top-matched comps best support the ARV.
Projected returns pro-forma
-3.0% appreciation · 3.0% rent growth · sell at horizon
- IRR
- -6.2%
- Equity multiple
- 0.77×
- Total profit
- $-8,395
- Equity at exit
- $19,309
- IRR
- 3.4%
- Equity multiple
- 1.25×
- Total profit
- $8,979
- Equity at exit
- $11,197
Cash invested: $36,260 (down + closing). Projections, not guarantees.
Landlord ↔ Tenant lean methodology
- Overall (STATE)
- 43 Moderately Tenant-Leaning
- State Illinois
- 43 Moderately Tenant-Leaning · D+7
- County
- — inherits STATE
- City
- — inherits STATE
ZIP-level market 61364
- Home prices YoY
- -31.1%
- Active inventory
- 87
- Price-to-rent
- 7.7×
Monthly cashflow live
- Estimated rent
- $1,397 medium interval (Pro) →
- Mortgage (P&I)
- −$679
- Tax from tax record
- −$173 /mo · $2,080/yr
- Insurance
- −$54
- HOA
- −$0
- Vacancy / Maint / Mgmt
- −$293
- Net cashflow
- $197
Break-even live
UW: 25.0% down · 7.5% · 30yr · 1.5% tax · 5.0% vac · 8.0% maint · 8.0% mgmt
Financing live
Cash to close
- Down payment
- $32,375
- Closing costs
- $3,885
- Reserves months
- —
- Total cash needed
- —
Loan-product check · same deal, 3 products live
Conventional
25% down · 7.5% · 30yr
- Down + closing
- —
- Monthly P&I
- —
- Monthly cashflow
- —
- DSCR
- —
- Eligible?
- —
Personal DTI + credit; lowest rate.
DSCR
20% down · 8.5% · 30yr
- Down + closing
- —
- Monthly P&I
- —
- Monthly cashflow
- —
- DSCR
- —
- Eligible?
- —
No personal income docs; deal must DSCR.
Hard money
10% down · 12.0% · 12mo
- Down + closing
- —
- Monthly P&I
- —
- Monthly cashflow
- —
- DSCR
- —
- Eligible?
- —
Short-term bridge; refi at stabilization.
Rent comps 1 comps
| Address | Beds | Baths | Sqft | Rent | $/sqft | DOM | Units | Dist |
|---|---|---|---|---|---|---|---|---|
| 402 S Illinois St Streator, IL | 2.0 | 1.0 | 1116 | $1,550 | $1.39 | 22d | 1 | 1.03mi |
Listing history 31 events
-
2026-06-19days on market $129,500 Active 38 DOM
-
2026-06-18days on market $129,500 Active 37 DOM
-
2026-06-17days on market $129,500 Active 36 DOM
-
2026-06-17price $129,500 Active 35 DOM
-
2026-06-16days on market $135,000 Active 35 DOM
-
2026-06-15days on market $135,000 Active 34 DOM
-
2026-06-14days on market $135,000 Active 32 DOM
-
2026-06-12days on market $135,000 Active 31 DOM
-
2026-06-09days on market $135,000 Active 28 DOM
-
2026-06-08days on market $135,000 Active 27 DOM
-
2026-06-07days on market $135,000 Active 26 DOM
-
2026-06-05days on market $135,000 Active 23 DOM
-
2026-06-03days on market $135,000 Active 22 DOM
-
2026-06-02days on market $135,000 Active 21 DOM
-
2026-06-01days on market $135,000 Active 20 DOM
-
2026-05-31days on market $135,000 Active 19 DOM
-
2026-05-30days on market $135,000 Active 18 DOM
-
2026-05-12$135,000 Active
-
2018-08-17historical
-
2018-07-05price
-
2018-03-01price
-
2017-12-08New
-
2015-07-30historical
-
2015-03-14New
-
2010-11-16soldstatus $9,000 Closed Sale
-
2010-11-12status Pending
-
2010-11-02historical
-
2010-10-28historical
-
2010-10-28$9,000
-
2010-01-28historical
-
2009-07-27
ⓘ Source: listings_history table (triggers on properties + properties_extension) + one-shot
backfill from property_details.listing_events for pre-trigger history.
Tax reassessment forecast IL · Partial reset (capped growth)
- Current annual tax
- $2,080 · $173/mo
- Projected year-2 tax
- $2,510 · $209/mo
- Expected delta
- +$430/yr (+$36/mo · 20.7%)
ⓘ Screening estimate from a state-policy table — verify with the county assessor before closing.
Climate risk First Street
- Flood 1/10 Low FEMA zone X (unshaded) · 0% chance over 30 yrs
- Wildfire 1/10 Low
- Heat 3/10 Moderate 7 d/yr ≥104°F today · 17 d/yr by 30 yrs out
- Wind 2/10 Low 100% chance of damaging wind over 30 yrs
- Air quality 2/10 Low 1 unhealthy d/yr today · 1 by 30 yrs out
Nearby sold comps map
Loading sold comps map…
Walkable amenities ~0.75 mi
Loading nearby amenities…
Taxation est. · year 1
- Rental income
- $16,764
- − Mortgage interest
- −$7,254
- − Property taxes
- −$2,080
- − Insurance
- −$648
- − Repairs & maintenance
- −$1,341
- − Management
- −$1,341
- − Depreciation
- −$3,767
- Taxable income
- $333
- Est. tax owed @ 24.0%
- −$80
- After-tax cash flow
- $2,287/yr
For passive investors: Depreciation is non-cash, so a rental often shows a tax loss while cash-flowing — sheltering income. Rental losses are passive: they offset passive income freely, and up to $25,000/yr can offset ordinary (W-2) income if you actively participate and your MAGI is under $100k (phasing out to $0 by $150k); unused losses carry forward. On sale, claimed depreciation is recaptured at up to 25%, and gains may owe capital-gains tax (a 1031 exchange can defer both). Figures are a year-1 estimate at your 24.0% rate — not tax advice; consult a CPA.
Schools (NCES district)
- District
- Streator Twp Hsd 40
- NCES district ID
- 1738100
- Math proficiency
- 11% ▼ -4.00%
- Reading proficiency
- 19% ▼ -1.00%
- Median HH income
- $43,002
- Composite
- 13.07/100
- National rank
- #9561
- State rank
- #513 of 620 in IL
Livability — Streator
- Score
- 63/100
- State rank
- #752
- US rank
- #15266
Category grades
Schools grade is shown separately in the Schools card above.
Census & demographics
- Census place
- Streator, IL
- County
- La Salle County · 41,676 people
- City population
- 17,963
- Metro
- Ottawa, IL
- Population (ZIP)
- 17,963
- Household income
- $59,060
- Rent vs Own
- Severe rent burden
- 450.0
Population outlook (LaSalle County) Hauer SSP2
- Today (2025)
- 107,080 people
- By 2030
- 104,196 · -2.7%
- By 2040
- 97,413 · -9.0%
- By 2050
- 90,294 · -15.7%
- By 2075
- 76,252 · -28.8%
- By 2100
- 61,339 · -42.7%
Race, ethnicity, and origin ACS 2023
- Neighborhood character
- Predominantly White (83%)
- Race & ethnicity
- White 83% Hispanic / Latino 11% Two or more races 4% Black 3%
- Hispanic origin (detail)
- Mexican 10%
- Common ancestry
- Romanian 3% Lithuanian 2% Slovak 2%
- Foreign-born
- 3% · Canada
- Languages at home
- 93% English-only · Spanish 6%
Political lean MEDSL · LaSalle
- 2024 margin
- R (+18.5) · D 40.1% · R 58.6% · Other 1.3%
- 2008→2024 swing
- -29.6pp toward R · 2008: 11.1pp · 2024: -18.5pp
- All cycles
- 2024: R+18.5 2020: R+14.3 2016: R+14.4 2012: R+0.4 2008: D+11.1
Not yet ingested
- Civics
- —
Market trends
- HPI YoY
- ▼ -105.28%
- Current HPI
- 233.5533
- Rent YoY
- —
- Metro
- Ottawa, IL
- State GDP YoY
- ▲ 1.59%
- F500 in state
- 60
Industry mix (Fortune 500 HQ in IL)
| Industry | F500 HQs | Revenue |
|---|---|---|
| Insurance | 4 | $201B |
|
||
| Consumer Goods | 4 | $87B |
|
||
| Industrial Machinery | 3 | $64B |
|
||
| Healthcare | 2 | $55B |
|
||
| Retail / Pharmacy | 1 | $148B |
|
||
| Agriculture / Food | 1 | $86B |
|
||
Price history
+1400.0% since first listed14 events — show timeline
- 2026-05-12 Listed $135,000 MRED as Distributed by MLS Grid
- 2018-08-17 Listing Removed — MRED as Distributed by MLS Grid
- 2018-07-05 Price Changed — MRED as Distributed by MLS Grid
- 2018-03-01 Price Changed — MRED as Distributed by MLS Grid
- 2017-12-08 Listed — MRED as Distributed by MLS Grid
- 2015-07-30 Listing Removed — MRED as Distributed by MLS Grid
- 2015-03-14 Listed — MRED as Distributed by MLS Grid
- 2010-11-16 Sold (MLS) $9,000 MRED as Distributed by MLS Grid
- 2010-11-12 Pending — MRED as Distributed by MLS Grid
- 2010-11-02 Listing Removed — MRED as Distributed by MLS Grid
- 2010-10-28 Listed $9,000 MRED as Distributed by MLS Grid
- 2010-10-28 Listing Removed — MRED as Distributed by MLS Grid
- 2010-01-28 Listing Removed — MRED as Distributed by MLS Grid
- 2009-07-27 Listed — MRED as Distributed by MLS Grid
Property tax history
+2.6%/yrLatest (2024): $2,080 · +8.6% YoY. Source: county tax records.
Cash-flow waterfall
monthlySold comps — $/sqft
last 12 mo · ≤1 miLoading sold comps…